1825
Effect of hyperglycemia on deep nucleus microstructure and iron deposition in people with type 2 diabetes: a DKI and SWI study1Department of Radiology,First Affiliated Hospital of Dalian Medical University, Dalian 116011, People's Republic of China, 2GE healthcare China, Beijing
Synopsis
In this paper,the experimental group and the control group were respectively used as the people with type 2 diabetes and the health people ,the effect of high blood glucose on the microstructure and iron deposition in patients with type 2 diabetes mellitus was studied used DKI and SWI study,and it is concluded that the high blood glucose level may have certain damage to the microstructure of the deep core.Furthermore,iron deposition may exacerbate the damage of microstructure.In conclusion,DKI and SWI study can evaluate secondary brain microstructure changes from hyperglycemia in T2DM patients.
Objective
More and more studies found the cognitive impairment results from hyperglycemia in T2DM patients. The cognitive status in T2DM may be associated with the deep nucleus changes detected by DKI and SWI, up to date it is unclear. The objective of this study is to assess to the relationship between glycemic index and deep nucleus abnormalities with diffusion kurtosis and phase measured by DKI and SWI.Materials and Methods
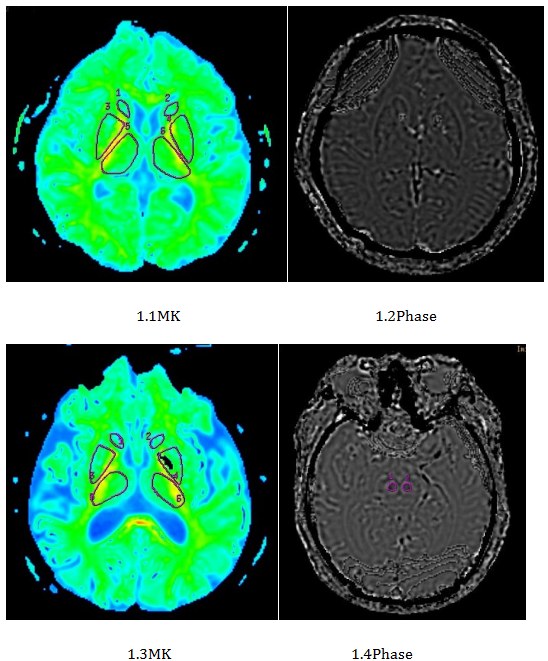
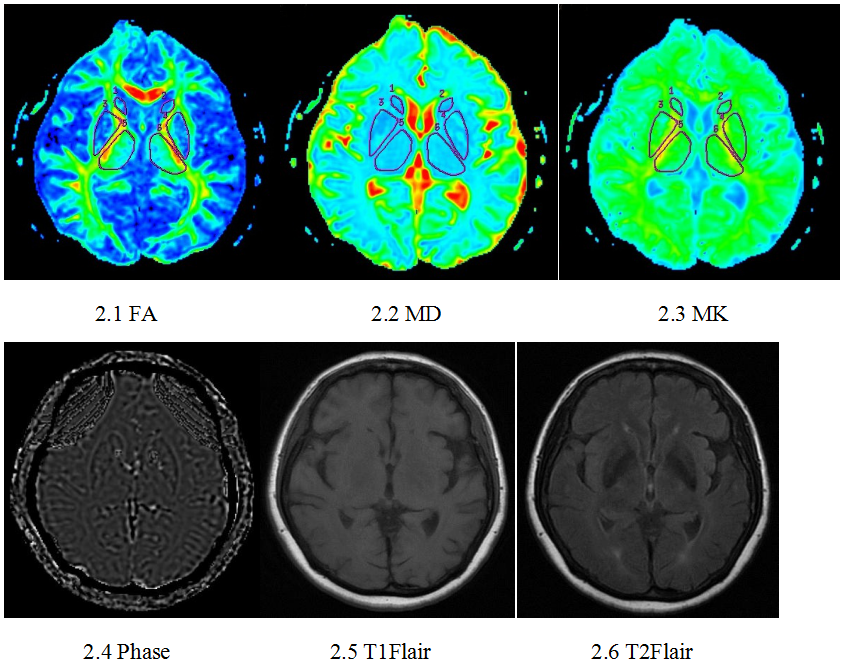
This prospective study was approved by the hospital ethics committee. The study include 29 cases of T2DM patients hospitalized (15 males, 14 females) as DM group. Twenty healthy volunteers were recruited as control group (11 males, 9 females). All performed MR protocols included conventional MRI, diffusion kurtosis imaging (DKI), susceptibility weighted imaging (SWI) using the GE signa HDXT 3.0T MRI system with 8-channel head coil. The MK values、MD values、FA values and Phase values were measured in bilateral globus pallidus(GP), putamen(PUT), head of caudate nucleus(HCN),substantia nigra(SN),red nucleus(RN) and thalamus(THA) The raw DKI and SWI data is processed by using ADW4.4 workstation and SPIN software(Signal process in neuroimaging).
All Measurement data are shown as mean value and standard deviation. Each DKI and SWI values conforms to normal distribution and compared between groups by two independent samples t-test group analysis in SPSS 17.0 software. Blood pressure, blood fat, age and course of the disease as control factors, the correlations of imaging variables and the HbA1C were analyzed by partial correlation analysis. All statistical results were P <0.05 as statistically significant.
Result
Compared to the controls, MK value in T2DM patients significantly increased in HCN,PUT,GP and THA (P<0.01). Mean MD value markedly increased in HCN and SN (P<0.05) in T2DM than in controls. Only in RN was the FA value significantly decreased (P=0.04).In Comparision to that in the controls (left:0.270±0.09,right:0.256±0.09),the mean phase values of T2DM significantly decreased in bilateral RN (left:0.157±0.11, PL=0.017; right:0.154±0.09, PR=0.014).
A positive correlation between the FA value in SN and the HbA1C was found(r L=0.80, PL=0.005;r R=0.67, PR=0.036) . Moreover, there were negative correlations between the MD values and the HbA1C in putamen (r =-0.68, P=0.031;r =-0.68, P=0.030). A positive correlation was found between the MK value in RN and the HbA1C (r =0.63, P=0.05).
Discussion
In this studies, the MK value of gray nucleus in T2DM was significantly higher than that of healthy control group, which illustrate that the part of the structure of gray nucleus in T2DM is complex and water molecular diffusion significantly limited. When the lesion is involved in axon or myelin sheath,the FA value of the affected area will be reduced in varying degrees and the decrease degree reflects the fiber bundle damage degree. This study shows that the phase of deep brain nuclei in T2DM patients was lower than that in healthy control group. In patients with T2DM, the phase value of bilateral red nucleus was significantly decreased. According to that, it was speculated that there was a trend of iron deposition in the gray matter nuclei in the brain of T2DM patients, which was higher than that in the control group. Compared with the normal,multiple parameters of DKI found abnormal in the deep nucleus,and there is a clear relationship between these parameters and the level of HBA1C which is suggested that the high blood glucose level has certain damage to the microstructure of the deep nucleus.Furthermore,DKI can be used to detect abnormal nuclear clusters.[1.2]Probably the reason of the decrease in phase on RN in T2DM patients is that the excessive deposition of iron or manganese plasma[3].Iron deposition may lead to increased microstructure damage in RN,which has increased the ionic hypothesis for the mechanism of brain injury in T2DM.[4].Conclusion
MK value、FA value、MD value、phase value in deep nucleus, especially RN, can evaluate secondary brain microstructure changes from hyperglycemia in T2DM patients.Acknowledgements
No acknowledgement found.References
[1]Brain MRI Correlates of Cognitive Dysfunction in Type 2 Diabetes:The Needle Recovered From the Haystack.DIABETES CARE,Volume 36,December 2013.
[2]Geert Jan Biessels and Yael D.Reijmer.Brain Changes Underlying Cognitive Dysfunction in Diabetes:What Can We Learn From MRI?DIABETES Volume 63.July 2014.
[3]Francesca Bagnato,Simon Hametner,etc.Tracking iron in multiple sclerosis:a combined imaging and histopathological study at 7 Tesla.BRAIN.2011:134;3599~3612.
[4]Michiel Sala,Albert de Roos,Annette van den Berg.Microstructural Brain Tissue Damage in Metabolic Syndrome.Diabetes Care Volume 37,February 2014.493~500.
Figures