1824
Evaluation of diffusion weighted imaging (DWI), kurtosis imaging (DKI) and q-space imaging (QSI) for profiling whole human breast tumour tissue microstructure1Aberdeen Biomedical Imaging Centre, University of Aberdeen, Aberdeen, United Kingdom, 2Breast Unit, Aberdeen Royal Infirmary, Aberdeen, United Kingdom, 3School of Medicine, University of Aberdeen, Aberdeen, United Kingdom, 4Pathology Department, Aberdeen Royal Infirmary, Aberdeen, United Kingdom, 5MRI Unit, The Francis Crick Institute, London, United Kingdom
Synopsis
We investigated a clinically viable QSI protocol in whole breast tumours excised from patients on a clinical scanner within a clinically feasible time frame. QSI has been largely limited to the preclinical setting, requiring strong gradients and a long acquisition time. We compared QSI against conventional DWI and DKI and found that diffusion indices across these techniques were consistent. Previous studies have shown that QSI provides a comprehensive characterisation of tissue microstructure, particularly in the presence of restricted diffusion. These results provide pivotal foundation for the clinical translation of QSI in breast cancer diagnosis and prognosis.
Introduction
Although DWI is a well-established
methodology for cancer imaging providing a basic summary of diffusion
properties, it is inadequate for a complete picture of the tissue microstructure
environment. Recently DKI, capable of detecting deviation from free diffusion, has
been applied for clinical cancer assessment.1 QSI provides a comprehensive
assessment of diffusion pattern, allowing refined analysis of tissue
microstructure.2 However, QSI is largely limited to the
preclinical setting, due to the need of strong gradients and a long acquisition
time, with human application so far in the central nervous system.3 We therefore set out to compare and characterise DWI, DKI and QSI collected
from whole breast tumours excised from patients on a clinical scanner, with
each sequence duration confined within a clinically feasible time frame.
Methods
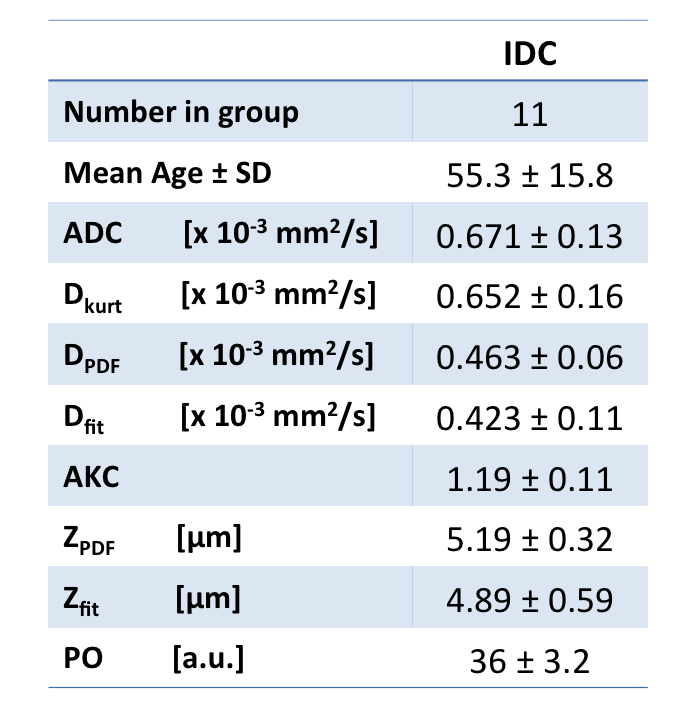
Eleven female patients (age 55.3 ± 15.8yrs) with invasive ductal carcinoma undergoing wide local excision were enrolled in the study. The patients had not received any hormonal therapy or chemotherapy. To ensure no delay to the pathological reporting, formalin was added to the excised whole tumour specimen and imaged on the same day. The study was approved by NHS Ethics Service, and written informed consent was obtained prior to imaging.Data Acquisition
Images were acquired on a 3T MRI scanner (Achieva TX, Philips Healthcare, Best, Netherlands) using body coil for transmission and a 32-channel coil as the receiver. The imaging protocol contained T2 weighted anatomical images, DWI, DKI and QSI. T1 and T2 mapping were performed before and after each diffusion scan to monitor tissue change. Diffusion acquisitions were performed with multi-shot pulsed gradient spin echo (PGSE) sequence, with FOV of 141x141mm, slice thickness of 2.2mm, matrix size of 64x64. A horizontal imaging volume, containing 7-10 slices depending on tumour size with saturation bands was positioned around tumour core to suppress formalin signal. QSI was acquired using 32 q values from 10.4 to 655.3cm-1 (a corresponding maximum b value of 5,000s/mm2) with TR/TE of 5900/94ms and diffusion timings δ/Δ of 24.9/37.8ms, effective diffusion time of 29.5ms and scan duration 48min. DKI was acquired using 16 b values from 0 to 2400s/mm2 with TR/TE of 3100/82ms, 2 averages, duration 25min28s. DWI was acquired using b values 0 and 800s/mm2 with TR/TE of 3000/70ms, duration 2min21s. All diffusion weightings were performed along 3 orthogonal directions in sequential order, with corresponding images averaged.Image Processing
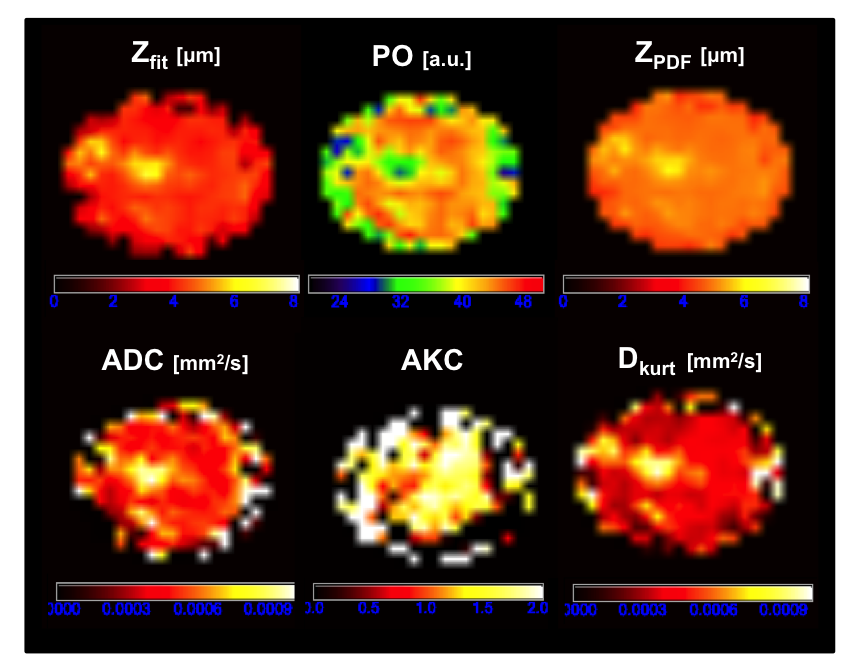
Data was analysed using in house software in MATLAB (MathWorks, Massachusetts, USA). QSI was Fourier transformed pixel-wise to produce the displacement probability distribution function (PDF) map after zero filling and mirroring, with the probability of zero displacement (PO) and root mean square (RMS) displacement (ZPDF) quantified.3 QSI was also fitted to Fourier transform expansion to derive RMS displacement (Zfit) using non-linear least square fitting algorithm on a pixel by pixel basis.4 The apparent diffusion coefficients (DPDF and Dfit) were subsequently derived from ZPDF and Zfit respectively.5 DKI was analysed using non-linear least square fitting to derive apparent diffusion coefficient (Dkurt) and apparent kurtosis coefficient (AKC).6 Apparent diffusion coefficient (ADC) was computed based on logarithmic signal reduction between the two b values in DWI.Statistical Analysis
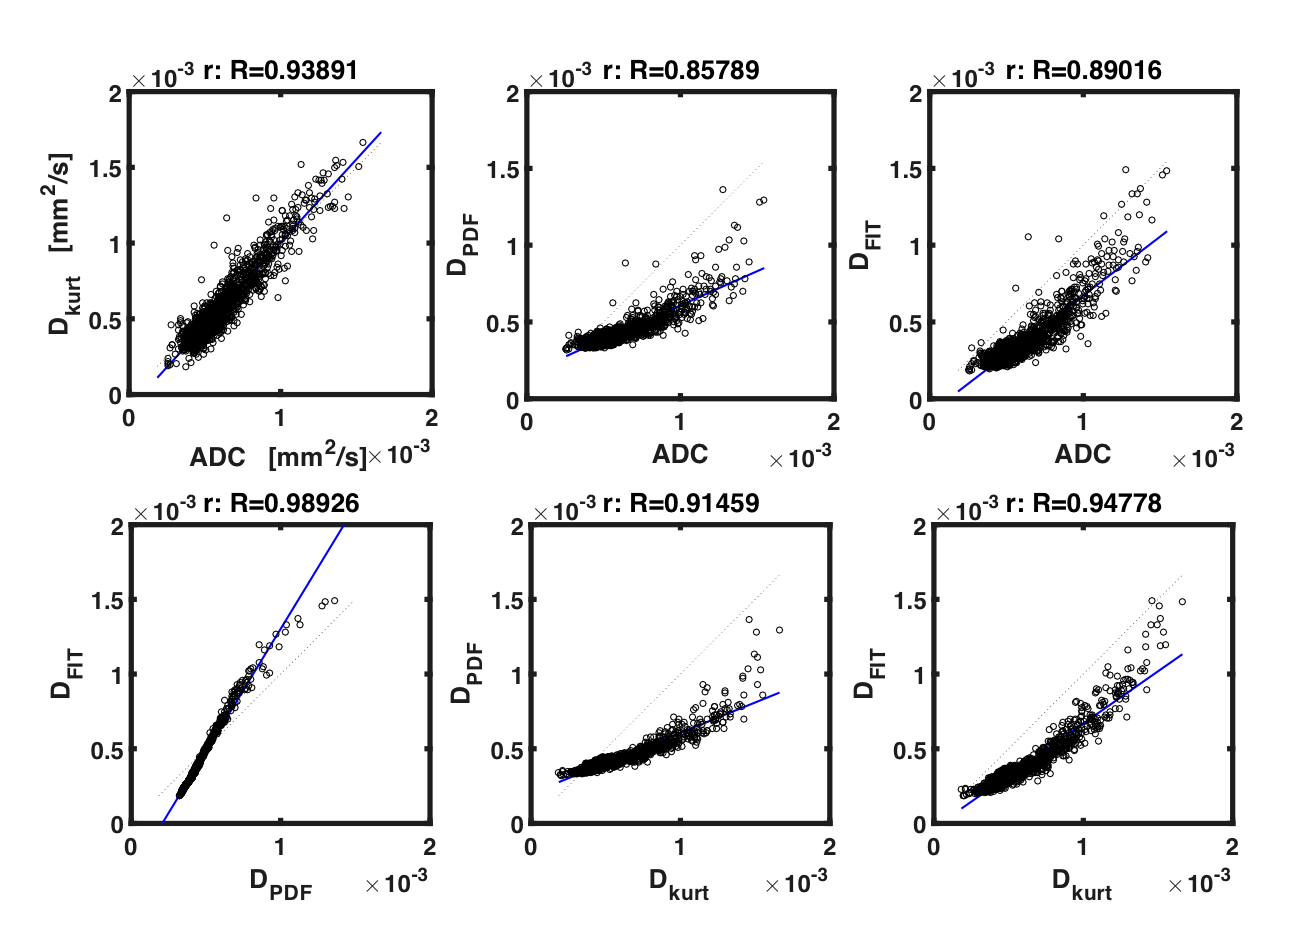
The parameter maps were further interrogated using regions of interest (ROI) analysis, where ROIs were defined as tumour area delineated on the acquired anatomical images. The mean across the ROI for each individual sample was subsequently computed. The voxels within the ROIs from all the samples were pooled to allow direct diffusion coefficient comparison on identical pixels. Subsequently correlation analysis was performed on permuted pairs of ADC, Dkurt, DPDF and Dfit over the entire pooled voxel population, to assess the agreement between different approaches.Results
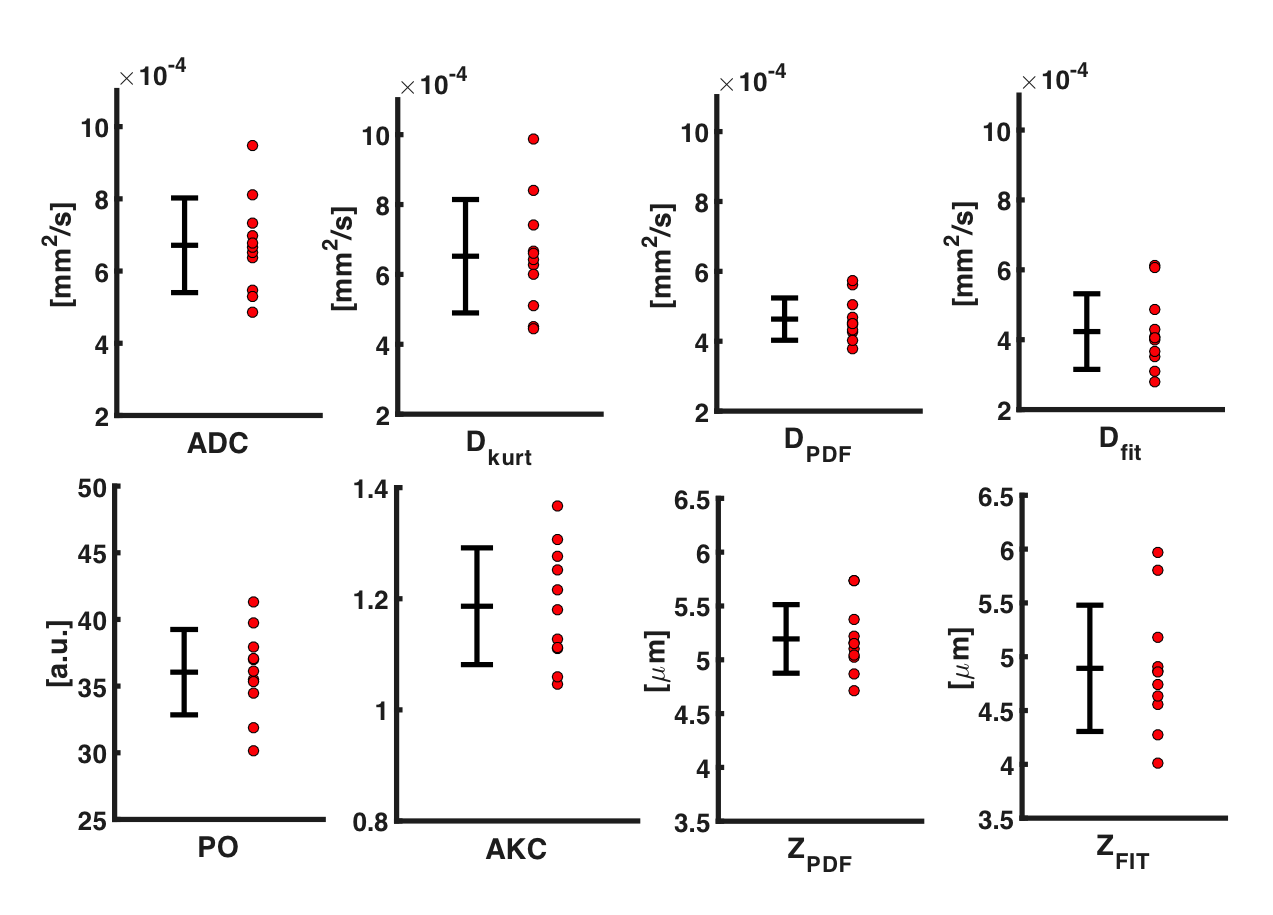
Visual inspection of the mapped indices in Figure 1 indicates that the diffusion indices are consistent across DWI, DKI and QSI. This is reflected in Figure 2, which shows consistent ROI mean diffusion indices across the patient group (Table 1). Figure 3 further demonstrates this with significant linear correlation between the pooled apparent diffusion coefficients. However, a degree of non-linearity is indicated between the QSI indices and both DKI and DWI indices.Discussion
In this work, we performed DWI, DKI and QSI on whole breast tumour specimens on a clinical scanner within a clinically feasible time frame. Our results are in agreement with diffusion imaging of tumour acquired using preclinical systems.2,7 We further showed consistency between the methods, demonstrating the validity. Non-linearity indicated between the QSI indices and both the DKI and DWI indices may reflect the QSI potential to characterise restricted diffusion. These results provide pivotal foundation for the clinical translation of QSI in breast cancer diagnosis and prognosis.Acknowledgements
The authors would like to thank Dr Matthew Clemence for clinical scientist support, Bolanle Awote for patient recruitment and Gordon Buchan for technical support. This project is funded by a NHS Grampian Endowment Research Grant, and Nicholas Senn is supported by BBSRC PhD studentship.References
1. Sun, K., Chen, X., Chai, W., et al. Breast Cancer: Diffusion Kurtosis MR Imaging-Diagnostic Accuracy and Correlation with Clinical-Pathologic Factors. Radiology, 2015;277(1), 46–55.
2. Yamada, I., Hikishima, K., Miyasaka, N., et al. Esophageal carcinoma: Evaluation with q-space diffusion-weighted MR imaging ex vivo. Magnetic Resonance in Medicine, 2015;73(6), 2262–2273.
3. Assaf, Y., Ben Bashat, D., Chapman, J., et al. High b-value q-space analyzed diffusion-weighted MRI: Application to multiple sclerosis. Magnetic Resonance in Medicine, 2002;47(1), 115–126.
4. Ong, H. H., & Wehrli, F. W. Quantifying axon diameter and intra-cellular volume fraction in excised mouse spinal cord with q-space imaging. NeuroImage, 2010;51(4), 1360–1366.
5. Farrell, J. A. D., Smith, S. A., Gordon-Lipkin, E. M., et al. High b-value q-space diffusion-weighted MRI of the human cervical spinal cord in vivo: feasibility and application to multiple sclerosis. Magnetic Resonance in Medicine, 2008;59(5), 1079–1089.
6. Jensen, J. H., Helpern, J. A., Ramani, A., et al. Diffusional kurtosis imaging: The quantification of non-gaussian water diffusion by means of magnetic resonance imaging. Magnetic Resonance in Medicine, 2005;53(6), 1432–1440.
7. Norddin, N., Power, C., Watson, G., et al. Microscopic diffusion properties of fixed breast tissue: Preliminary findings. Magnetic Resonance in Medicine, 2015;74(6), 1733–1739.
Figures