1820
Diffusion weighted imaging of the cerebello-thalamic pathway after MR guided high intensity focused ultrasound (HIFU) thalamotomy1Centro Integral de Neurociencias AC (CINAC), HM Puerta del Sur, Hospitales de Madrid, Móstoles, Spain, 2Centro Integral de Neurociencias AC (CINAC), HM Puerta del Sur, Hospitales de Madrid, Móstoles, 3CEU San Pablo University, Madrid, Spain
Synopsis
In here we aimed at characterizing the impact of the HIFU thalamotomy over the cerebello-thalamic pathway. We used probabilistic tractography to map the subject-specific anatomy of this pathway, we defined a set of regions along a group average pathway, and we extracted DTI based average values in these regions. We found local and distant alterations along the pathway 3-months post-treatment. These changes were strongly correlated with the clinical improvement of the patients. These findings serve to strengthen DWI, as a tool to aid in the targeting of HIFU in the treatment of essential tremor.
Purpose
The objectives of this study were to use diffusion weighted imaging (DWI) to investigate the impact of HIFU thalamotomy for the treatment of essential tremor (ET) over the cerebelo-thalamic pathway, and to relate this impact with the clinical improvement of the patients.Methods
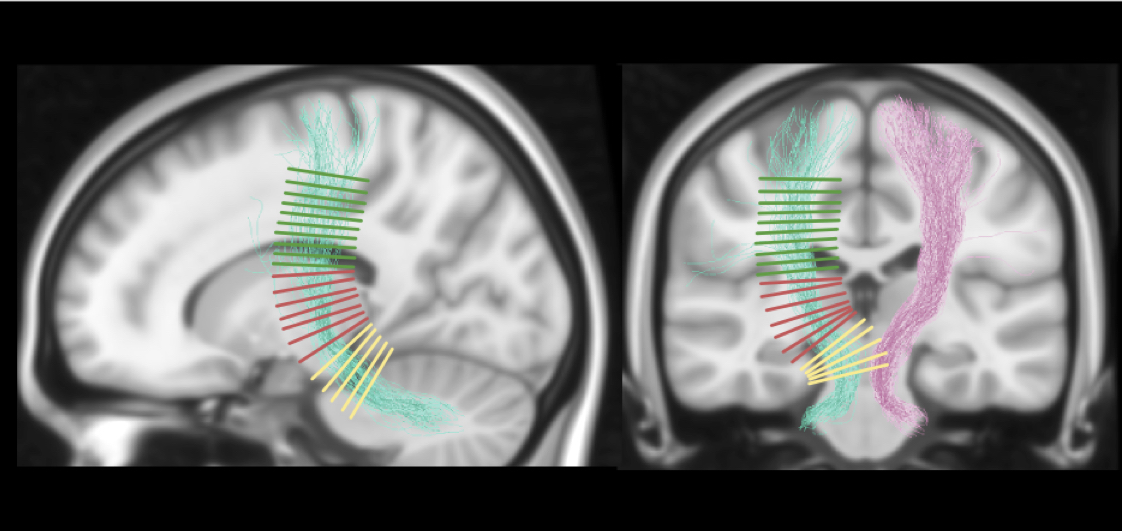
Ten patients with disabling and medication-refractory ET underwent HIFU thalamotomy targeting the thalamic ventralis intermedialis (VIM) nucleus, contralateral to the clinically more affected hemibody. MRI was acquired on a 3T General Electric Discovery 750w scanner using a transmit/receive head coil with 32-channels. MRI was obtained for all patients at baseline (T1 and DWI), 1-day post-treatment (T1, T2, FLAIR and SWI), and 3-months post-treatment (T1, T2, SWI and DWI). DWI was acquired using a single-shot spin-echo EPI sequence [TR/TE 13500/106.9ms, 2x2mm in-plane resolution and 2mm slice thickness]. Diffusion was measured along 60 encoding directions with b =1000s/mm2. In addition, 4 images with b = 0, and another 4 with phase encoding direction reversed were acquired. Tremor was assessed in all sessions using the Clinical Rating Scale for Tremor (CRST), where higher scores indicate higher severity of tremor. Lesion tissue was segmented at 1-day and 3-months post-treatment using T1 hypointense area, and T2 or SWI hyperintense area, by two independent raters. DWI was pre-processed following standard guidelines, including denoising with local PCA, motion correction and gradients rotation, field-inhomogeneity correction using eddy-FSL, bias field correction and intensity normalization using MRtrix. Fibre orientation distributions were computed using Constrained Spherical Deconvolution1. The cerebello-thalamic projection was reconstructed using probabilistic tractography and using the dentate nucleus as seed, and the thalamus and the precentral gyrus as inclusion regions. The impact of the lesion on the cerebello-thalamic projection was initially characterized as the percentage of tracts that went through the consensus mask. In addition, several regions were defined along the projection, using orthogonal planes defined over a normalized map (Fig. 2). These regions were then projected to the subjects’ native space. Diffusion tensor images (DTI) were estimated using a re-weighted linear least squares estimator. From the DTI we generated fractional anisotropy (FA), mean diffusivity (MD), axial diffusivity (AD) and radial diffusivity (RD) maps. Average values were obtained region-wise for these four metrics and statistical comparisons were assessed using non-parametric Wilcoxon signed-rank tests.Results
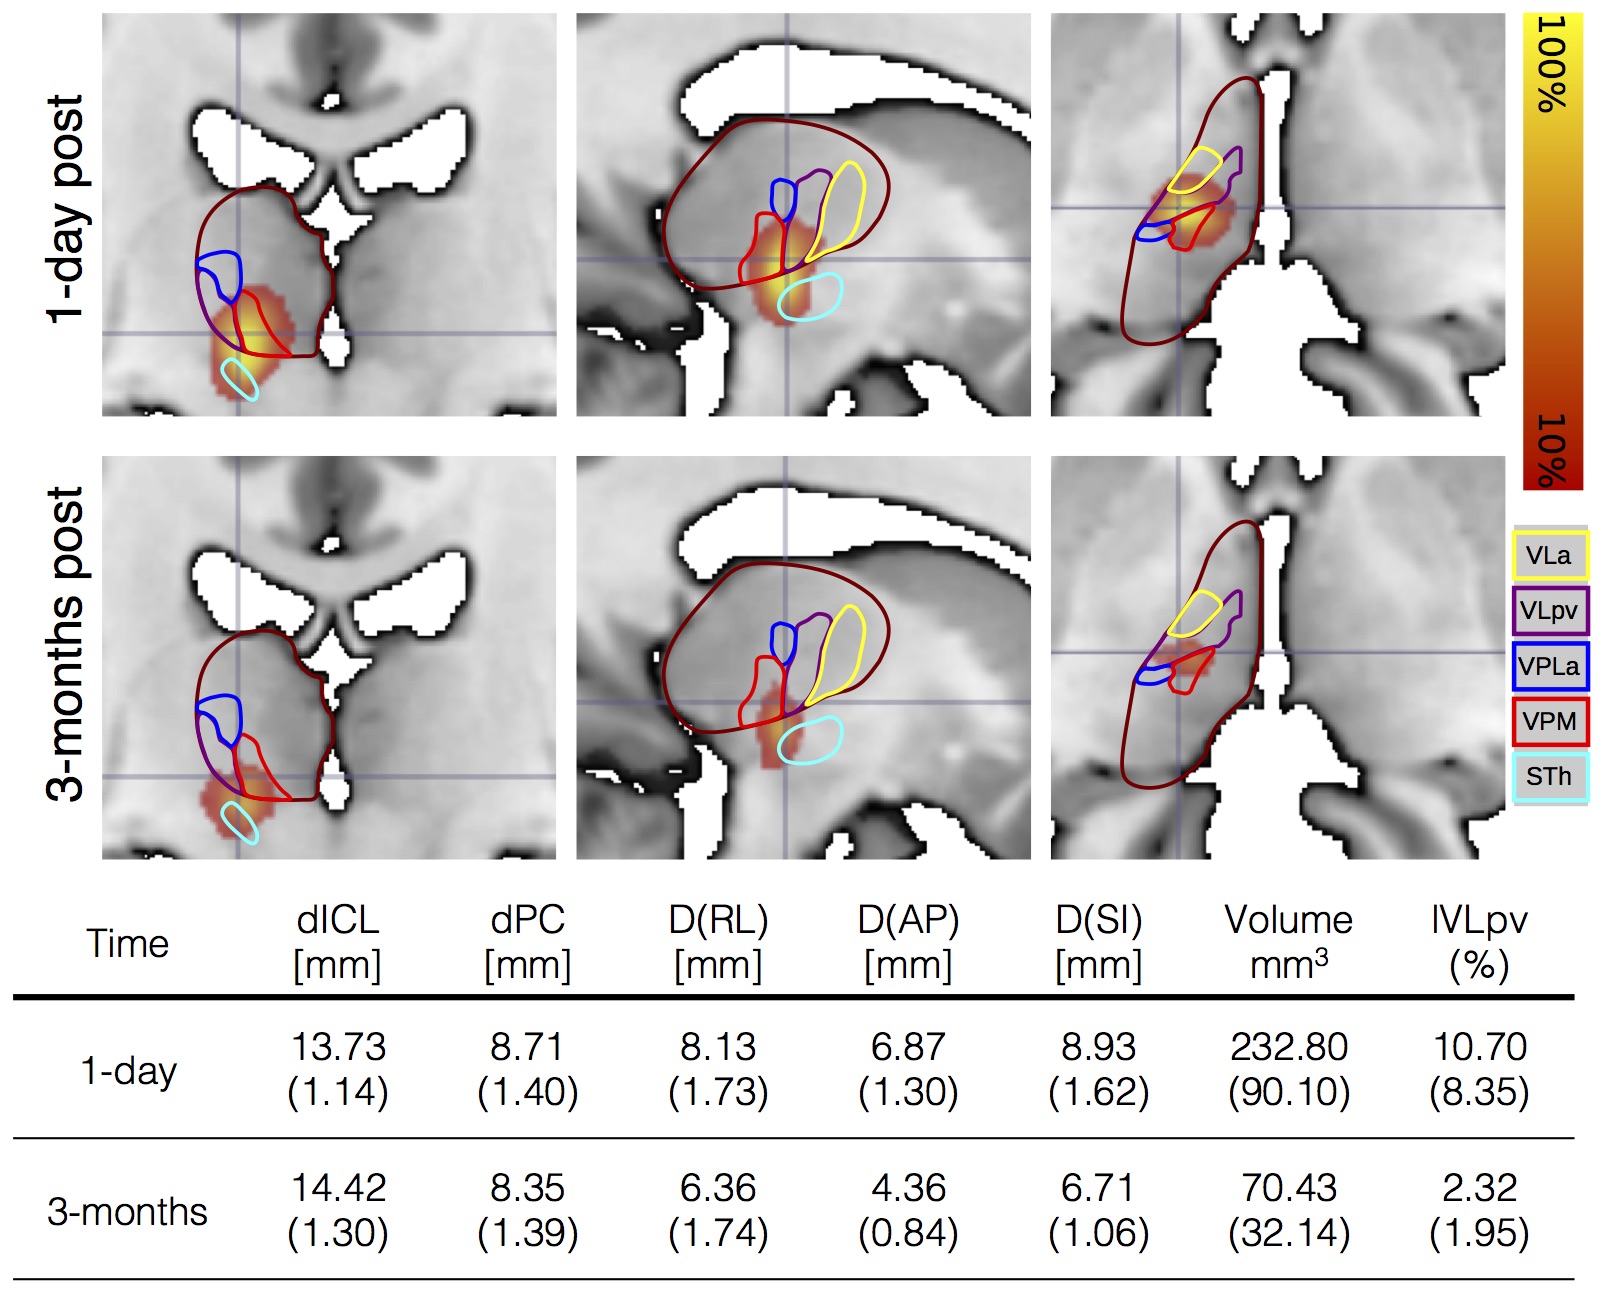
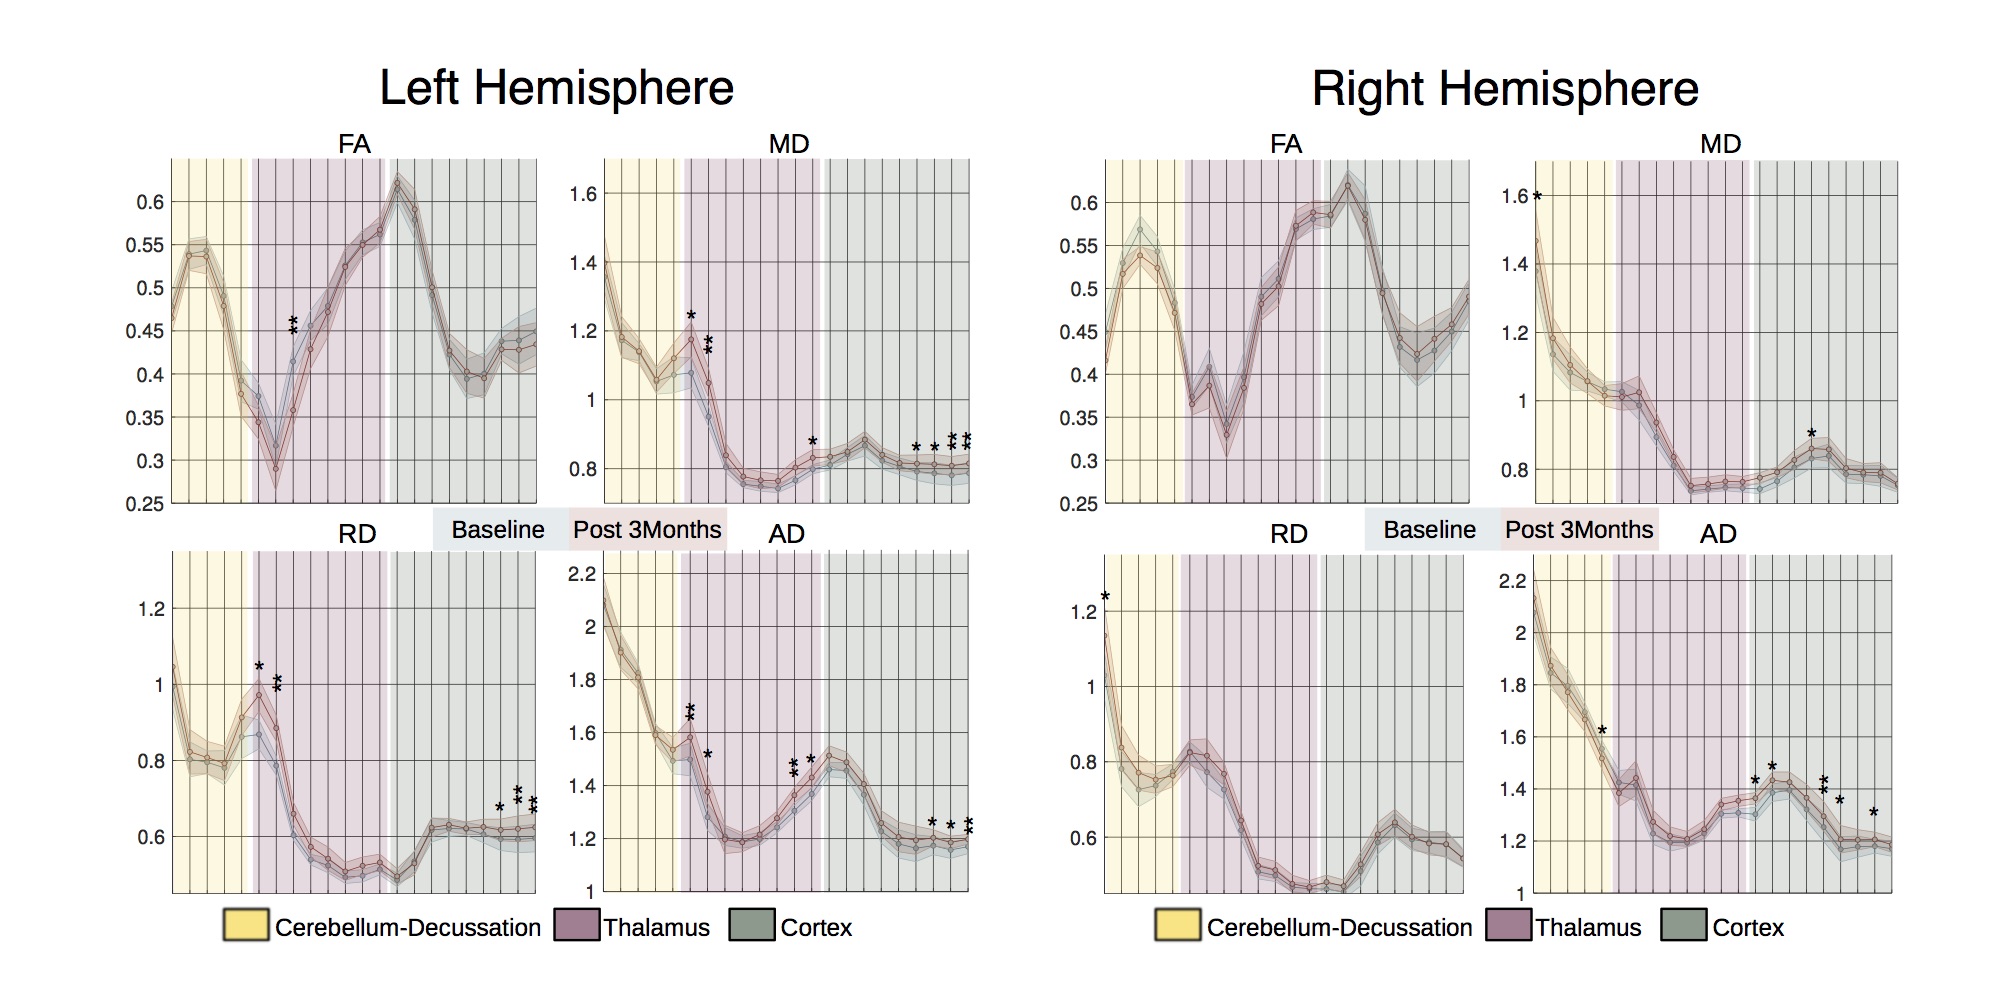
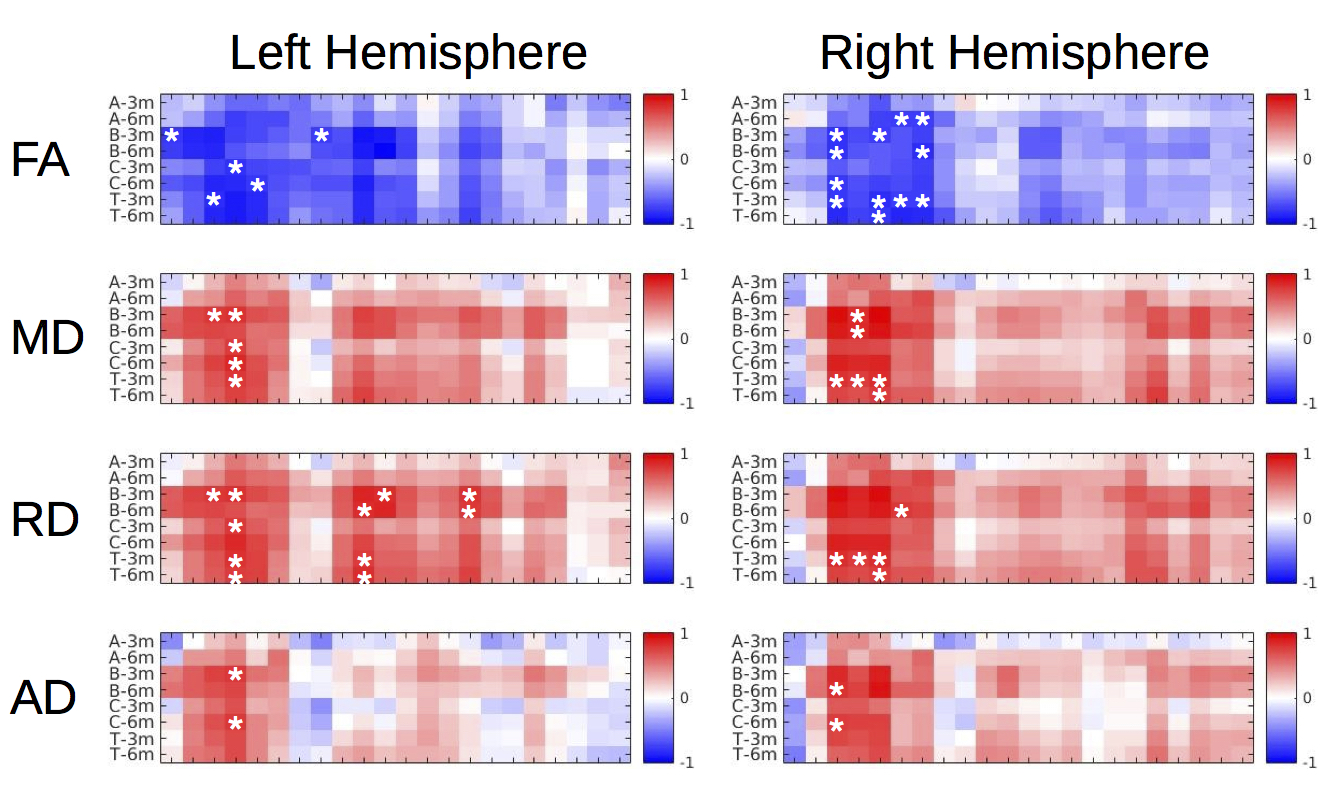
Lesion’s segmentations were concordant across raters with an average dice coefficient of 0.90 (0.03) 1-day post-treatment, and 0.87 (0.10) 3-months post-treatment. In order to create consensus segmentation, raters’ masks were multiplied. Figure 1 shows the topography of the lesion across subjects and the probabilistic lesion maps. We did not find any significant correlations between clinical improvement and the topography of the lesion, in terms location, size or occupation of the ventro-lateral posterior ventral region from the Morel atlas2. This percentage of tracts going through the lesion area didn’t show any significant correlations with the clinical improvement, not being able to replicate recent results3. DTI analysis revealed a significant decrease in FA, and an increase in MD, RD and AD in several sections of the cerebello-thalamic projection (Fig. 3). We correlated the variation in these parameters along the projection with the clinical improvement, and found significant correlations (p-value < 0.01) with the total CRST (T), and the three subsections (A, B and C) evaluated 3-months and 6-months post-treatment (Fig. 4). The thalamic area showed the largest difference between baseline and 3-months post-treatment, but we also found differences in the cerebellar and cortical portions of the pathway. Significant differences were not restricted to the treated hemisphere, but also appeared in the untreated one.Discussion
Using DWI we were able to map the impact of the HIFU thalamotomy over the cerebello-thalamic projection. We found that several DTI metrics were sensitive to local and distant alterations after HIFU thalamotomy. Our results serve to replicate previous findings, which however were restricted to FA metric4. We extend the characterization of the lesion impact to other DTI parameters, and also gain analytical specificity by informing our quantitative analysis with the specific anatomy of the cerebello-thalamic projection. Interestingly, we found that changes were not restricted to the treated hemisphere, showing also differences in the right cerebello-thalamic projection. The thalamic lesion could have developed an interhemispheric cortical in-balance, which might affect to the functionality of the right hemispheric projection5. DTI changes after HIFU thalamotomy were highly related to the clinical improvement, whereas the topographical description of the lesion area did not show any correlation with the clinical scores. These results suggest the potential of tractography based DTI measures as biomarkers of the treatment success.Acknowledgements
No acknowledgement found.References
1. Tournier JD, Calamante F, Connelly A. Robust determination of the fibre orientation distribution in diffusion MRI: non-negativity constrained super-resolved spherical deconvolution. NeuroImage. 2007; 35(4):1459-72.
2. Niemann K, Mennicken VR, Jeanmonod D et al. The Morel stereotactic atlas of the human thalamus: atlas-to-MR registration of internally consistent canonical model. Neuroimage. 2000; 12(6), 601-16.
3. Tian Q, Wintermark M, Butts-Pauly K, et al. Diffusion MRI Tractography for Improved MRI-guided Focused Ultrasound Thalamotomy Targeting for Essential Tremor, Proc. Intl. Soc. Mag. Reson. Med. 24 (2016).
4. Wintermark M, Huss DS, Shah BB et al. Thalamic Connectivity in Patients with Essential Tremor Treated with MR Imaging–guided Focused Ultrasound: In Vivo Fiber Tracking by Using Diffusion-Tensor MR Imaging. Radiology. 2014; 272(1), 202-209.
5. Duffau H. Does post-lesional subcortical plasticity exist in the human brain?. Neuroscience research. 2009; 65(2):131-5.
Figures