1815
Towards interpretation of 3-tissue constrained spherical deconvolution results in pathology1The Florey Institute of Neuroscience and Mental Health, Melbourne, Australia, 2The Florey Department of Neuroscience, University of Melbourne, Melbourne, Australia
Synopsis
Multi-shell multi-tissue constrained spherical deconvolution (MSMT-CSD) and single-shell 3-tissue CSD (SS3T-CSD) resolve WM fibre orientation distributions and GM and CSF tissue compartments by deconvolving WM, GM and CSF response functions from the diffusion MRI data. We aim for more general interpretation of the “WM/GM/CSF” compartments obtained from 3-tissue CSD methods, specifically in the presence of pathology. We demonstrate their potential in this context and provide a simple framework that aids interpretation, with healthy tissues as a frame of reference. “CSF-like” partial volume is related to interstitial fluid, while “GM-like” partial volume may indicate gliosis, given an appropriate context.
Purpose
Since the fibre orientation distribution (FOD) from constrained spherical deconvolution (CSD)[1] assumes only a single-fibre white matter (SF-WM) response function to model the diffusion-weighted imaging (DWI) signal, it's inaccurate in voxels containing grey matter (GM) or cerebrospinal fluid (CSF). Multi-shell multi-tissue CSD (MSMT-CSD)[2] overcomes this by adding GM/CSF compartments, but requires multi-shell data. Single-shell 3-tissue CSD (SS3T-CSD)[3,4] yields a similar result using just single-shell (+b=0) data.
We aim for more general interpretation of the "WM/GM/CSF" compartments from 3-tissue CSD methods, specifically in the context of pathology. Illustrated by results in an elderly Alzheimer's disease (AD) patient with extensive white matter hyperintensities (WMHs), we provide a framework that aids such interpretation.
Methods
DWI-data were acquired on a Siemens 3T scanner, with voxel size 2.3×2.3×2.3mm3, 60 directions at b=3000s/mm2 and 8 b=0 images; as well as a T1-weighted image (T1w) with voxel size 1.2×1×1mm3 and a fluid-attenuated inversion recovery image (FLAIR) with voxel size 0.9×1×1mm3. Data were corrected for motion/distortions[5] and bias-fields[6].
Single-shell (+b=0) response functions are estimated directly from the DWI-data[4], yielding an anisotropic SF-WM response function (for b≠0) and isotropic GM/CSF response functions. The DWI-data are (spatially) up-sampled by a factor 2, before performing SS3T-CSD[3,4]. We also computed the average DWI, the apparent diffusion coefficient (ADC) and fractional anisotropy (FA) from diffusion tensor imaging, and the total (voxelwise) apparent fibre density (AFD)[7] from single-tissue CSD[1].
Results
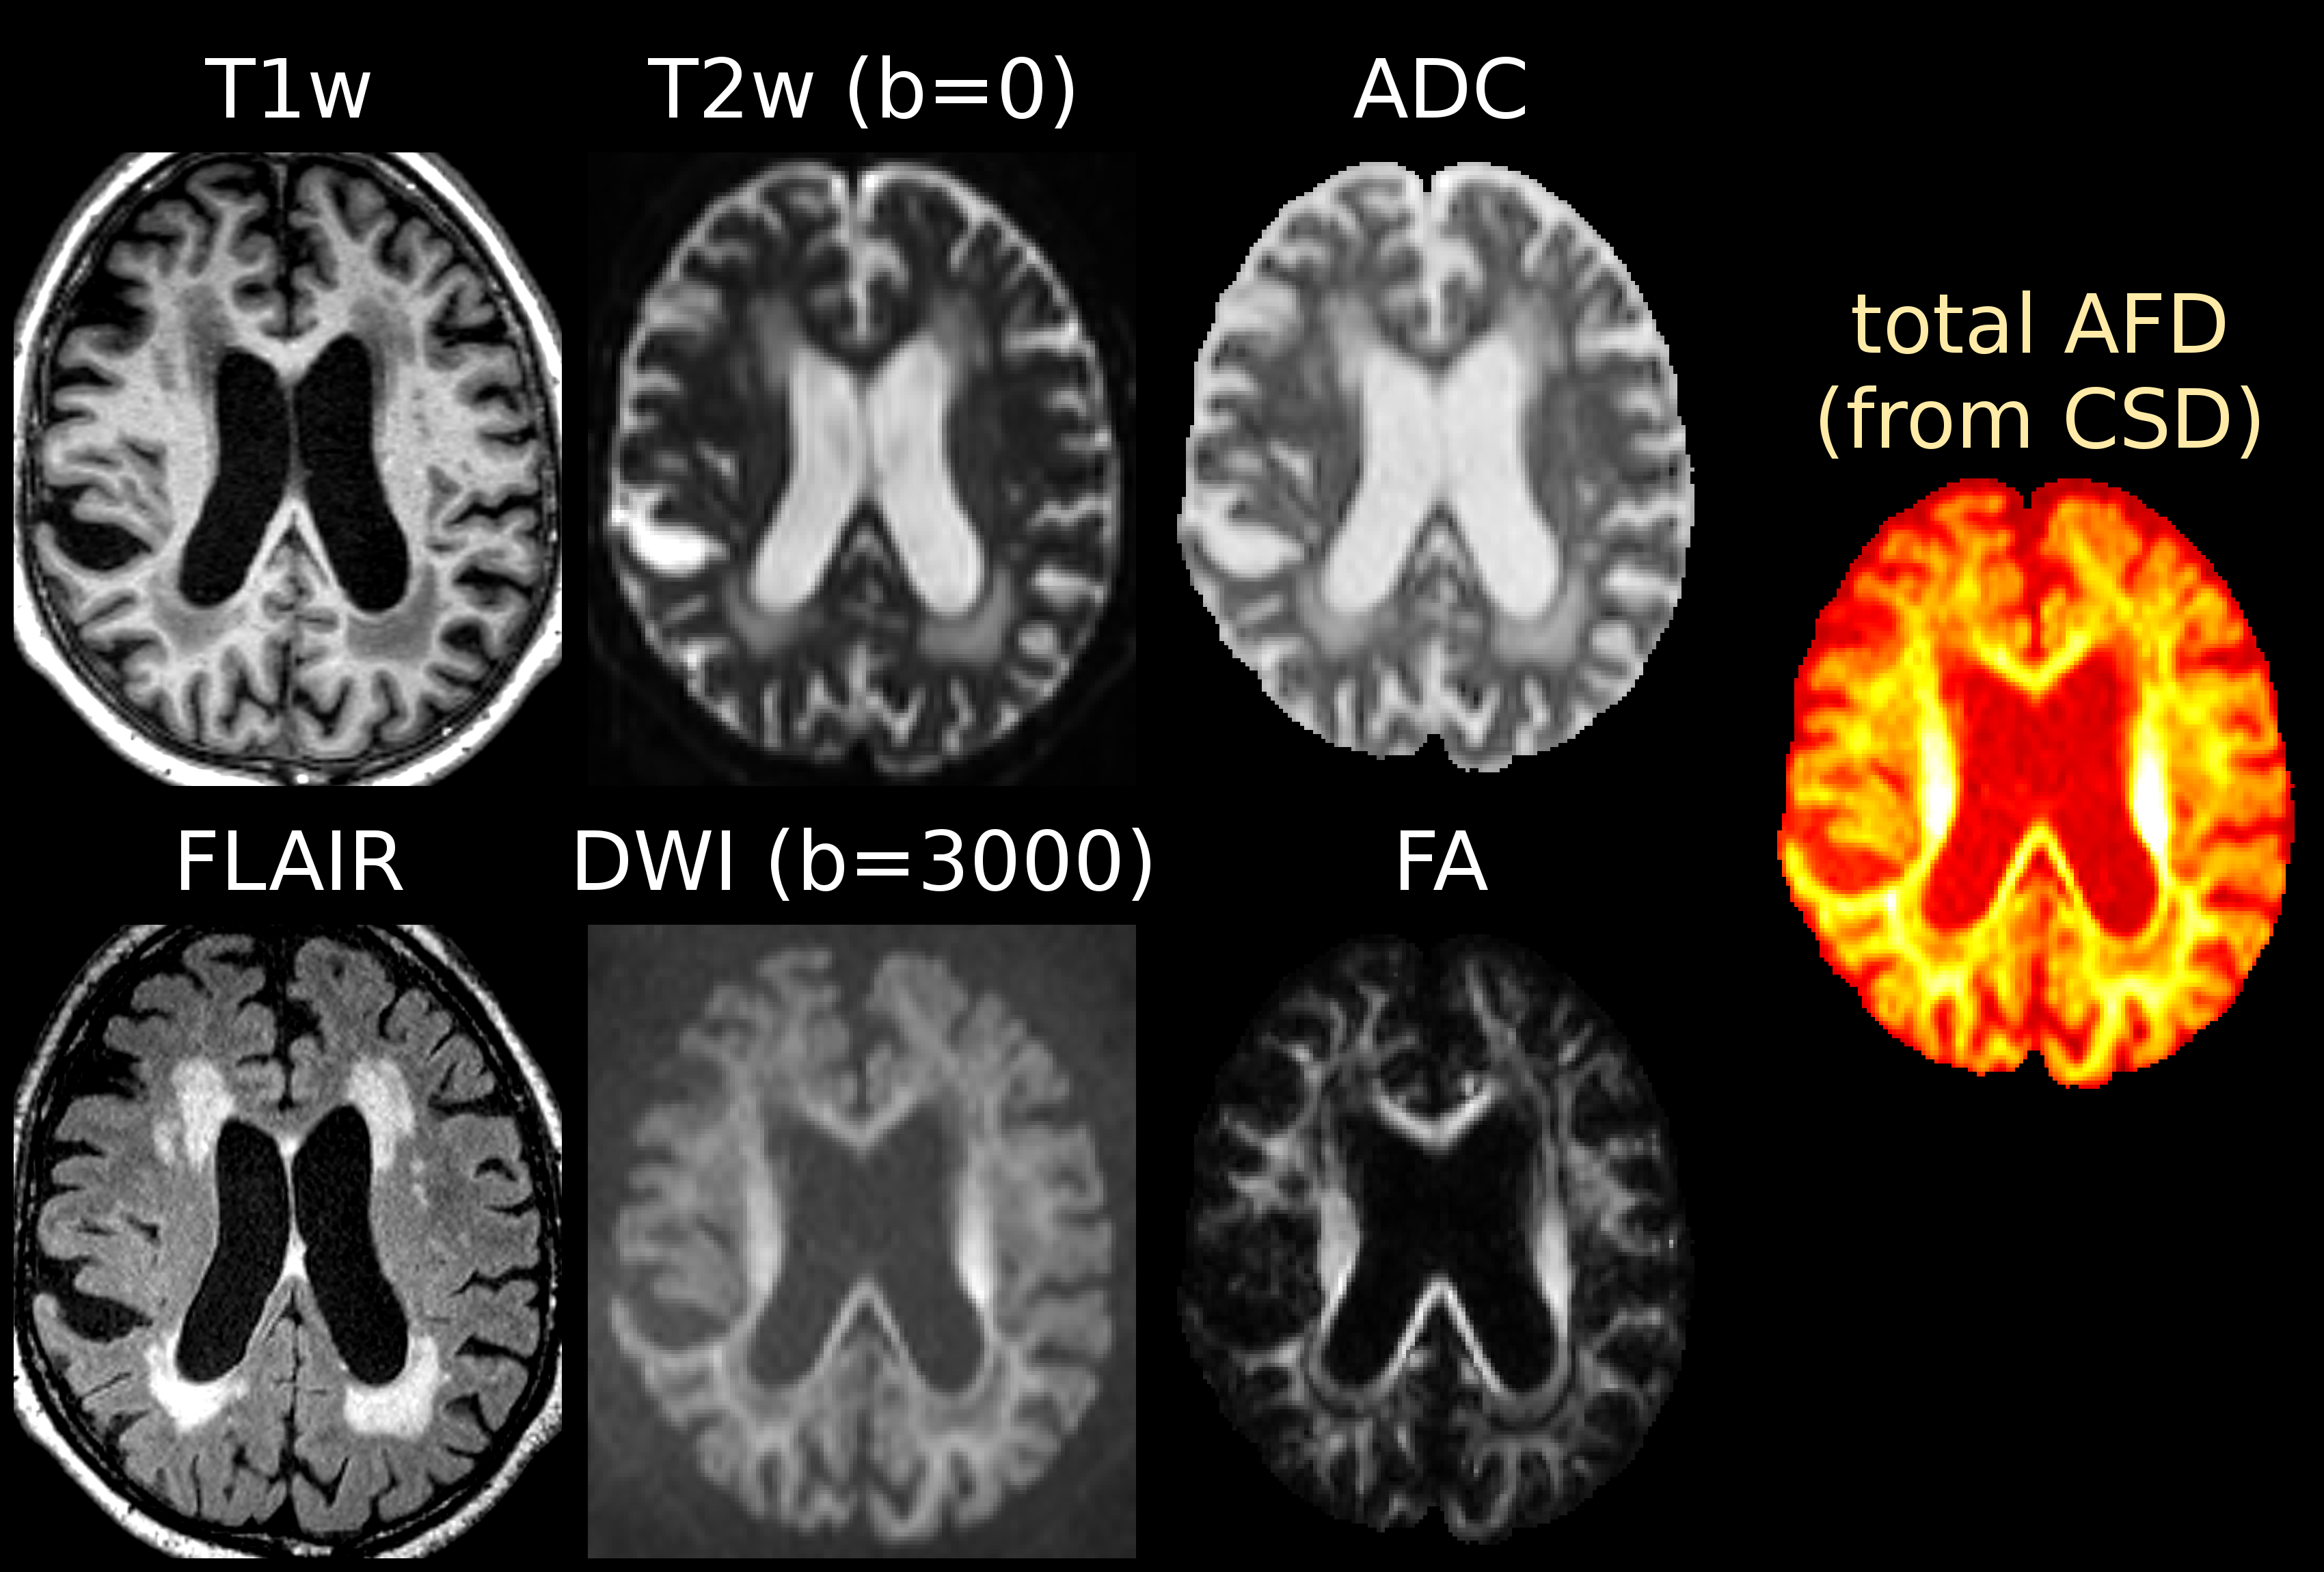
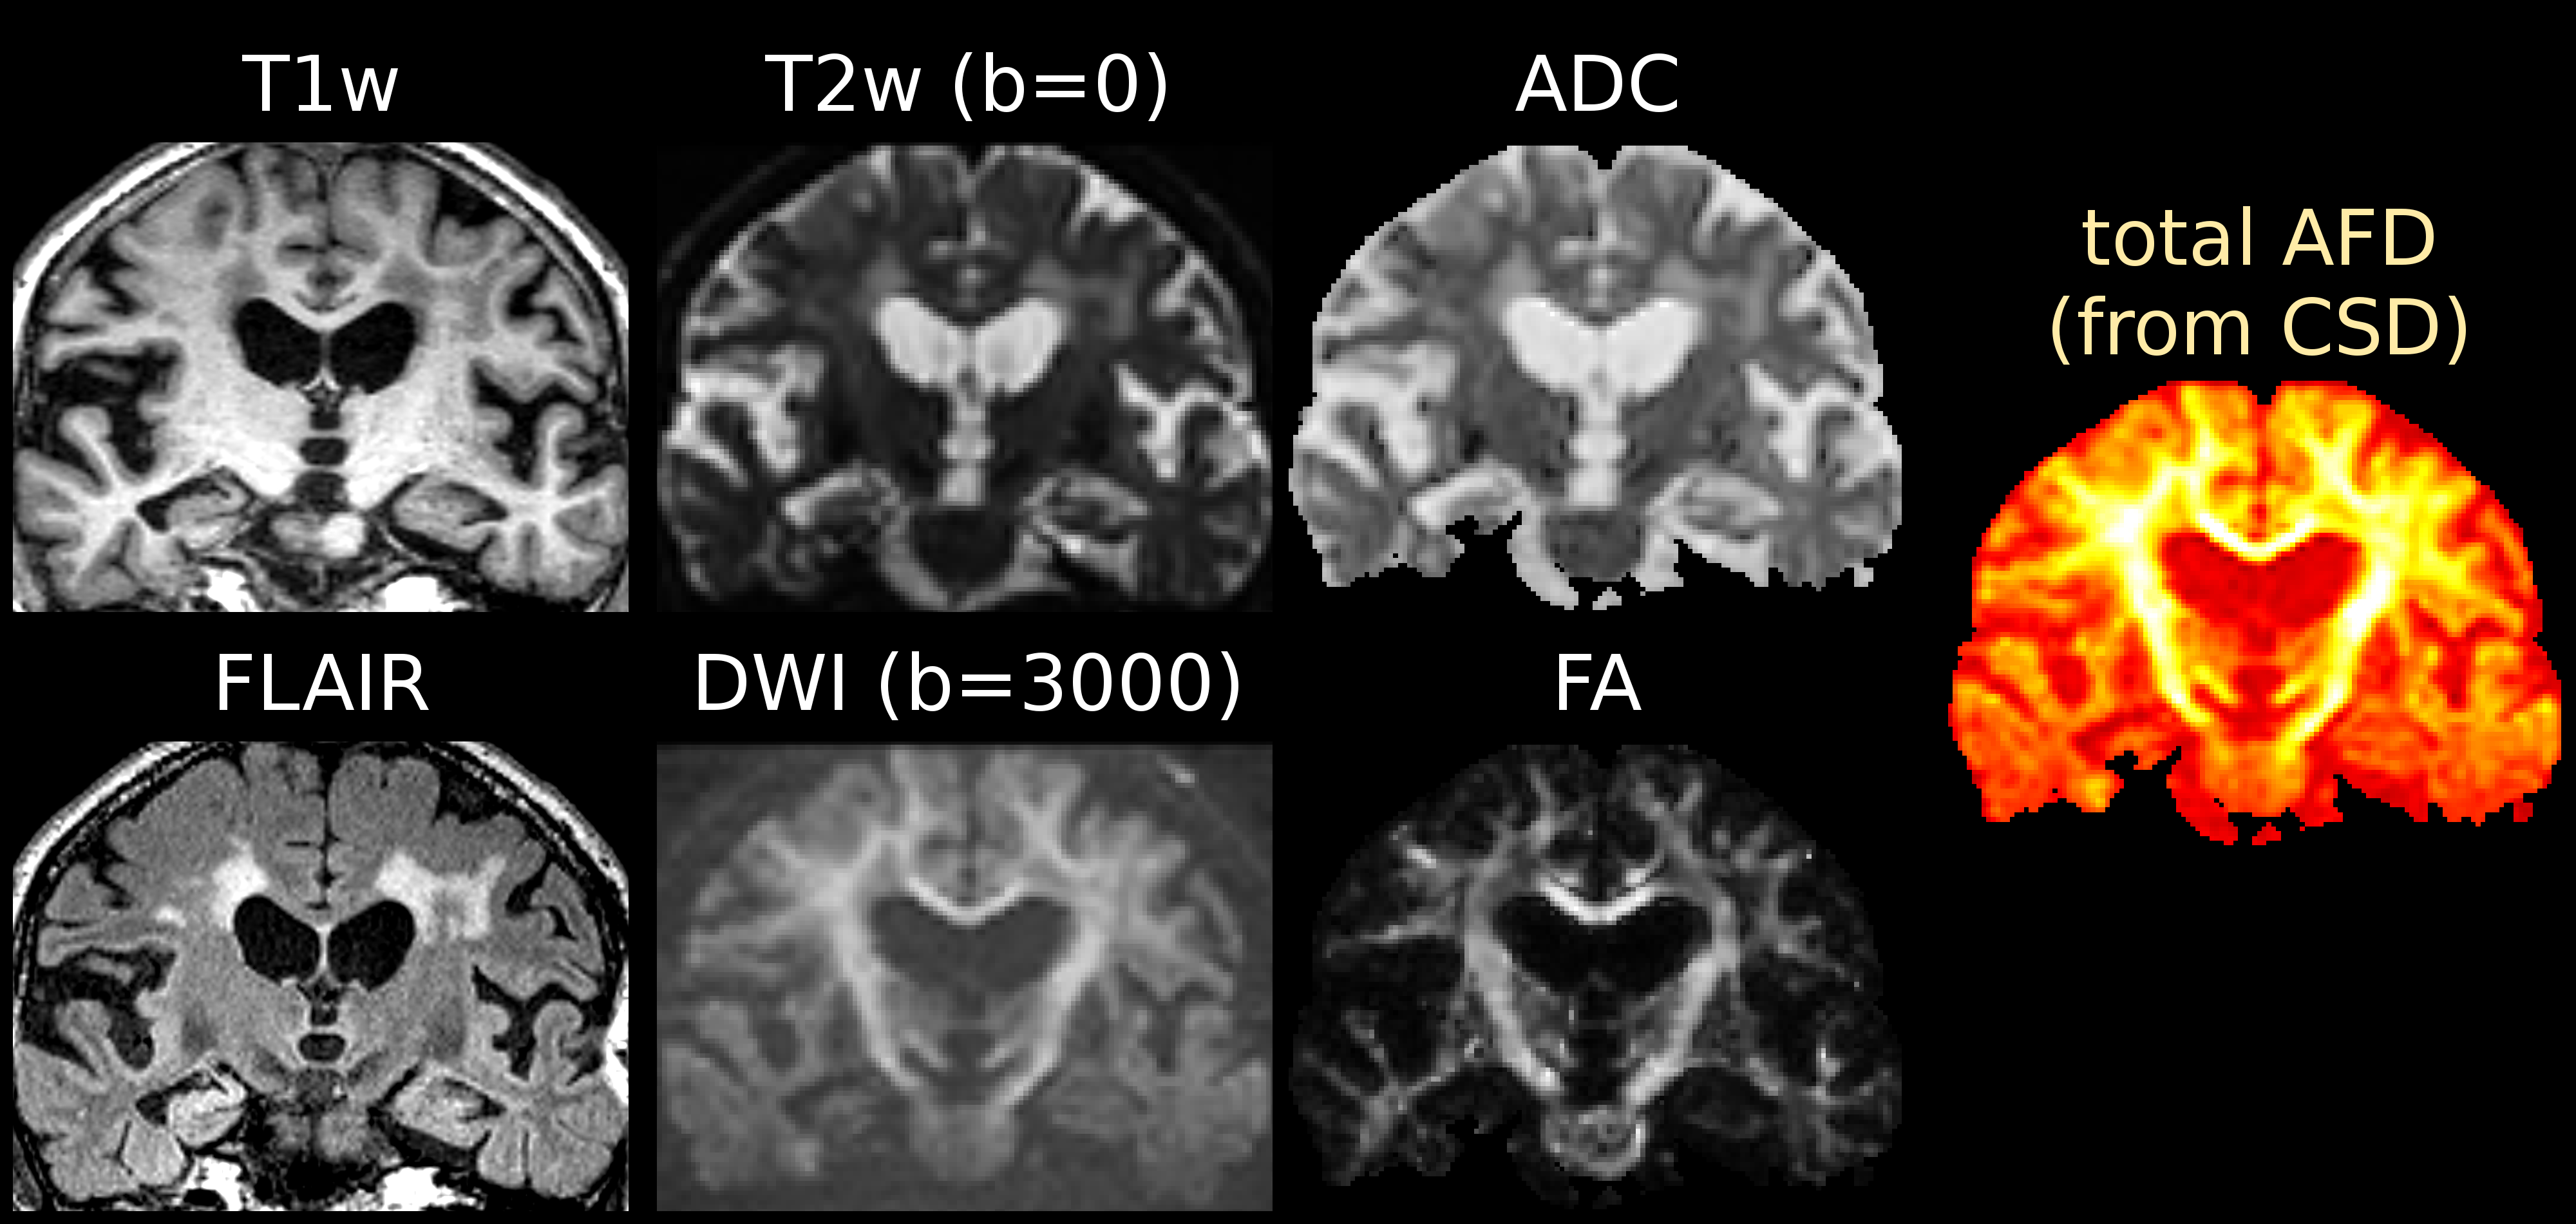
Fig.1 and Fig.3 show several periventricular WMHs (PVWMHs) and deep WMHs (DWMHs). All are hypointense on T1w, hyperintense on FLAIR/T2w/ADC. Some parts are slightly hypointense on DWI and AFD (from single-tissue CSD), whereas others much less so (typically more distal parts of PVWMHs, and most DWMHs); but the latter are clearly hypointense on FA (however, FA is non-specific!).
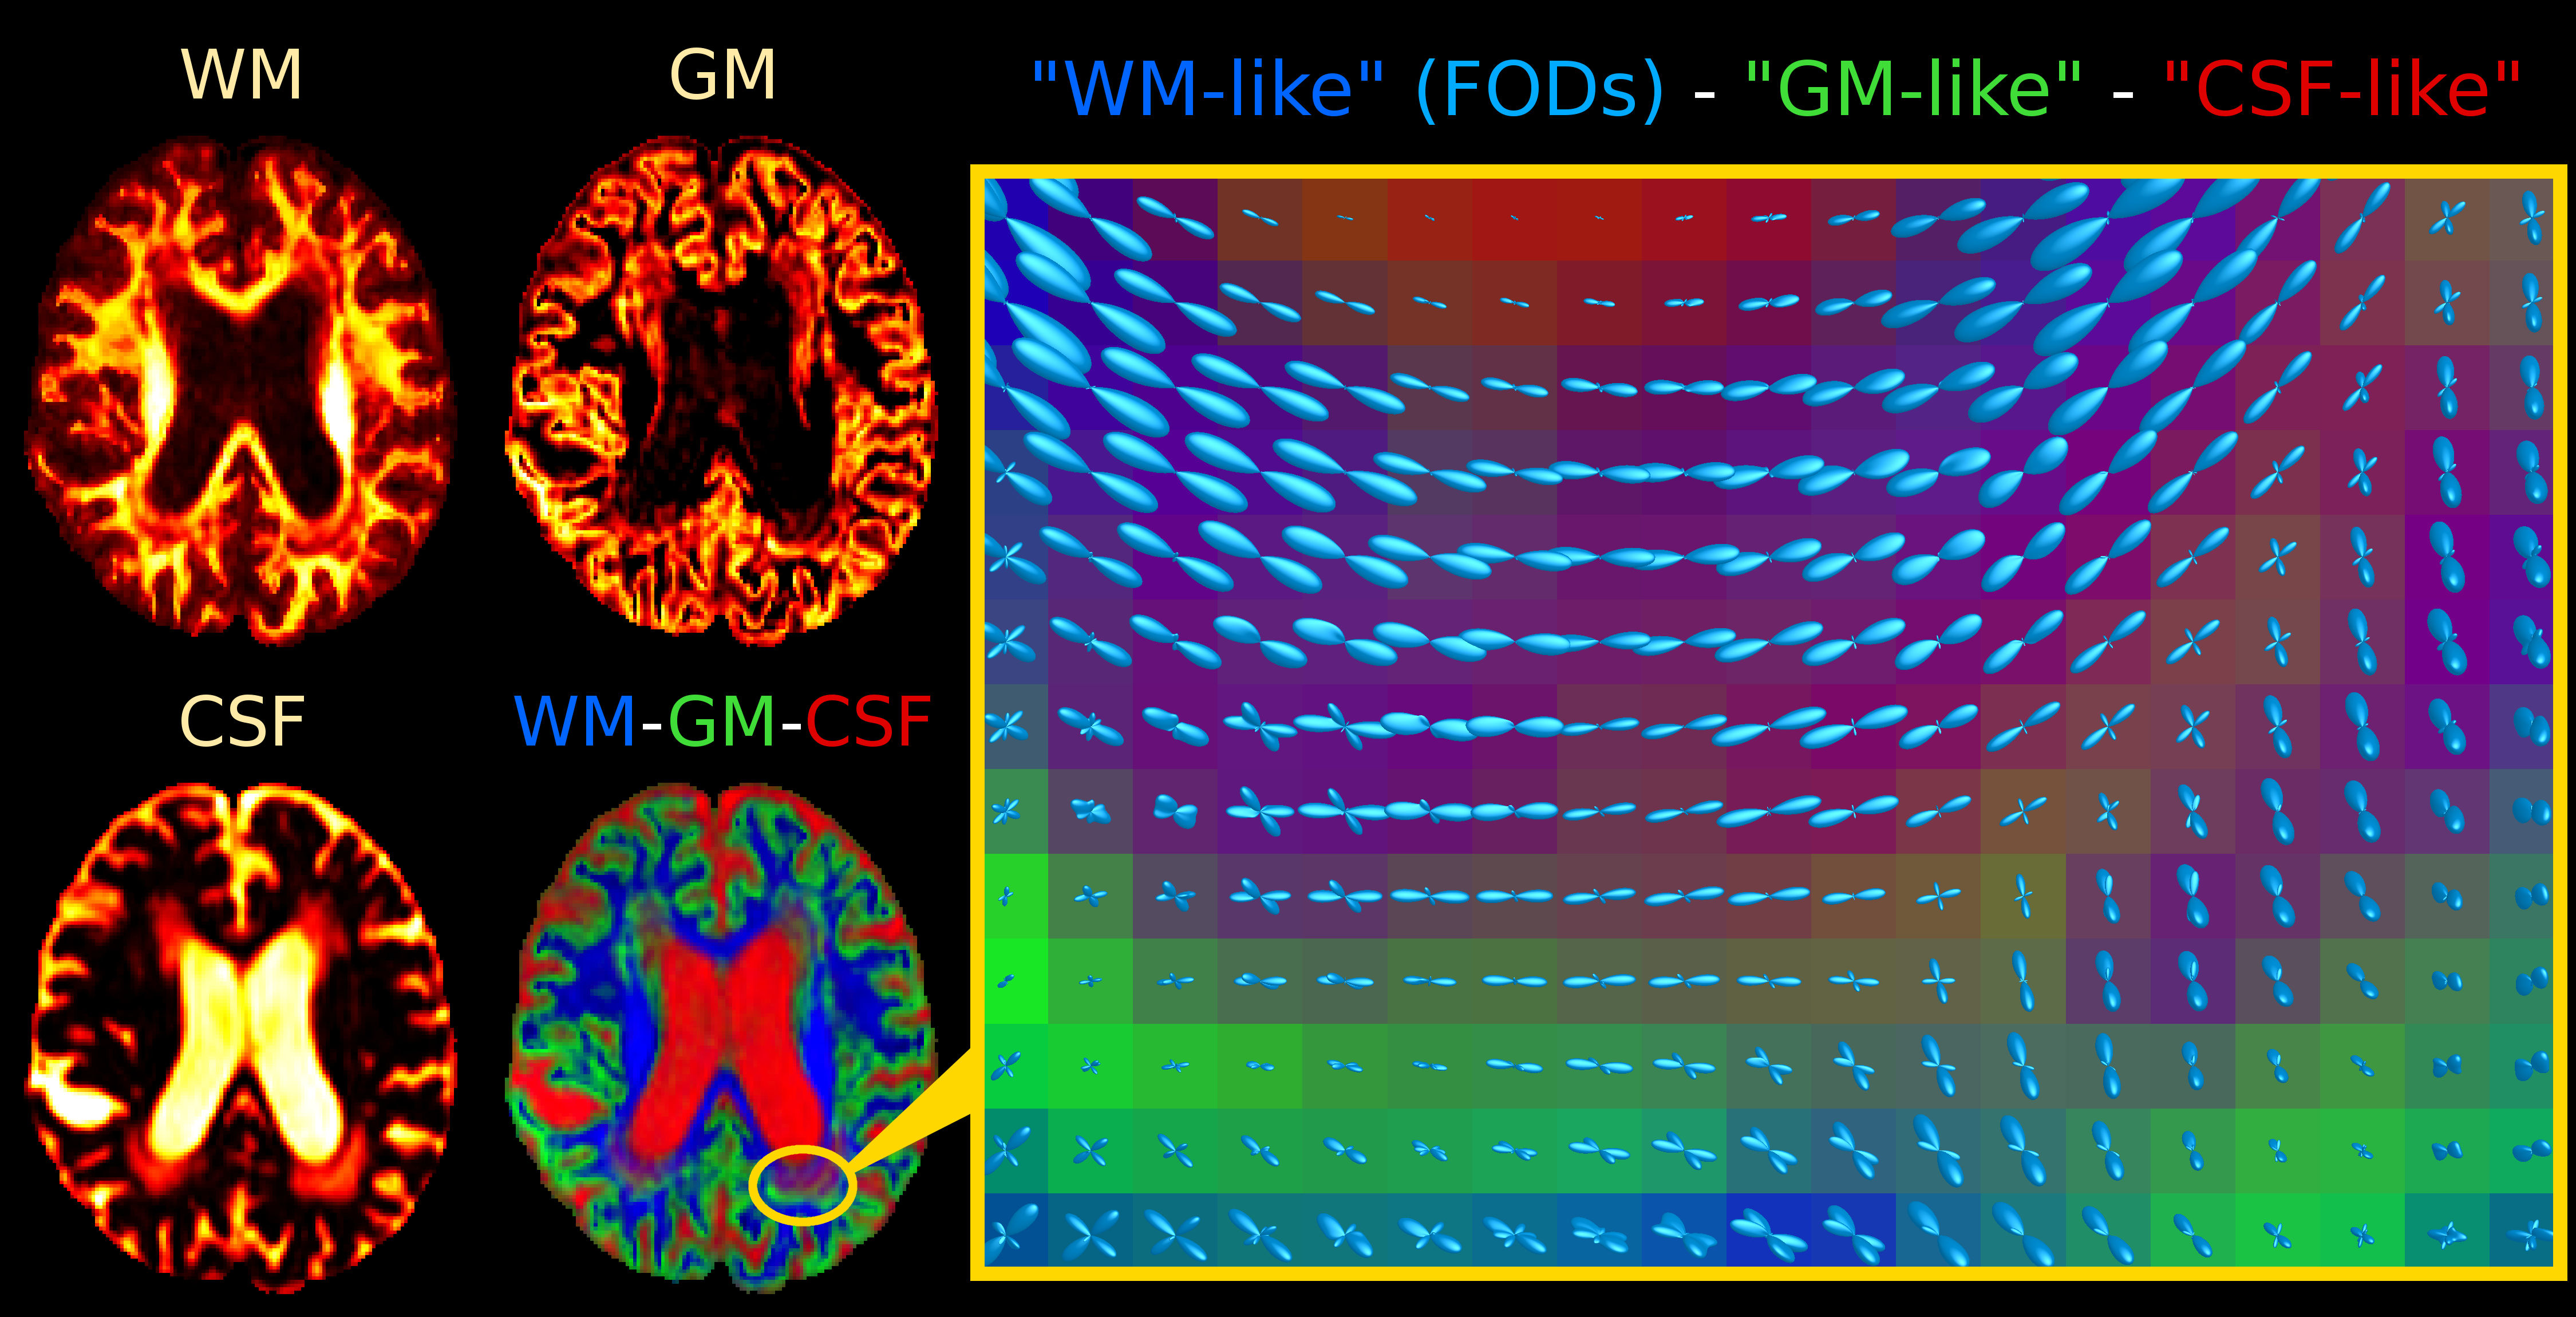
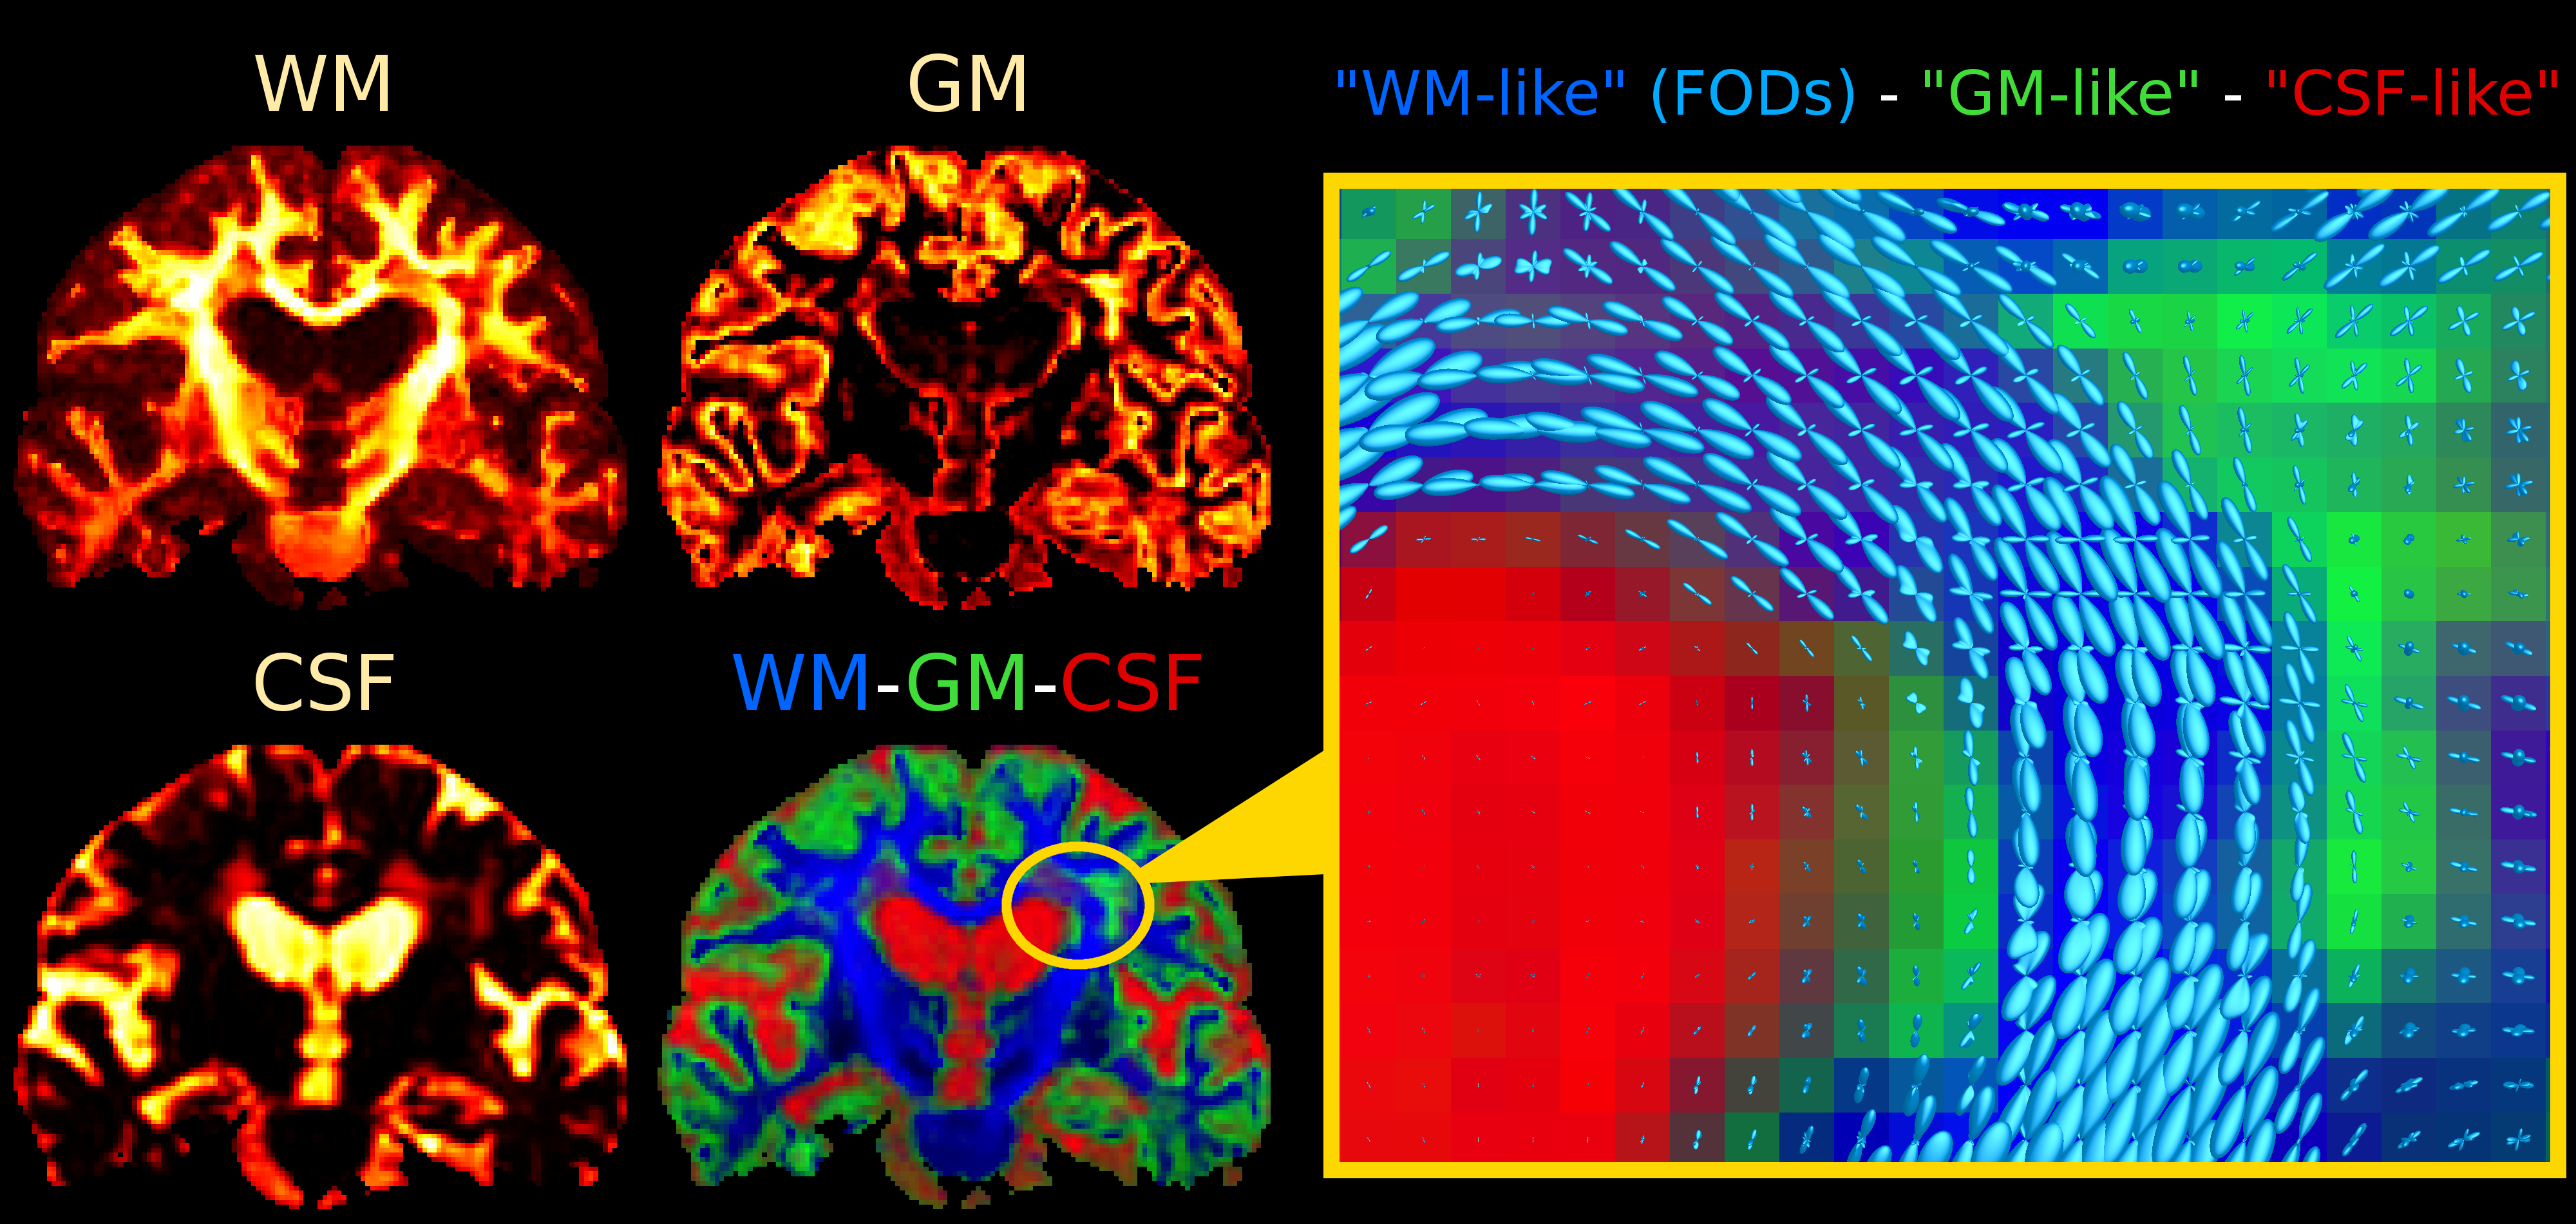
Fig.2 and Fig.4 present SS3T-CSD results. The WM compartment shows crisply delineated hypointensities in all WMHs. The CSF compartment shows clear hyperintensities in the regions that were identifiable (hypointensities) on DWI and single-tissue AFD. The GM compartment, on the other hand, shows more hyperintensities in other (parts of) WMHs that presented clear hypointensities on FA. It's not always clear-cut though: there are areas of transitioning and partial voluming of all WM/GM/CSF compartments. The WM-FODs still show clear structure in presence of these "GM-like" and "CSF-like" contributions, but are smaller, especially in presence of "GM-like" tissue.
Discussion
Histopathology and MRI-based research has reported several observations in WMHs[8-13], often appearing in—but certainly not limited to—AD: axonal dystrophy/atrophy (potentially due to ischemia resulting from small vessel disease), myelin deficiency (myelin stain pallor) or loss, reactive gliosis (e.g., astrocytosis), and even patchy loss of the ependymal lining causing CSF leakage into the parenchyma, among others. Classification of WMHs is often based on size/shape and distance/continuity with respect to the ventricles: difficult to quantify and lacking physiological/pathological basis[13]; but clinical importance shouldn't be underestimated[14].
Microstructurally, we distinguish 3 main potential effects:
1. Axonal rarefaction
2. Increase of interstitial fluid
3. Proliferation and/or hypertrophy of glial cells
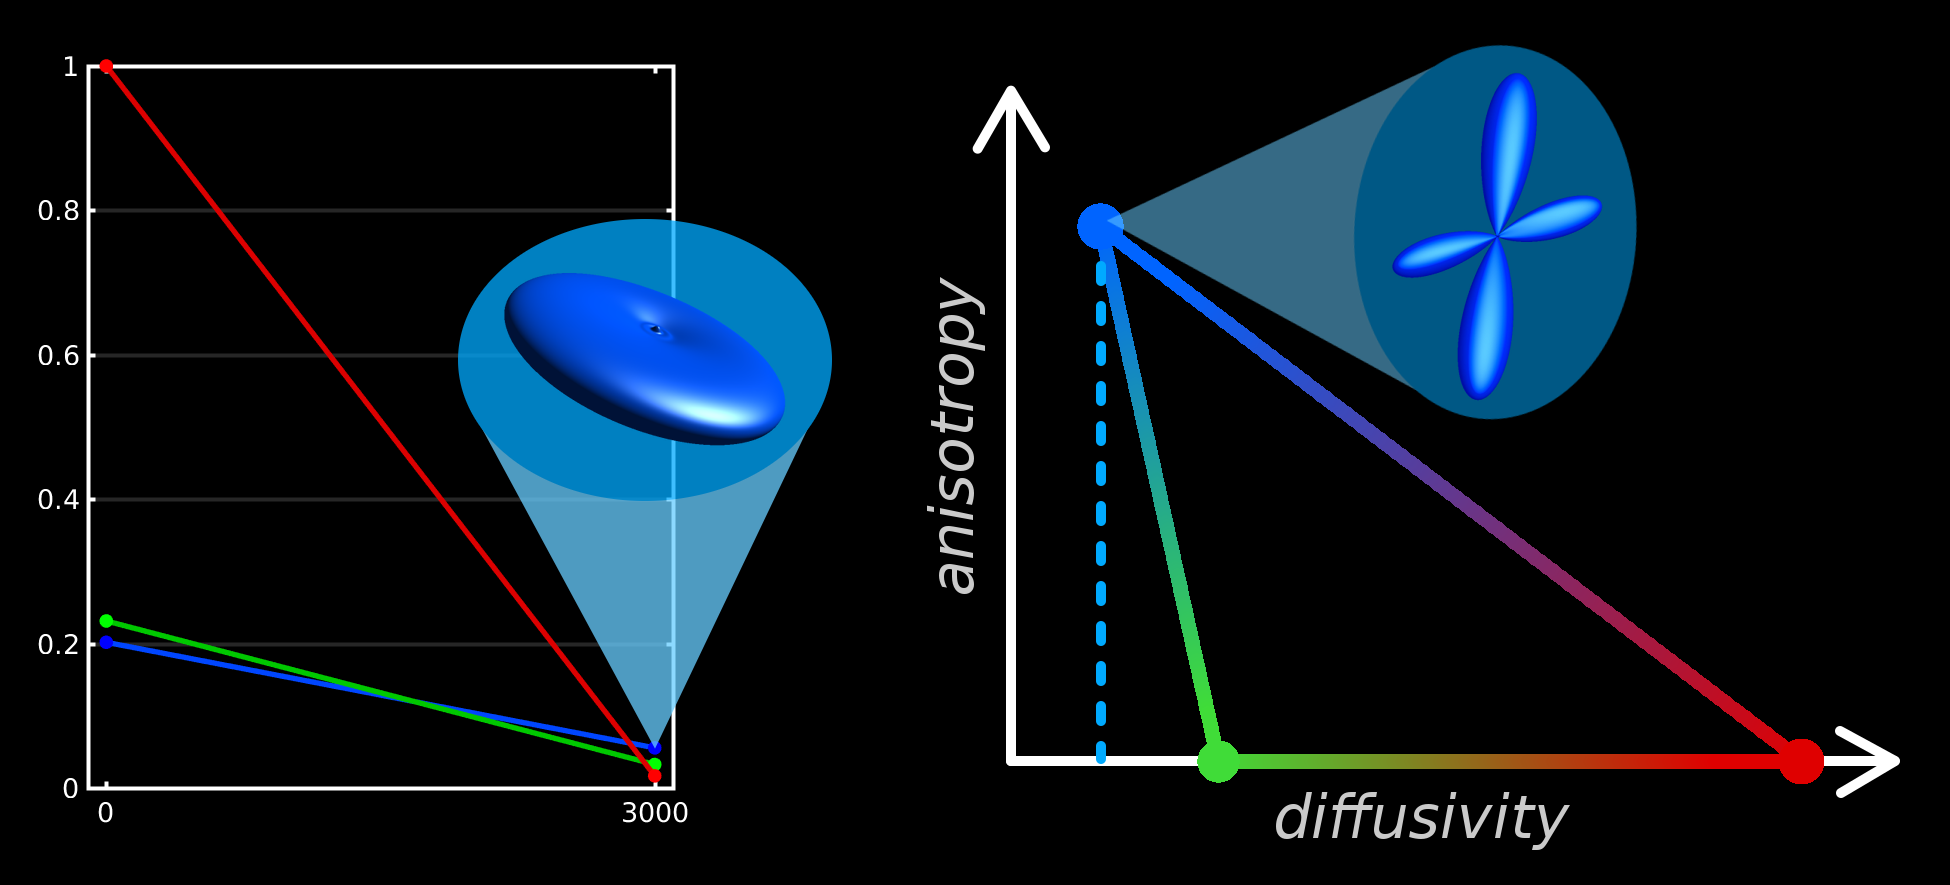
To interpret the 3-tissue compartment maps, we have to take into account that their "units" are essentially the 3 response functions (Fig.5).
The SF-WM response is typically estimated as the (reoriented) DWI signal from voxels with the sharpest SF-WM contrast, i.e., containing the most dense/coherent axons.
The GM response is estimated from GM voxels, containing a large number of neuronal cell bodies. Relative to the SF-WM response, it is constrained to isotropy, and is typically observed to have slightly higher diffusivity.
The CSF response function is simple to interpret: estimated from CSF voxels, it represents free-water. It's isotropic and has the highest diffusivity. This explains the "CSF-like" compartment in the WMHs: an increase of interstitial fluid.
The intensity-drop of the WM compartment explains axonal rarefaction throughout the WMHs. The "GM-like" compartment is the hardest to interpret, but given that significant gliosis is expected, we hypothesise that an increase in "GM-like" tissue may indicate gliosis. More generally, "GM-like" tissue may indicate, relative to the SF-WM response model, "excess" extra-axonal (cellular) content; e.g., the neuronal cell bodies that it was designed/calibrated to represent.
3-tissue CSD methods may provide complementary information to typical mathematical models of microstructure (e.g.,[15-17]). The unique value of 3-tissue CSD methods is the calibration of the response functions ("units") directly from the DWI-data itself, providing a frame of reference based on healthy tissues (Fig.5).
Conclusion
We demonstrated the potential of 3-tissue CSD methods to improve our understanding of pathology, and provided a simple framework that aids interpretation. Increased "CSF-like" partial volume relates to interstitial fluid, while increased "GM-like" partial volume may indicate gliosis, given an appropriate context.Acknowledgements
We wish to acknowledge J-Donald Tournier and Markus Nilsson for useful discussions. Some of the aspects of the "diffusivity-anisotropy" schematic sketch (Fig.5) to visualise/conceptualise the 3-tissue CSD space draw inspiration from a presentation by Markus Nilsson at the ISMRM Workshop on Breaking the Barriers of Diffusion MRI (13 Sept 2016, Lisbon, Portugal).
References
[1] Tournier JD, Calamante F, Connelly A. Robust determination of the fibre orientation distribution in diffusion MRI: Non-negativity constrained super-resolved spherical deconvolution. NeuroImage 2007;35(4):1459-1472.
[2] Jeurissen B, Tournier JD, Dhollander T, Connelly A, Sijbers J. Multi-tissue constrained spherical deconvolution for improved analysis of multi-shell diffusion MRI data. NeuroImage 2014;103:411-426.
[3] Dhollander T, Connelly A. A novel iterative approach to reap the benefits of multi-tissue CSD from just single-shell (+b=0) diffusion MRI data. Proc ISMRM 2016;24:3010.
[4] Dhollander T, Raffelt D, Connelly A. Unsupervised 3-tissue response function estimation from single-shell or multi-shell diffusion MR data without a co-registered T1 image. Proc ISMRM Workshop on Breaking the Barriers of Diffusion MRI 2016:5.
[5] Andersson JLR, Xu J, Yacoub E, Auerbach E, Moeller S, Ugurbil K. A comprehensive Gaussian Process framework for correcting distortions and movements in diffusion images. Proc ISMRM 2012;20:2426.
[6] Tustison NJ, Avants BB, Cook PA, Zheng Y, Egan A, Yushkevich PA, Gee JC. N4ITK: Improved N3 bias correction. IEEE TMI 2010;29(6):1310-1320.
[7] Raffelt D, Tournier JD, Rose S, Ridgway GR, Henderson R, Crozier S, Salvado O, Connelly A. Apparent Fibre Density: A novel measure for the analysis of diffusion-weighted magnetic resonance images. NeuroImage 2012;59(4):3976–3994.
[8] Sze G, De Armond SJ, Brant-Zawadzki M, Davis RL, Norman D, Newton TH. Foci of MRI signal (pseudo lesions) anterior to the frontal horns: histologic correlations of a normal finding. Am J Roentgenol 1986;147(2):331-337.
[9] Fazekas F, Kleinert R, Offenbacher H, Schmidt R, Kleinert G, Payer F, Radner H, Lechner H. Pathologic correlates of incidental MRI white matter signal hyperintensities. Neurology 1993;43(9):1983-1689.
[10] Haller S, Kövari E, Herrmann FR, Cuvinciuc V, Tomm AM, Zulian GB, Lovblad KO, Giannakopoulos P, Bouras C. Do brain T2/FLAIR white matter hyperintensities correspond to myelin loss in normal aging? A radiologic-neuropathologic correlation study. Acta Neuropathol Commun 2013;1:14.
[11] Shim YS, Yang DW, Roe CM, Coats MA, Benzinger TL, Xiong C, Galvin JE, Cairns NJ, Morris JC. Pathological correlates of white matter hyperintensities on magnetic resonance imaging. Dement Geriatr Cogn Disord 2015;39:92-104.
[12] Maniega SM, Hernández MCV, Clayden JD, Royle NA, Murray C, Morris Z, Aribisala BS, Gow AJ, Starr JM, Bastin ME, Deary IJ, Wardlaw JM. White matter hyperintensities and normal-appearing white matter integrity in the aging brain. Neurobiol Aging 2015;36(2):909-918.
[13] Kim KW, MacFall JR, Payne ME. Classification of white matter lesions on magnetic resonance imaging in elderly persons. Biol Psychiatry 2008;64(4):273-280.
[14] Debette S, Markus HS. The clinical importance of white matter hyperintensities on brain magnetic resonance imaging: systematic review and meta-analysis. BMJ 2010;341:c3666.
[15] Zhang H, Schneider T, Wheeler-Kingshott CA, Alexander DC. NODDI: practical in vivo neurite orientation dispersion and density imaging of the human brain. NeuroImage 2012;61(4):1000-1016.
[16] Reisert M, Kellner E, Dhital B, Hennig J, Kiselev VG. Disentangling micro from mesostructure by diffusion MRI: A Bayesian approach. NeuroImage 2016.
[17] Novikov DS, Veraart J, Jelescu IO, Fieremans E. Mapping orientational and microstructural metrics of neuronal integrity with in vivo diffusion MRI. arXiv:1609.09144v1 (submitted on 28 Sep 2016 to arXiv.org)
Figures