1812
Characterizing diffusion weighted images using Clustering Analysis of Spherical Harmonics (CASH)1Physics, University of Florida, Gainesville, FL, United States, 2Applied Physiology and Kinesiology, University of Florida, Gainesville, FL, United States, 3Psychiatry, University of Florida, Gainesville, FL, United States, 4Biomedical Engineering, University of Florida, Gainesville, FL, United States, 5Clinical and Health Psychology, University of Florida, Gainesville, FL, United States, 6Biochemistry and Molecular Biology, University of Florida, Gainesville, FL, United States
Synopsis
Diffusion weighted imaging has become an important tool for understanding how pathology affects brain structure. However, the standard method of diffusion tensor imaging (DTI) is inadequate in complex fiber regions. Other more complex diffusion models calculate the diffusion displacement probability function (DPF) 1, but current methods to extract the information from the DPF are limited. To this end, we introduce a data-driven method combining spherical harmonic representations of the DPF with the clustering analysis of spherical harmonic (CASH) coefficients, to provide an enhanced diffusion data characterization that includes information about the number of unique fiber orientations present in each voxel.
Purpose
The purpose of this study is to introduce the CASH method for the analysis of diffusion weighted images that provides information about the number of unique fiber populations, population orientation, and axon density within white matter voxels. Improved methods of defining fiber populations will allow characterization of changes in the microstructural properties of the brain resulting from pathology.Method
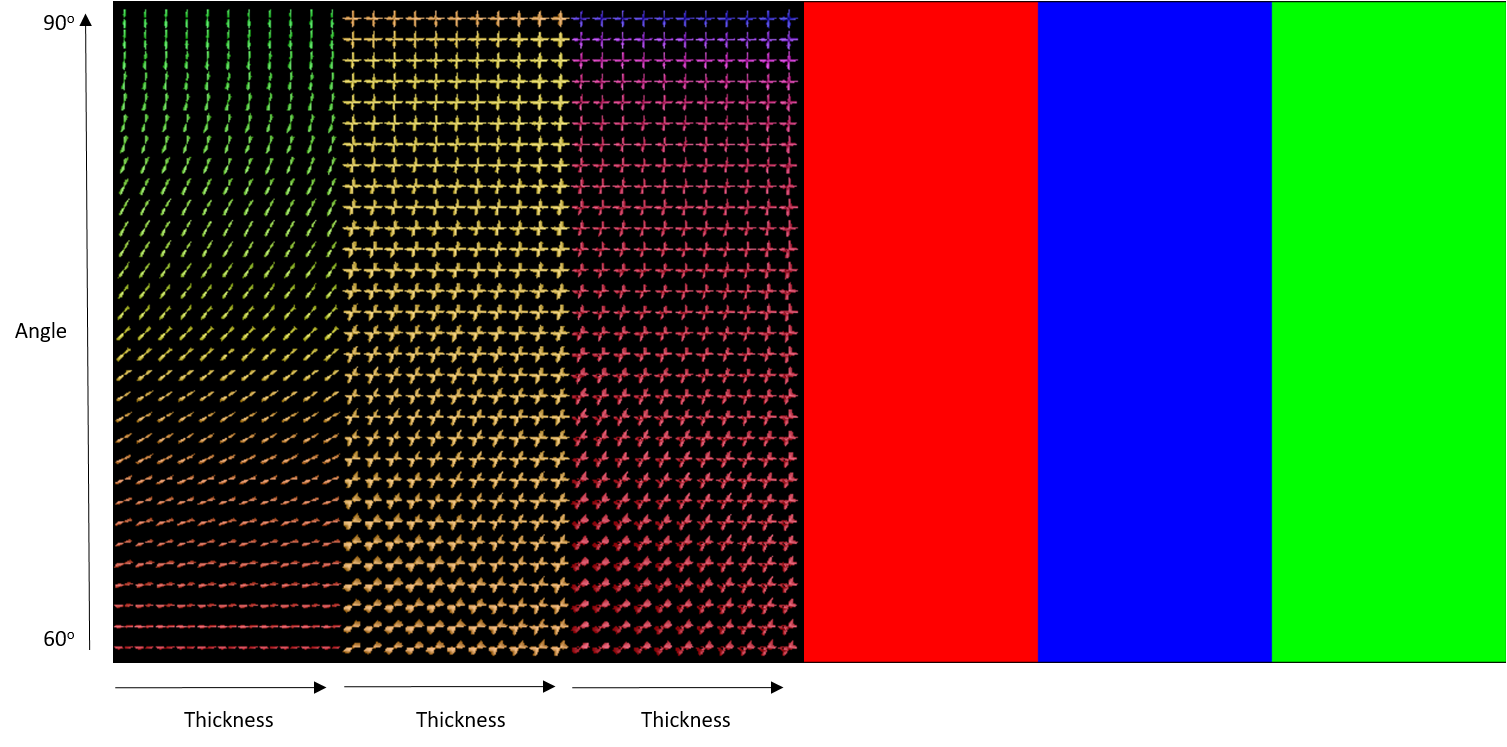
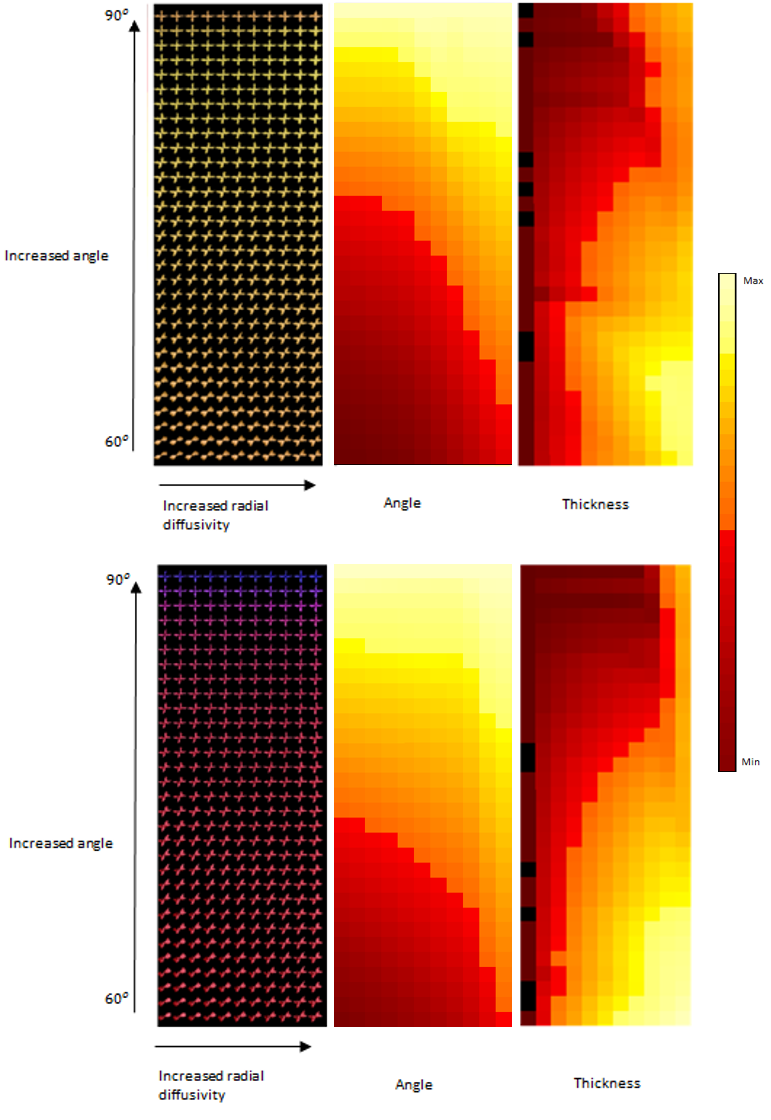
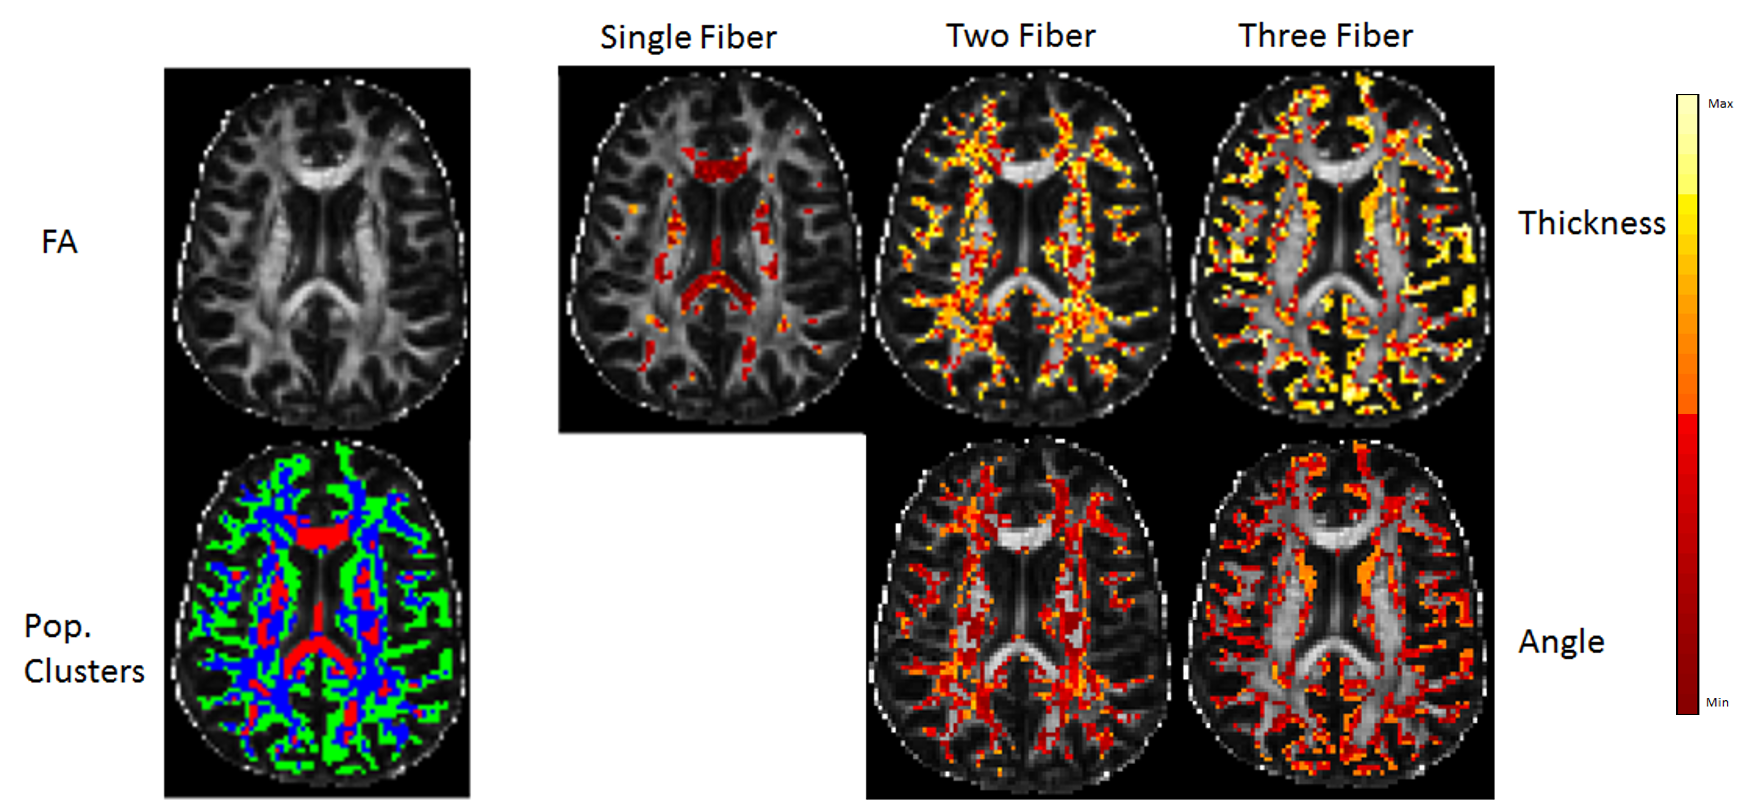
The first step in implementing the CASH method is to create a database of fiber configurations in a vector space that can be used for cluster analysis. Using in-house code written in IDL, high angular diffusion weighted signal was simulated for one-fiber, two-fiber, and three-fiber populations using a single tensor to represent each component of the fiber population with a varying fiber thickness and relative orientation ranging between 0o and 90o. Using the simulated data, the Mixture of Wisharts diffusion model 2 was used to calculate the diffusion DPF which was then expressed in a spherical harmonic expansion up to order 8. The coefficients for each order of the SH expansion were summed to give a single number, which eliminates variations due to orientation, then these coefficient-sums were used as elements of an n-dimensional vector, where n is the number of orders used for the SH expansion. This n-dimensional vector was created for each member of simulated dataset to generate a database of known single-fiber, two-fiber, and three-fiber fiber configurations, each of which could be thought of as a cluster center. Visual inspection of the DPF showed that fibers crossing at less than 60o could not be resolved, so a DPF with two fiber might appeared as a single fiber, or a DPF with three fibers might appear as two or even a single fiber. Therefore, fibers crossing at less than 60o was removed from the database to remove any overlap between clusters. To determine the characteristic of an unknown DPF, a Euclidean distance between the n-dimensional vector describing the unknown and each element in the entire database can be calculated. The unknown is then clustered with whichever configuration in the database produced the smallest Euclidean distance. This database clustering approach was tested using simulated data then applied to a human brain. An example of the simulated data used to test the database is shown in Figure 1. The n-dimensional vector for each voxel was compared to the entire database to cluster the diffusion data based on number of fiber populations (Figure 1). Further cluster analysis could provide more information about the unknown diffusion data. Further refining the calculation of the Euclidean distance between an unknown and elements of the database can provide information about the thickness of the fibers, as well as the relative orientation of the fibers for complex fiber regions.Results
Implementing CASH on simulated data revealed no error in determining the number of fiber populations (Figure 1). Each fiber population cluster was further analyzed to determine information about the relative orientation of the fibers, and the thickness of the fibers. Figure 2 shows fiber bundles were accurately clustered based on thickness, while the angle metric strongly correlated to the relative angle between the fiber populations. This method was also applied to the white matter in a healthy human brain. The white matter was segmented using a T1 weighted image and FSL Fast 3. The diffusion displacement probability function in each image voxel was analyzed with the CASH approach to represent the number of fibers in each voxel, the thickness of those fibers, and the relative orientation of those fibers (Figure 3).Discussion
Previous work attempted to classify diffusion data by considering combinations of SH coefficients to produce a measure of anisotropy and fiber populations 4, but these approaches were limited in the ability to characterize and discriminate different fiber configurations. We introduced a new method of characterizing white matter by clustering the coefficients of the spherical harmonic representation of the displacement probability function. Quantifying the number of unique fiber populations in each voxel can be used with other diffusion models to provide valuable microstructural information, and can be used to enhance tractography methods. Using the database, further characterization can be performed based on the angular separation of fibers in crossing fiber regions, as well as the thickness of the fiber bundles. The CASH method is applicable to any method of calculating the diffusion displacement probability function.Acknowledgements
A portion of this work was performed in the Advanced MRI/S (AMRIS) Facility at the McKnight Brain Institute of the University of Florida, which is part of the National High Magnetic Field Laboratory (supported by National Science Foundation Cooperative Agreement DMR-1157490, the State of Florida, and the U.S. Department of Energy). In addition, this work is supported in part by the NIH grants R01 NS082386 and NR0141181.References
1. Parker G. Probabilistic Fiber Tracking. In: Jones D, ed. Diffusion MRI: Theory, Methods, and Applications. New York, New York: Oxford University Press, Inc.; 2011:399-400.
2. Jian B, Vemuri B, Ozarslan E, Carney P, Mareci T. A novel tensor distribution model for the diffusion-weighted MR signal. Neuroimage. 2007;37:164-176.
3. Zhang Y, Brady M, Smith S. Segmentation of brain MR images through a hidden Markov random field model and the expectation-maximization algorithm. IEEE Trans Med Imaging. 2001;20:45-57.
4. Descoteaux M, Angelino E, Fitzgibbons S, Deriche R. Apparent diffusion coefficients from high angular resolution diffusion imaging: estimation and applications. Magn Reson Med. 2006;56:395-410.
Figures