1810
Analyses of Diffusion kurtosis imaging for spleen with liver disease1Tokyo Women's Medical University Yachiyo Medical Center, Yachiyo, Japan, 2The University of Tokyo Hospital, 3Tokyo women's Medical University Medical Center East
Synopsis
We evaluated the relationship between the mean kurtosis values (MK) and spleen size for the prediction of liver disease. As a result, there was no difference between the regular spleen and spleen with liver disease in the MK. Therefore, we consider that the splenic cell density and inner pressure remain unchanged even if patients have the enlarged spleen with liver diseases.
INTRODUCTION
In patients with advanced hepatic fibrosis and portal hypertension, enlarged spleen is a common finding [1]. Recently, Diffusion kurtosis imaging (DKI) techniques have emerged as advanced methods to evaluate tissue microstructure in vivo using water diffusion [2]. In vivo, the diffusion is normally restricted by tissue microstructure and show non-Gaussian phenomena [3,4]. DKI parameters have been proved to be able to indicate microstructural characteristics within brain [5,6]. Using this DKI analysis, we considered that the relationship between the kurtosis value of spleen and the spleen size could predict liver disease.
OBJECTIVE
The objective of our study was to assess the relationship between the mean kurtosis values (MK) and spleen size for the prediction of liver disease.METHODS
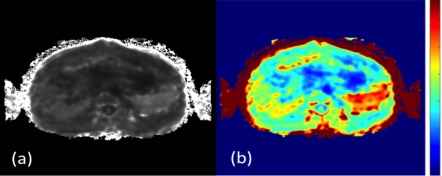
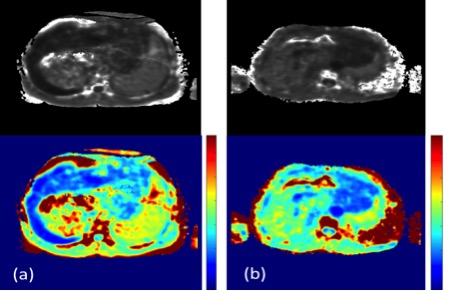
All examinations were performed using 3.0T MR scanner (Achieva, Phillips). 1) Diffusional Kurtosis Analysis We could use the breath hold method for DKI acquisition because of its short-acquisition time. Consequently, we could remove artifacts by macroscopic physiological motions. Therefore, using the breath hold method is vital to analyze DKI at the same slice position. K map images were generated on a voxel-by-voxel basis with DKE software [7]. Examples of mean DKI maps is shown in Figure 1. 2) Study population 15 healthy volunteers and 67 patients with liver disease underwent MRI of the spleen including DKI. Patients (n=67; 28 men and 39 women; mean age, 62.9 years; age range, 12-87 years). Volunteers (n=15; 9 men and 6 women; mean age, 31.0 years; age range, 26-41 years). 3) Scan protocols TR, 2500ms; TE, 58ms; Field of view, 400 ×400mm; Matrix, 80 × 80; Slice thickness, 5mm; Slice gap, 0.5mm; SENSE factor, 2; MPG pulse, three orthogonal directions; b values (0, 1000, 2000 s/mm2); Acquisition time, 22s. 4) Image analyses MK is defined as the average of the kurtosis over all possible diffusion directions. In patients with liver diseases and healthy volunteers, regions of interest (ROI) were always placed in the spleen center to avoid several artifacts. The center is the slice of a larger cross-section area in the spleen. MK were obtained by using commercially available software (MRI cro) [8,9]. Moreover, the MK were calculated from the mean value of 3 slices from the spleen (Fig. 2). Spleen index was defined as the longitudinal diameter [10,11]. Enlarged spleen was evaluated by using the spleen index of the spleen. Radiologists medically diagnosed 15 patients of all patients as enlarged spleen. 5) Statistical analyses All statistical analyses were performed by using JMP (version 11.0 for Macintosh, SAS). We evaluated the correlation between spleen size and MK of the spleen. Moreover, we evaluated the statistical difference between 15 healthy volunteers and 15 patients with enlarged spleen. The Spearman’s rank correlation was calculated from MK and the spleen size. Statistical difference between patients with enlarged spleen and healthy volunteers were assessed by the Wilcoxon signed-rank test.RESULTS
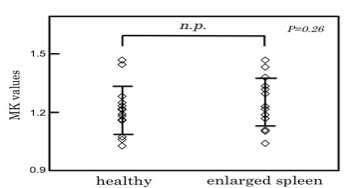
There were no significant correlations between spleen size and spleen MK (ρ=-0.02 p=0.85). In addition, there were no statistical difference in spleen MK between healthy volunteers and patients with enlarged spleen (P>0.05. P=0.26) (Fig. 3).DISCUSSION
In our results, there was no difference between the regular spleen and spleen with liver disease in the MK. Therefore, we consider that the splenic cell density and inner pressure remain unchanged even if patients have the enlarged spleen with liver diseases. The number of patients with enlarged spleen and healthy volunteers was low.CONCLUSION
Spleen MK is not valuable analysis to predict liver disease.Acknowledgements
No acknowledgement found.References
Klasen J, et al. Magn Reson Imaging. 2013 Sep;31(7):1092-6 Hori M, et al. Magn Reson Med Sci. 2012;11(4):221-33 Jensen JH, et al. Magn Reson Med. 2005 Jun;53(6):1432-40 Alexander DC, et al. Magn Reson Med. 2002 Aug;48(2):331-40 Raab P, et al. Radiology. 2010 Mar;254(3):876-81 Van Cauter S, et al. Radiology. 2012 May;263(2):492-501 Jensen, J.H, et al. Magn Reson Med. 2005 Jun;53(6):1432-40. Wick W, et al. Neuro Oncol. 2008 Dec;10(6):1019-24 Mahvash M, et al. Acta Neurochir (Wien). 2013 May;155(5):943-7 Ishibashi H, et al. J Clin Ultrasound. 1991 Jan;19(1):21-5 Torii Y, et al. Journal of medical ultrasonics. 2005 Apr;32:375Figures