1808
Application of Weighted Diffusion Subtraction (WDS) to Synovial Sarcomas: Possibility of Visualising Tumor Cellularity1Department of Radiology, Nippon Kokan Hospital, Kawasaki, Japan, 2Department of Diagnostic Radiology, Keio University School of Medicine, Tokyo, Japan
Synopsis
DWI and ADC values are widely used for tissue characterization. However, the relationship between the ADC values and the histological findings is still controversial. Weighted diffusion subtraction (WDS) was originally developed to eliminate T2 shine-through ambiguity in diffusion MRI evaluations. In this study, we applied WDS technique to diffusion weighted images of synovial sarcomas to evaluate the complex and heterogeneous tissue. Correspondence was found between WDS and histological findings on visual inspection. WDS seems to be a valuable visualization tool.
Introduction
Recently, the relationship between ADC value and the pathological feature composing of simple tissue component is becoming clear,1,2 in which the cell size plays an important role for generating contrast between tumor and surrounding tissue. However, the correspondence between ADC values and tumors with complicated histology, such as musculoskeletal tumors, is still unclear, and the investigational approach has not established yet. Weighted diffusion subtraction (WDS) was originally developed to eliminate T2 shine-through ambiguity in diffusion MRI evaluations3. The purpose of this study was to apply WDS technique on synovial sarcomas and to test its ability to evaluate cellularity of the tissue.Methods
WDS is a subtraction technique, using a pixel-by-pixel calculation: $$ S(x, y) = S_0(x, y) \exp(- \Delta b D_{thres}) - S_1(x, y) \\ = S_0(x, y) \exp(- \Delta b D_{thres}) - S_0(x, y) \exp(- \Delta b ADC(x, y)), $$ where S is the signal intensity of the new image, S0 is that of the image obtained with the low b value, and S1 is that of the image acquired with the high b value. Dthres is the threshold value of the diffusion coefficient at which the sign of the signal of the new image is inverted, and Δb is the difference between the b values of the two diffusion-weighted images. The subjects were DWI of synovial sarcoma in three patients. The histology was proven on the specimen resected in the operation performed within 1 month after the MRI examination. The tumor locations were the hip, ankle and forearm. MR images were acquired on a 1.5T scanner (Signa HD, GE Healthcare, Waukesha, WI, USA) using body coil or quadrature foot coil as a receiver. Following routine MRI including T1WI and T2WI, EPI-based DWI (b=0 and 1000 s/mm2) was obtained with following parameters: TR/TE, 4200-5000/77-82 ms; slice thickness/spacing, 5-7/7-11 mm; matrices 128x160 or 96x128. The pixel size was ranged between 0.7 mm and 1.6 mm, depending the diameter of the subject. The image data was transferred to iMac and WDS was calculated using in-house software. WDS was obtained with the thresholds of Dthres (1.0, 1.5, 2.0, 2.5, 3.0 mm2/s). The images of WDS were visually compared to the histological images stained with hematoxylin-eosin.Results
Fig.1 shows a representative WDS image of synovial sarcoma (Dthres = 2.0 mm2/s). The signal intensity of the tumor is heterogeneous, and the hypointense area decreases with increasing number of Dthres. The contrast between the tumor and the surrounding tissue was insufficient at Dthres of 1.0. At Dthres of 3.0, WDS clearly delineated the tumor; however, the anatomical information was lost on the image. In this study, Dthres of 2.0 was assumed to be the best value for depicting the tumor with keeping anatomical background. The hypointense on WDS with Dthres of 2.0 was well-matched at the area existing tumor cells with high cellularity on the histological specimen.Discussion
WDS technique was originally developed to avoid T2 shine-though ambiguity. Tumor tissues were assumed to have less than 1.0 ADC values, resulting in negative pixel values in the calculated WDS images. However, in synovial sarcomas, the tumor tissue is extremely heterogeneous and ADC values are often larger than 1.0, since various components are contained within a single pixel. Using WDS with a Dthres larger than 1.0, it is possible to visualize cell component with small ADC sparsely distributed in a heterogeneous tissue. Simply stated, in the WDS process signals of tissues with ADC values close to the Dthres are suppressed, and tissues slightly smaller and larger ADC values are visualized with negative and positive signals respectively. By changing the Dthres value, it is possible to change the focus of visualisation to different range of ADC values. This is by no means a quantitative technique, but seems to be a valuable visualization tool.Acknowledgements
No acknowledgement found.References
1. Zhao L, Sukstanskii AL, Kroenke CD, et al. Intracellular water specific MR of microbead-adherent cells: HeLa cell intracellular water diffusion. Magn Reson Med. 2008 Jan;59(1):79-84.
2. Oshio K, Shinmoto H, Mulkern RV. Interpretation of diffusion MR imaging data using a gamma distribution model. Magn Reson Med Sci 2014; 13(3):191-195.
3. Oshio K, Okuda S, Shinmoto H. Removing Ambiguity Caused by T2 Shine-through using Weighted Diffusion Subtraction (WDS). Magn Reson Med Sci. 2016;15(1):146-8.
Figures
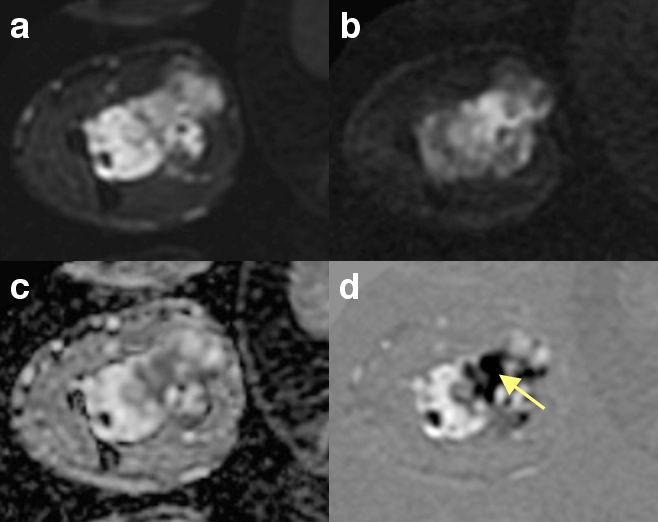
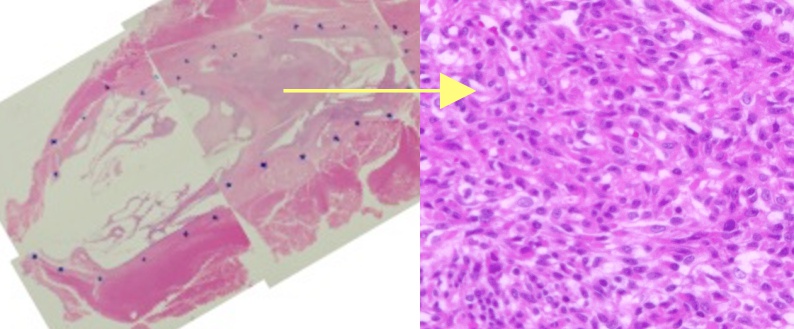
Synovial sarcoma of right forearm. The hypointense on WDS (arrow) was well-matched at the area with high cellularity on the histological specimen.
a DWI (b=0) b DWI (b=1000) c ADC map d WDS (Dthres=2.0)