1806
Rapid Measurement of Perfusion Fraction in Clinical Neuroimaging1Physical Sciences of Imaging in Biomedical Sciences (PSIBS), University of Birmingham, Birmingham, United Kingdom, 2Institute of Cancer and Genomic Sciences, University of Birmingham, Birmingham, United Kingdom, 3Department of Oncology, Birmingham Children's Hospital, Birmingham, United Kingdom, 4School of Computer Science, University of Birmingham, Birmingham, United Kingdom
Synopsis
This study investigated the reliability of using a rapid three b-value diffusion-weighted imaging to determine intravoxel incoherent motion (IVIM) parameters. Grey matter simulations were conducted to assess the bias and reproducibility of the parameters with b-value distributions: b0,300,500,1000, b0,500,1000 and b0,300,1000. The same b-value distributions were assessed with a volunteer cohort. The results showed that the use of two high b-values provided a good estimate of the perfusion fraction, which was further improved by an increase in the SNR level. In conclusion, the measurement of IVIM-f was achievable using a three b-value protocol.
Purpose
The clinical adoption of the intravoxel incoherent motion (IVIM) model for multi-b-value diffusion-weighted MRI has been hindered by practical issues such as lengthy acquisition times and lack of consensus for signal data fitting1. Although the brain has been found relatively low-perfused compared to abdominal organs2, the perfusion fraction parameter (IVIM-f), equating to a measure of cerebral blood volume3, has been shown to have clinical value4,5. With short acquisition times being invaluable for the translation of the method into clinical practice, the viability of a rapid diffusion protocol and the estimation of diffusion coefficient (IVIM-D) and IVIM-f using a constrained fitting method6 was investigated in this study. Data simulations were used to assess the measurement error of the estimated IVIM parameters and a volunteer cohort to assess the agreement of simulated and in-vivo results.Methods
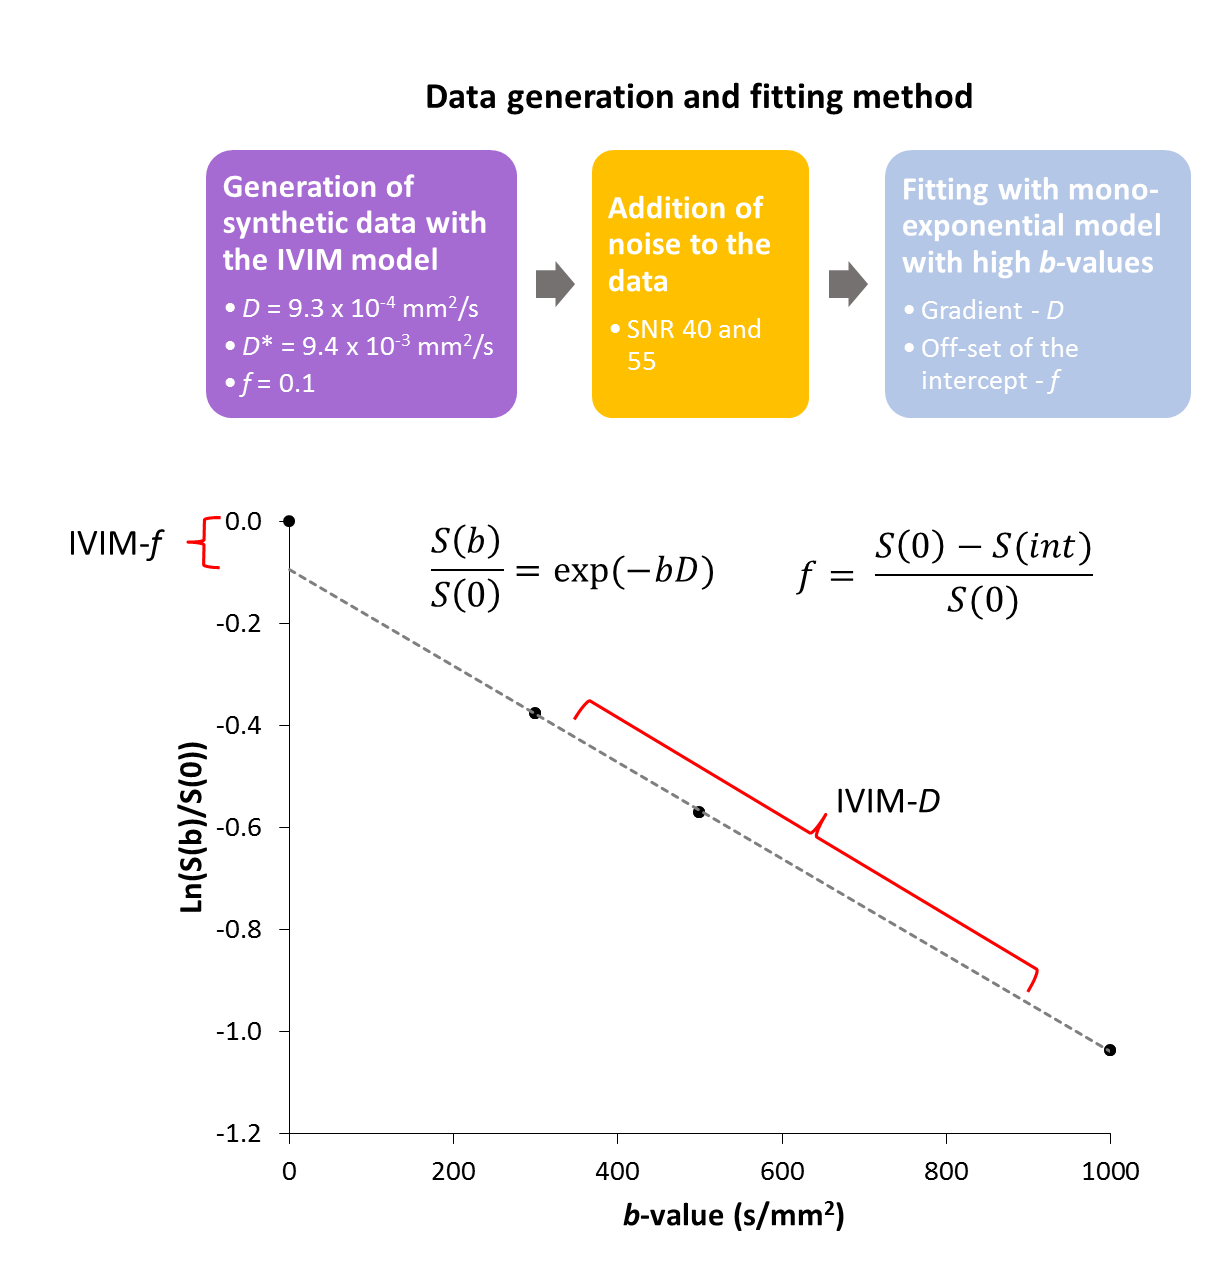
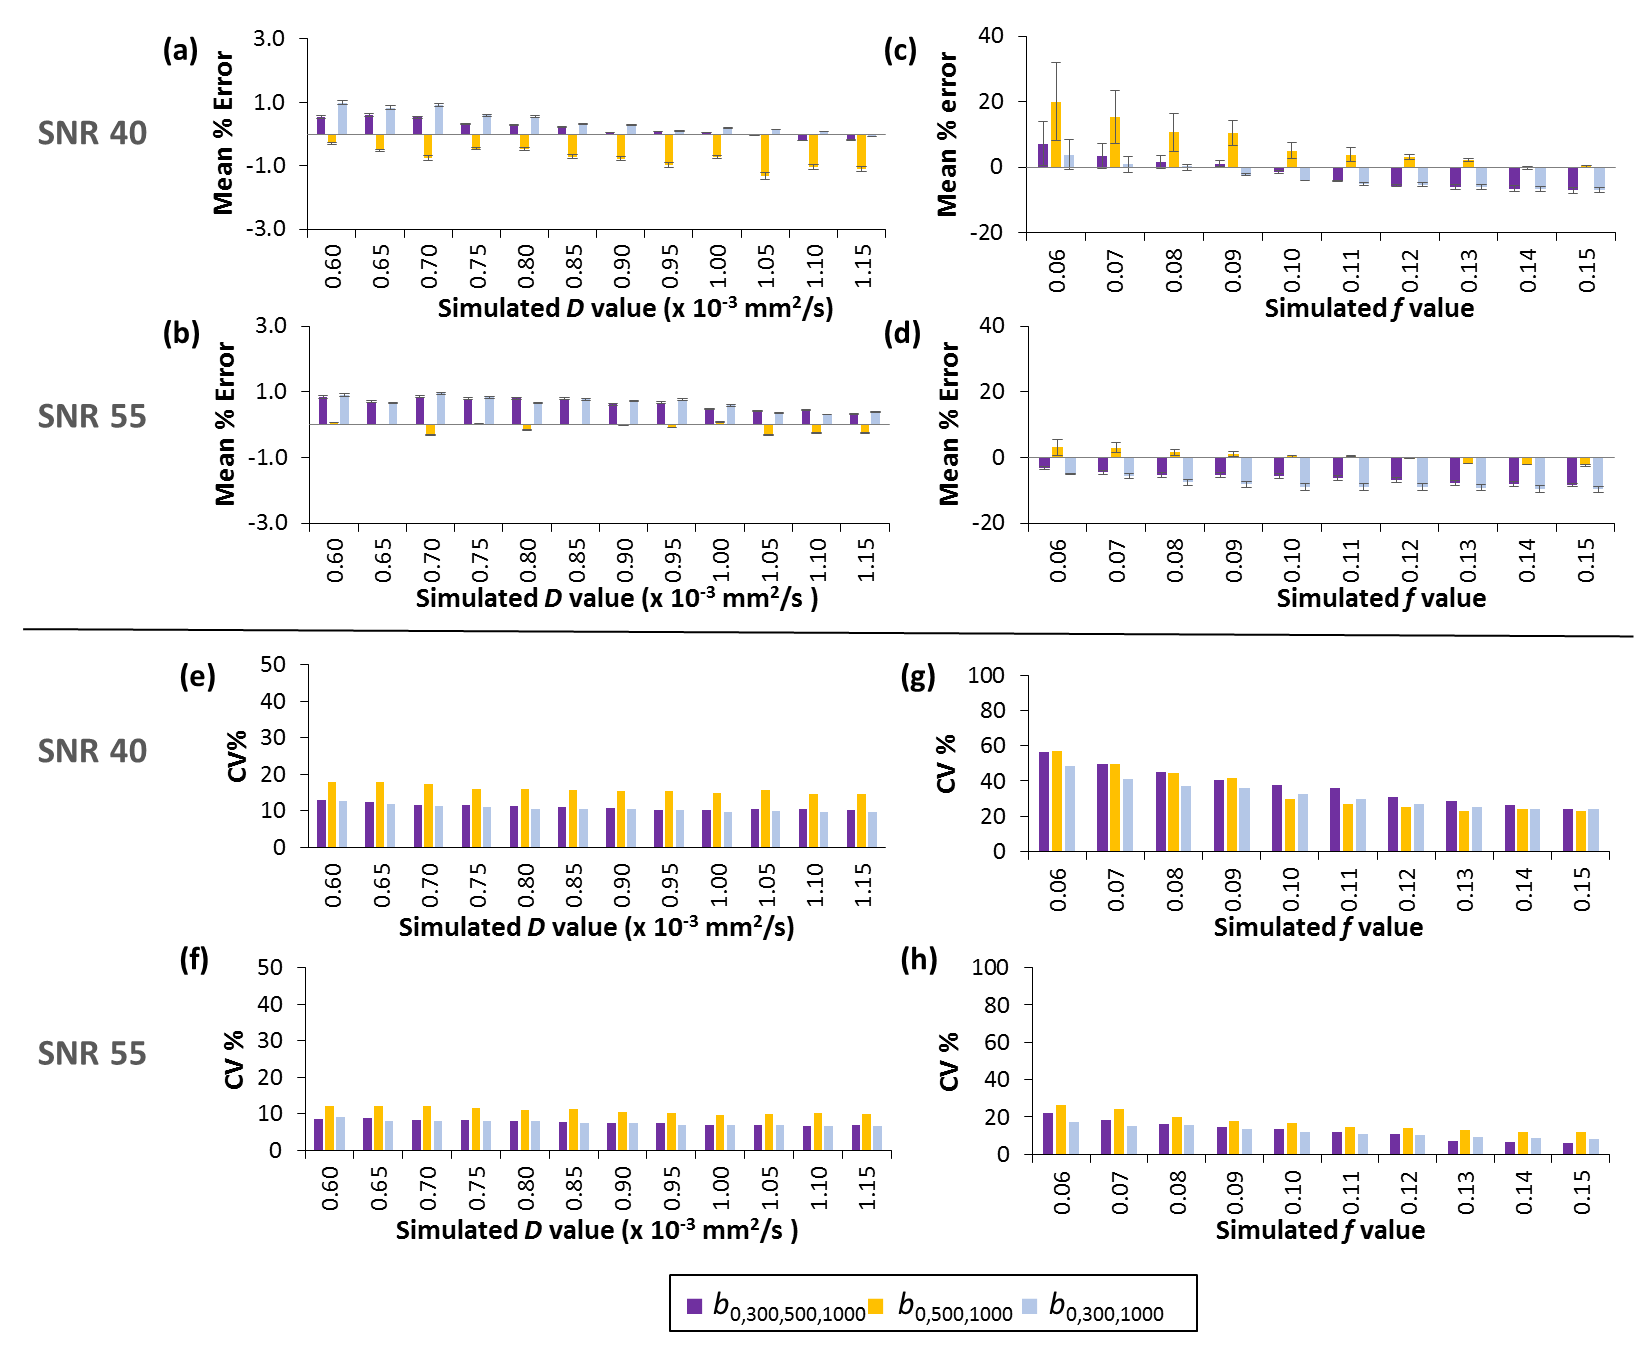
Data analysis was performed using in-house Python software (v.2.7.10) and statistical analysis in SPSS (IBM v.22). Model data was generated using IVIM parameters derived from volunteer grey matter regions and an exponentially spaced b-value distribution (0-1000 s/mm2). Linear data fitting was used for high b-values (≥ 300 s/mm2) to determine the IVIM-D and IVIM-f (Fig.1). The b-value distributions compared were b0,300,500,1000, b0,500,1000 and b0,300,1000. Noise levels of SNR=40 and 556 were investigated, where SNR=55 approximated an increase in the signal number of averages from one to two.
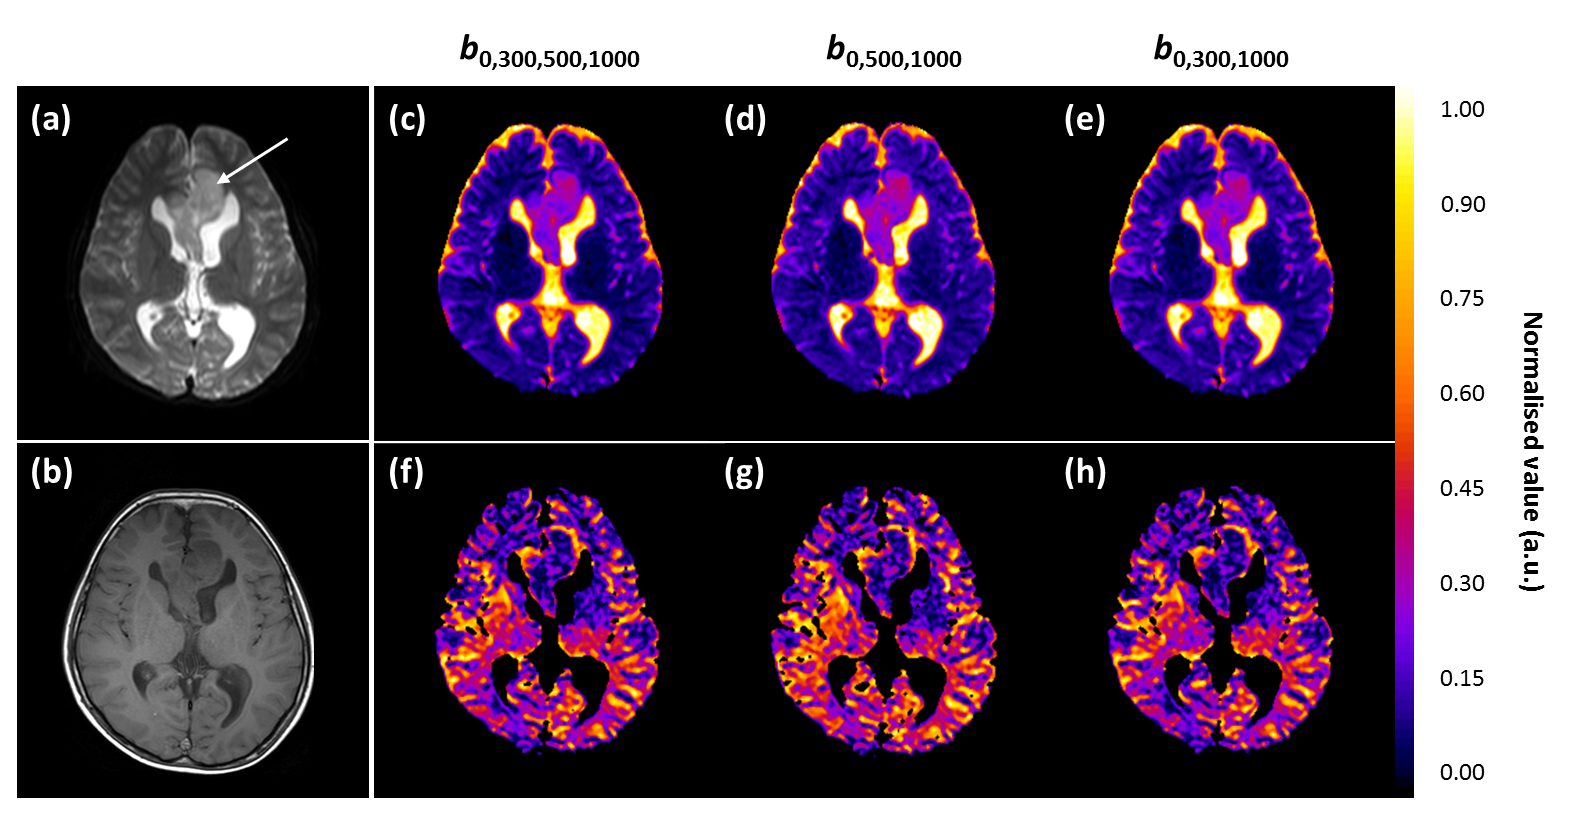
Volunteer data (n=16, mean age 26 years) was acquired on a Philips Achieva 3T TX MRI scanner at the Birmingham Children’s Hospital using 32-multichannel receiver head coil. The diffusion protocol used a sensitivity-encoded (SENSE) approach with single-shot, spin echo (EPI) sequence with the following parameters: TR/TE=4000/91 ms, b-values including: 0,300,500,1000 s/mm2, FOV 240x240 mm2, matrix size 96x96, 3.5 mm slice thickness and in plane resolution 2.5x2.5 mm2. A patient scan (age 10, pilocytic astrocytoma) was performed with b-values: 0,300,500,1000, FOV 230x230 mm2, TR/TE 3214/84 ms, matrix size 256x256, 5 mm slice thickness and in-plane resolution 0.9x0.9 with duration of 1 min. Segmented grey matter regions (FSL-BET7, threshold=0.1) from T1-weighted images (with same spatial geometry to DWI) were used to extract ROIs.
Results
The relative bias and reproducibility results from the data simulations are shown in Fig.2. At SNR=55, the biases and coefficients of variations for IVIM-f=0.1±0.02 were estimated at -5.8%,13.4% for b0,300,500,1000, 0.67%,16.6% for b0,500,1000 and -8.4%,12.5% for b0,300,1000. The measurement of IVIM-f improved with the increase of SNR level to a greater extent than seen for IVIM-D.
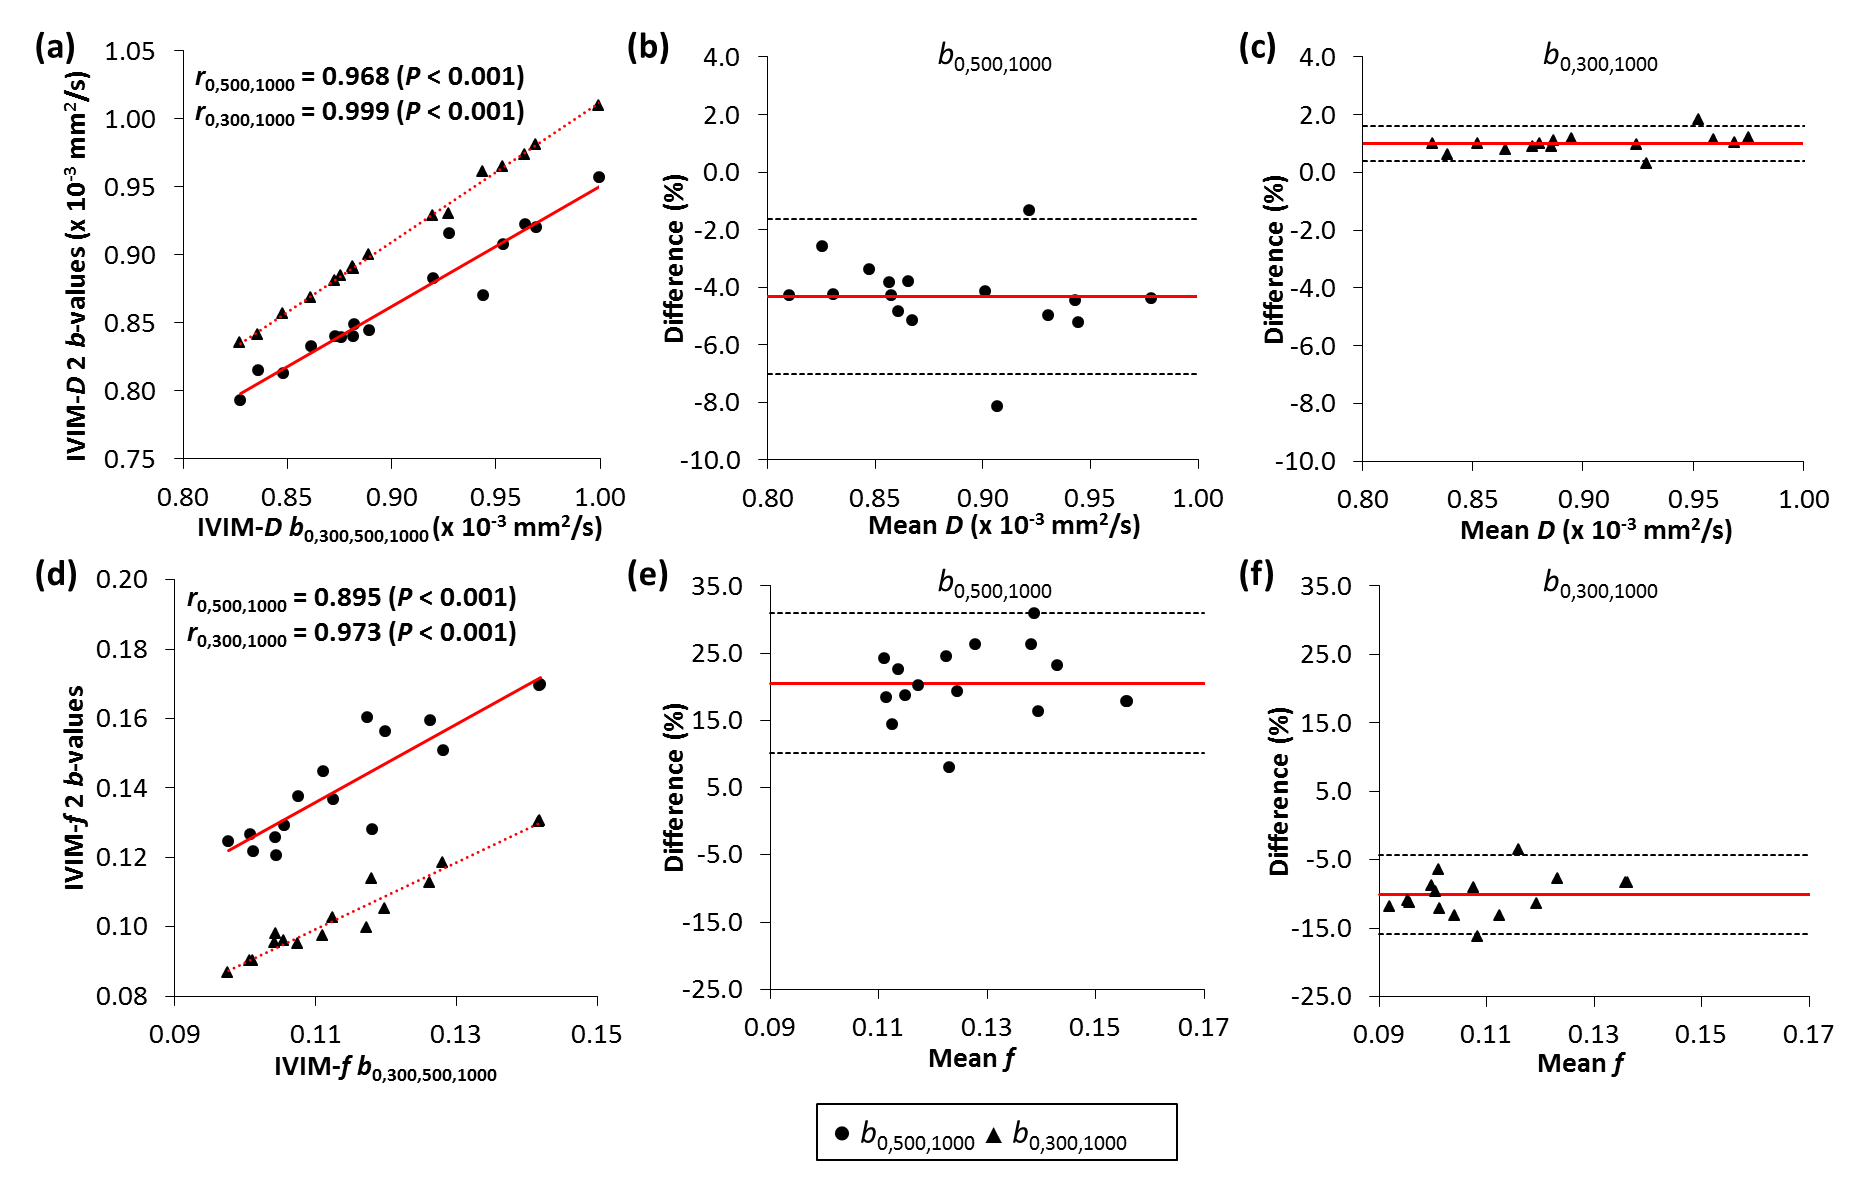
Similar differences were observed for the in-vivo data (Fig.3). Significant correlations were established between the b0,300,500,1000 and the three b-value distributions for estimation of the IVIM parameters. However, the estimation of IVIM-f was significantly different (P<0.001) between the b0,500,1000 and b0,300,500,1000. The Bland-Altman analysis for IVIM-D with b0,500,1000 and b0,300,1000 distributions resulted in relative differences of -4.3% (-7.0,-1.6%) and 1.00% (0.4,1.6%), respectively. For IVIM-f, the differences were 20.6% (10.1,31.0%) for b0,500,1000 and -10.1% (-15.9,-4.3%) for b0,300,1000.
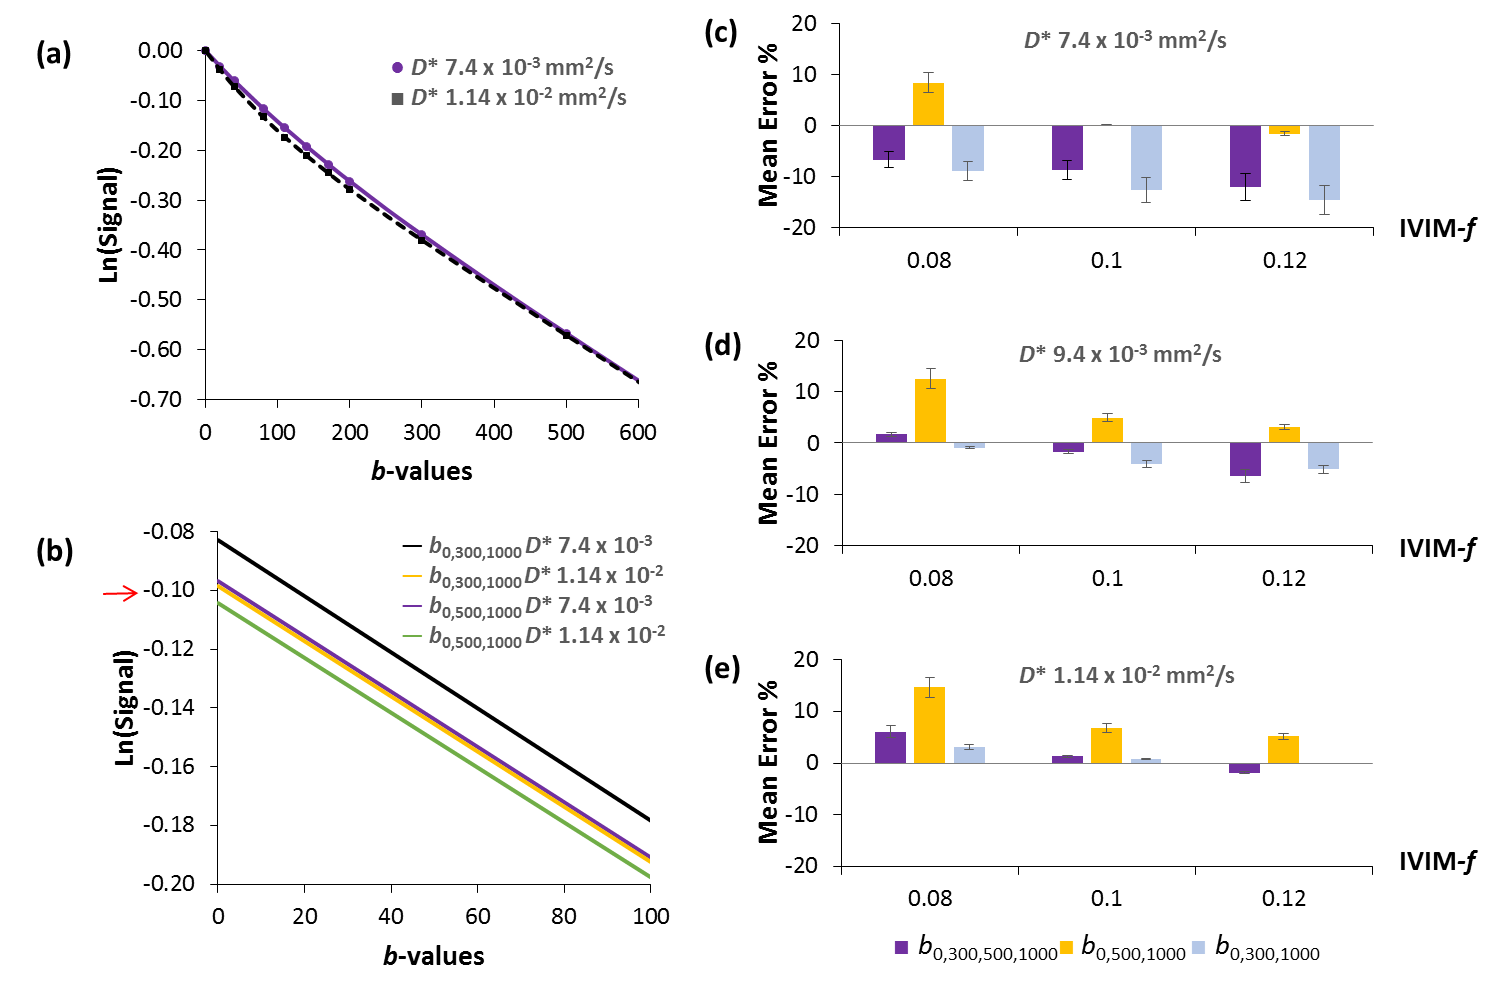
Influence of the ratio of IVIM diffusion coefficient parameters (D and D*) was investigated due to the greater differences observed for the IVIM-f with in-vivo data versus simulated data (Fig. 4). At lower IVIM-D* (D-D* <10-1) greater differences were seen for the estimation of IVIM-f between the b0,500,1000 and the b0,300,1000 distributions, with overall better accuracy achieved using the b0,500,1000 (Fig. 4c).
Discussion
The data simulations suggested that the estimation of IVIM parameters was robust for commonly observed values in the brain4,5,8. The b0,300,1000 and b0,500,1000 distributions showed opposing behavior with the biases of IVIM-D and IVIM-f values, which was also seen in-vivo. At higher SNR, the IVIM-f values were better estimated with the b0,500,1000 distribution as well as at regions where the ratio of the two diffusion coefficients was smaller, indicating that the use of b0,500,1000 is beneficial in regions of lower degree of bi-exponential behavior. Similar effects were seen in previous study4, where in-vivo IVIM-f values derived with b300,900 were lower compared to distributions with higher b-values. Therefore, to reduce the effect of underestimation in these regions, we suggest the use of b-values>300 s/mm2.
An improvement in the fitting with greater pixel volume and higher SNR was observed for the clinical case (Fig. 5). The three b-value protocol duration was 50 seconds (vs. two b-value 40 seconds), and can therefore be easily adapted for clinical use. Increasing the number of averages (Fig.2) or using two mid-range b-values can improve stability of IVIM-f.
Conclusion
The estimation of the IVIM parameters D and f was achievable using a rapid DWI protocol with three b-values. A mid-range b-value >300 s/mm2 and high SNR is recommended for more accurate results.Acknowledgements
This work was funded by the Engineering and Physical Sciences Research Council (EPSRC, EP/F50053X/1), the National Institute for Health Research (NIHR) via a Research Professorship (13-0053), the Paediatric Experimental Cancer Medicine Centre and Free Radio in conjunction with Help Harry Help Others (HHHO).References
1. Barbieri S, Donati OF, Froehlich JM and Thoeny HC. Impact of the calculation algorithm on biexponential fitting of diffusion-weighted MRI in upper abdominal organs. Magn Reson Med. 2015;75(5):2175-2184.
2. Lemke A, Stieltjes B, Schad LR, Laun FB. Toward an optimal distribution of b values for intravoxel incoherent motion imaging. Magn Reson Imaging 2011;29(6):766-776.
3. Le Bihan D, Turner R. The capillary network – a link between IVIM and classical perfusion. Magn Reson Med. 1992;27(1):171-178
4. Conklin J, Heyn C, Roux M, Cerny M, Wintermark M, Federau C. A Simplified Model for Intravoxel Incoherent Motion Perfusion Imaging of the Brain. AJNR Am J Neuroradiol 2016.
5. Federau C, O'Brien K, Meuli R, Hagmann P, Maeder P. Measuring brain perfusion with intravoxel incoherent motion (IVIM): Initial clinical experience. J Magn Reson Imaging 2014;39(3):624-632.
6. Meeus EM, Novak J, Withey SB, Zarinabad N, Dehghani H, Peet AC. Evaluation of intravoxel incoherent motion fitting methods in low-perfused tissue. J Magn Reson Imaging 2016, DOI: 10.1002/jmri.25411.
7. S.M. Smith. Fast robust automated brain extraction. Human Brain Mapping, 2002;17(3):143-155.
8. Grech-Sollars M, Hales PW, Miyazaki K, et al. Multi-centre reproducibility of diffusion MRI parameters for clinical sequences in the brain. Nmr Biomed. 2015; 28: 468-85.
Figures