1804
Histogram Analysis of Intravoxel Incoherent Motion MR Imaging–Related Parameters in Brain Glioma Grading: A Comparison Between 2D and 3D methods1Department of Medical Imaging Center, Nanfang Hospital, Southern Medical University, Guangzhou, People's Republic of China, 2Guangdong Provincial Key Laboratory of Medical Image Processing, School of Biomedical Engineering, Southern Medical University, Guangzhou, People's Republic of China, 3Philips Healthcare, Guangzhou, China., 4Department of Medical Imaging Center, The Third Affiliated Hospital, Southern Medical University, Guangzhou, People's Republic of China
Synopsis
Gliomas are the most common primary neoplasms of the brain, World Health Organization (WHO) clarify it from low grade(LGGs; grade II) to high grade(HGGs; grades III, IV). The objective of this study was to explore which method is the best method with little time consuming and good grading of glioma.
purpose
Gliomas are the most common primary neoplasms of the brain, and the prognosis and therapeutic protocol depends highly on the tumor grade1. Many techniques have been developed to differentiate low grade glioma from the high grade ones. Intravoxel incoherent motion (IVIM) can provide information of water molecular diffusion and micro-circulation simultaneously. The main purpose of this study was to compare the diagnostic performance of IVIM 2D and 3D histogram analysis models for differentiating low grade from high grade glioma.Materials and Method
Thirty-seven patients (21 men, 16 woman; aged 45.68 y; ranging between 5-72 y; median, 48 y) were included in this study(26 high grade and 11 low grade). All the patients were scanned on a 3T Philips scanner with an 8-channel sensitivity-encoding head coil. The protocols included pre-contrast T1WI, FAIR and multi-b-value DWI, followed by post-contrast T1WI for every patients. T1WI : TR/TE/TI = 2000/20/850ms, matrix size = 512× 512, slice thickness= 6 mm; FLAIR:TR/TE/TI=9000/120/2600 ms, matrix size= 512 × 512, slice thickness= 6 mm; DWI: b-values = 0, 10, 20, 40, 60, 100, 140, 160, 200, 300, 500, 1000, 1500, and 2000 s/mm2, TR/TE = 3000/72 ms, matrix size = 128 × 128, slice thickness = 6mm. Analysis: Based on bi-exponential model, DWI data were processed using home-developed GUI software. All the ROIs of 2D and 3D method were defined with the largest diameter encompassing as much of the solid tumor area as possible on FLAIR image and then copied to D and f image. The ROIs of 2D method was defined on represented slice, and the ROIs of 3D method were defined on all slice with lesion and include whole lesion. Large vessel, cystic necrotic and hemorrhagic components of the tumor was excluded with reference to other conventional MR images. Dp102D, Dp103D, fp102D and fp103D of histogram analysis related parameters were calculated and compared. The comparison of all variable between low and high grade glioma were performed using Statistical Package for the Social Sciences software (version 20.0, IBM Corp., Armonk, NY, USA).The comparison between 2D method and 3D method were performed using MedCalc (version 14.12.0; MedCalc Software, Mariakerke, Belgium). The results with p values of less than 0.05 were considered to be statistically significantResults
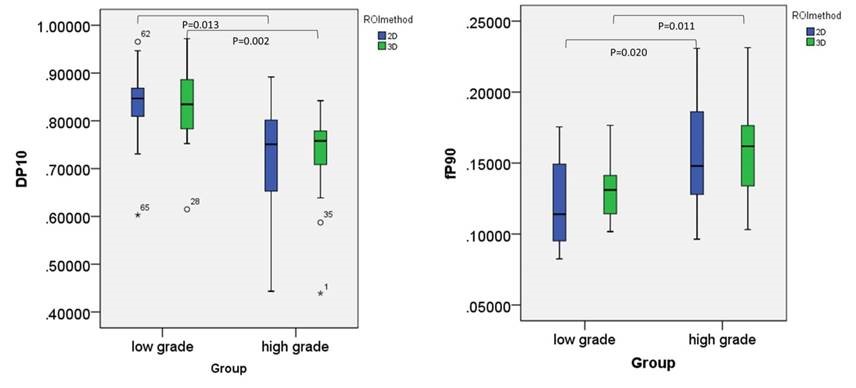
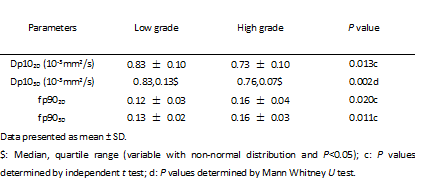
Comparing Dp102D value(10-3mm2/s) and fp902D value between low and high grade group, all variable displayed normal distributions (p>0.05). Obvious differences were observed between low and high grade group of Dp102D (low/high, 0.83 ± 0.10/0.73 ± 0.10, p=0.013) and fp902D (low/high 0.12 ± 0.03/0.16 ± 0.04, p=0.020) respectively. If 0.804 was selected as the cutoff value of Dp102D, the sensitivity and specificity were 76.9% and 81.8% respectively. If 0.116 was selected as the cutoff value of fp902D, the sensitivity and specificity were 84.6% and 45.5% respectively. Comparing Dp103D value (10-3mm2/s) and fp903D between low and high grade group, the variable of fp903D displayed normal distributions (p>0.05), but Dp103D without (p<0.05). Obvious differences were observed between low and high grade group of Dp103D (low/high, 0.83, 0.13/0.76, 0.07, p=0.002) and fp903D (low/high 0.13 ± 0.02/0.16 ± 0.03, p=0.011) respectively. If 0.781 was selected as the cutoff value of Dp103D, the sensitivity and specificity were 80.8% and 81.8% respectively. If 0.133 was selected as the cutoff value of fp903D, the sensitivity and specificity were 76.9% and 63.6% respectively. Comparing AUC of Dp10 and fp90 between 2D and 3D method, the AUC of Dp10 and fp90 on 3D method were moderate larger than 2D method, but the differences without statically significance (P=0.3528 for Dp10, P=0.7314 for fp90).Disscusion and Conclusion
The histogram analysis parameter of D value and f value can differentiate low and high grade glioma well both on 2D method and 3D method. The sensitivity and specialty of 3D method is slightly higher than 2D method, but without statically significance. Allowing for time consume, the 2D method maybe the best choice.Acknowledgements
No acknowledgement found.References
1.Louis DN, Perry A, Reifenberger G, et al. The 2016 World Health Organization Classification of Tumors of the Central Nervous System: a summary. Acta neuropathologica. 2016;131(6):803-20.
2.Lam WW, Poon WS, Metreweli C. Diffusion MR imaging in glioma: does it have any role in the pre-operation determination of grading of glioma? Clin Radiol. 2002;57(3):219-25.
3. Le Bihan D, Breton E, Lallemand D, Aubin ML, Vignaud J, Laval-Jeantet M. Separation of diffusion and perfusion in intravoxel incoherent motion MR imaging. Radiology. 1988;168(2):497-505.
4. Suo S, Cao M, Zhu W, et al. Stroke assessment with intravoxel incoherent motion diffusion-weighted MRI. NMR in biomedicine. 2016;29(3):320-8.
Figures