1803
Individualized prediction of mild cognitive impairment based on patterns of altered tract integrity over the whole brain using diffusion spectrum imagingYu-Jen Chen1, Yun-Chin Hsu1, Yu-Ling Chang2, Ming-Jang Chiu3, and Wen-Yih Isaac Tseng1,4
1Institute of Medical Device and Imaging, National Taiwan University College of Medicine, Taipei, Taiwan, 2Department of Psychology, National Taiwan University, Taipei, Taiwan, 3Department of Neurology, National Taiwan University Hospital, Taipei, Taiwan, 4Molecular Imaging Center, National Taiwan University, Taipei, Taiwan
Synopsis
In this study, we tested the capability of individualized prediction for mild cognitive impairment (MCI) by using the information of whole brain tract integrity produced by tract-based automatic analysis method. The information was trained to search the tract segments that could most accurately separate the MCI patients and healthy participants. The optimal tract segments were searched with the area under receiver operating characteristic curve of 0.76. These specific segments of white matter tracts could potentially serve as imaging biomarker for predicting patients with MCI.
Objectives
Mild cognitive impairment (MCI) has been considered as a prodromal form of dementia, conferring a 10-15% annual risk of converting to probable Alzheimer’s disease (AD) [1]. Several reports indicate that diffusion magnetic resonance imaging (dMRI) and quantification of the fiber integrity may be a tool for early detection of MCI [2]. However, there is no study showing the capability of individualized prediction of the MCI based on the differences in the tract integrity over the whole brain. In this study, we used the tract-based automatic analysis (TBAA) method [3] to obtain whole brain tract integrity for individual subjects. The information of integrities, named 2D connectogram, was tested for predicting adult patients with MCI. We aimed to investigate the capability of individualized prediction of MCI by using the information of whole brain fiber tracts.Methods
Seventy MCI patients (61.7 ± 8.5 years) and 70 healthy controls (57.4 ± 7.9 years) were recruited in the analysis. Images were acquired on a 3T MRI system with a 32-channel head coil (Tim Trio, Siemens, Erlangen, Germany). Diffusion spectrum imaging (DSI) was acquired for 102 diffusion encoding gradients with the maximum diffusion sensitivity bmax = 4000 s/mm^2 using a twice-refocused balanced echo diffusion echo planar imaging sequence (TR/TE = 9600/130 ms, image matrix size = 80 x 80, spatial resolution = 2.5 x 2.5 mm^2, and slice thickness = 2.5 mm). TBAA method was applied to subjects to assess the whole-brain white matter properties. A 2D connectogram comprising generalized fractional anisotropy (GFA) along predefined 76 major tracts and 100 continuous steps for each tract was estimated as standardized information for each subject. Subjects were randomly separated into a training group and a predicting group for 200 experiments. For each experiment, difference between patients and controls was determined by comparing the 2D connectogram between the two groups. Series of masks were determined from the difference to represent the locations passing the criteria of different effect sizes (ES) and cluster sizes (CS) (ES: 0, 0.05, 0.1,…, 1; CS: 1, 2, 3,…, 15). For predicting group, a MCI-like score (MLS) was estimated for each subject by using the following steps. 1) By comparing the connectogram with the training datasets, steps with GFA values closer to MCI than to control were noted as MCI-liked, otherwise as control-liked. 2) Steps passing the criteria of the mask were reserved and MLS was defined as the number of steps which were MCI-liked among the reserved steps. The performance of prediction was evaluated with receiver operating characteristic (ROC) curve analysis by comparing the MLS and clinical diagnostic results. Masks with different criteria of ES and CS were applied to evaluate what kind of difference between MCI patients and controls over the whole brain has the best capability in distinguishing the two groups.Results
Figure 1 shows the maps of averaged area under ROC curves (AUC) of different masks from 200 examinations. The segments for predicting MCI subjects are located in several specific tract bundles with medium ES of 0.5 and high CS of 15 steps as figure 1 showed. Figure 2 shows the heat map generated by accumulating the masks with highest AUC from 200 examinations. The heat map (figure 2) showed the potential imaging biomarker for MCI generated by white matter structural segments while the contrast of the colors may imply the importance level for prediction.Discussion
In this study, we examined the performance of predicting patients with MCI based on the patterns of altered tract integrity over the whole brain. The whole-brain tract information was compared with predefined differences between MCI patients and healthy participants to calculate an index of MLS indicating the similarity of white matter structures to MCI. Our results showed that the prediction performance was satisfactory (AUC = 0.76) when we compared the white matter integrities at specific segments on fiber pathways.Acknowledgements
No acknowledgement found.References
[1] Karantzoulis S, et al. (2011). [2] Dickerson et al. (2013). [3] Chen et al. (2015)Figures
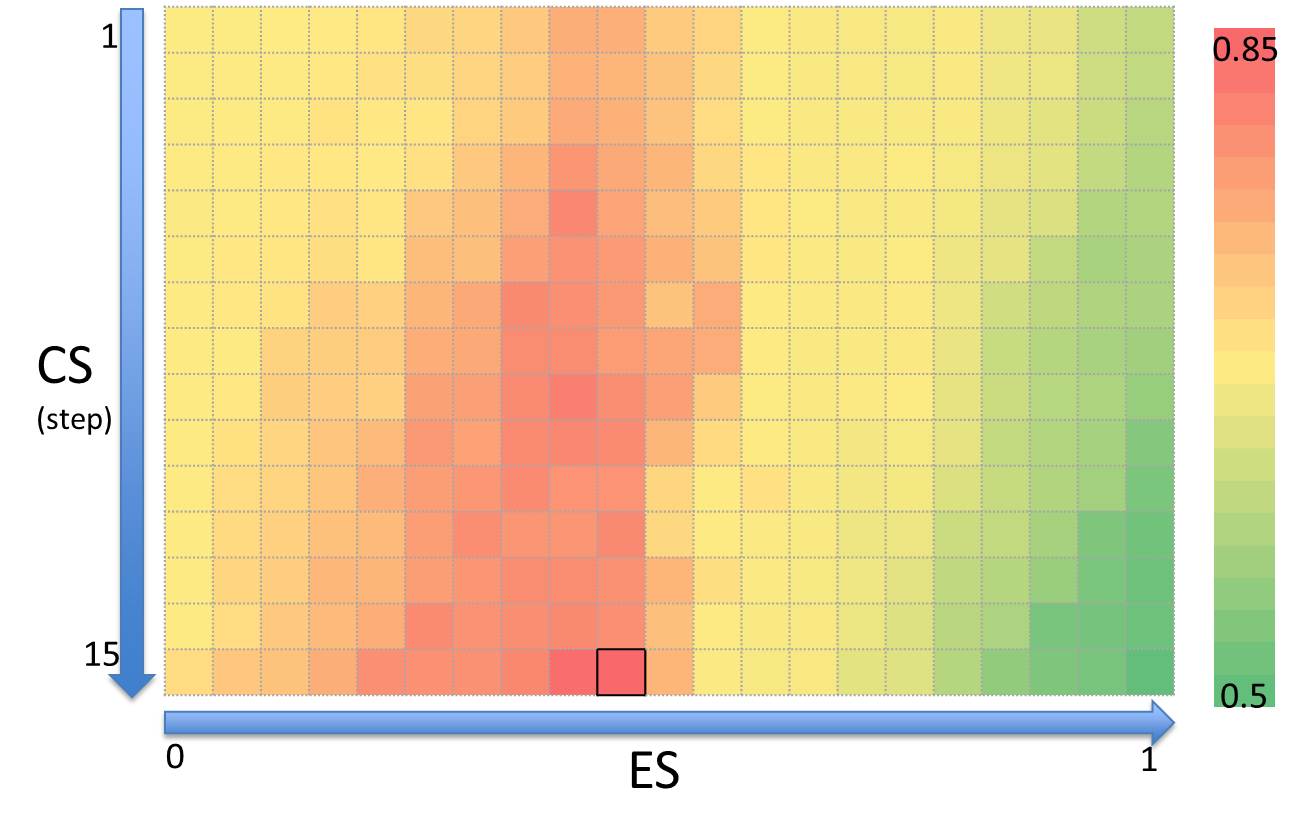
The
maps of area under receiver operating characteristic curve from different masks for predicting patients with mild cognitive
impairment.
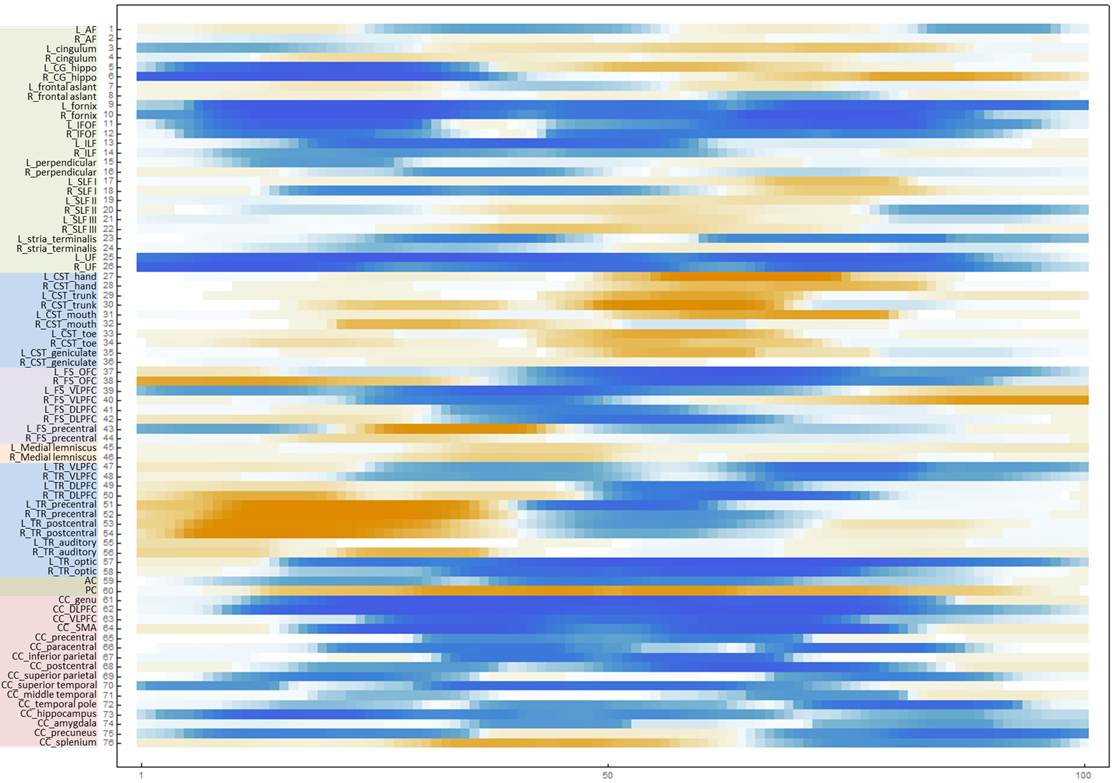
The
heat map generated by accumulating the masks with highest area under receiver operating characteristic curve for predicting mild cognitive impairment from 200 examinations.