1801
Robust identification of rich-club organization in weighted and dense structural connectomes1Florey Institute of Neuroscience and Mental Health, Melbourne, Australia
Synopsis
Rich-club organizations, characterizing the higher-level topology of the brain network, has been commonly identified from structural connectomes constructed using DTI based on network degrees. This analysis can however be compromised by the following issues: (i) DTI limitations in resolving crossing-fibers; and (ii) the original degree-metric based approach is unsuitable for highly-connected connectomes, because it leads to nodes with indistinguishably high degrees. Importantly, increasing evidence suggests that brain connectomes could be very dense. To address these issues, we propose a robust framework by: (i) applying advanced-tractography to construct connectomes; and (ii) developing a h-degree based method, RICHER, to identify rich-club organization.
Purpose
Rich-club organizations can be identified from structural connectomes constructed using DTI, characterizing the higher-level topology of the brain-network1. This analysis can however be compromised by the following issues:(i) DTI limitations in resolving crossing-fibers2; (ii) the original degree-metric based rich-club approach1 is unsuitable for highly-connected connectomes, because it leads to nodes with indistinguishably high degrees. Increasing evidence suggests that brain connectomes could be very dense3,4. To address these issues, we propose a robust framework by: (i) applying advanced tractography (AT) to construct connectomes with improved quantitative features5,6; and (ii) developing a method, Rich-club organization Identification using Combined H-degree and Effective strength to h-degree Ratio (RICHER), to identify rich-club organizations suitable even for the case of dense networks.Methods
Rich-club organization is commonly defined based on the degree-metric, as a tendency for high-degree nodes to be more densely interconnected between one another than low-degree nodes (the RC-degree approach)1. Since degree-metric is no longer informative in highly-connected networks, an equivalent definition of rich-club organization is proposed: any rich-club member within the network always has greater effective unit strength (i.e. total-strength (S, i.e. tracking counts) divided by total number of potential rich-club members (N)) to other rich-club members than to non-rich-club members, formulated as $$$\forall n \in RC$$$, $$$ \frac {S_w/N_{RC}}{S_b/N_{NRC}} = \frac {\sum p\in RC S_{n,p}/N_{RC}}{\sum q\in NRC S_{n,q}/N_{NRC}}>1 $$$, $$$(RC:rich-club,NRC:non-rich-club,w:within,b:between)$$$.
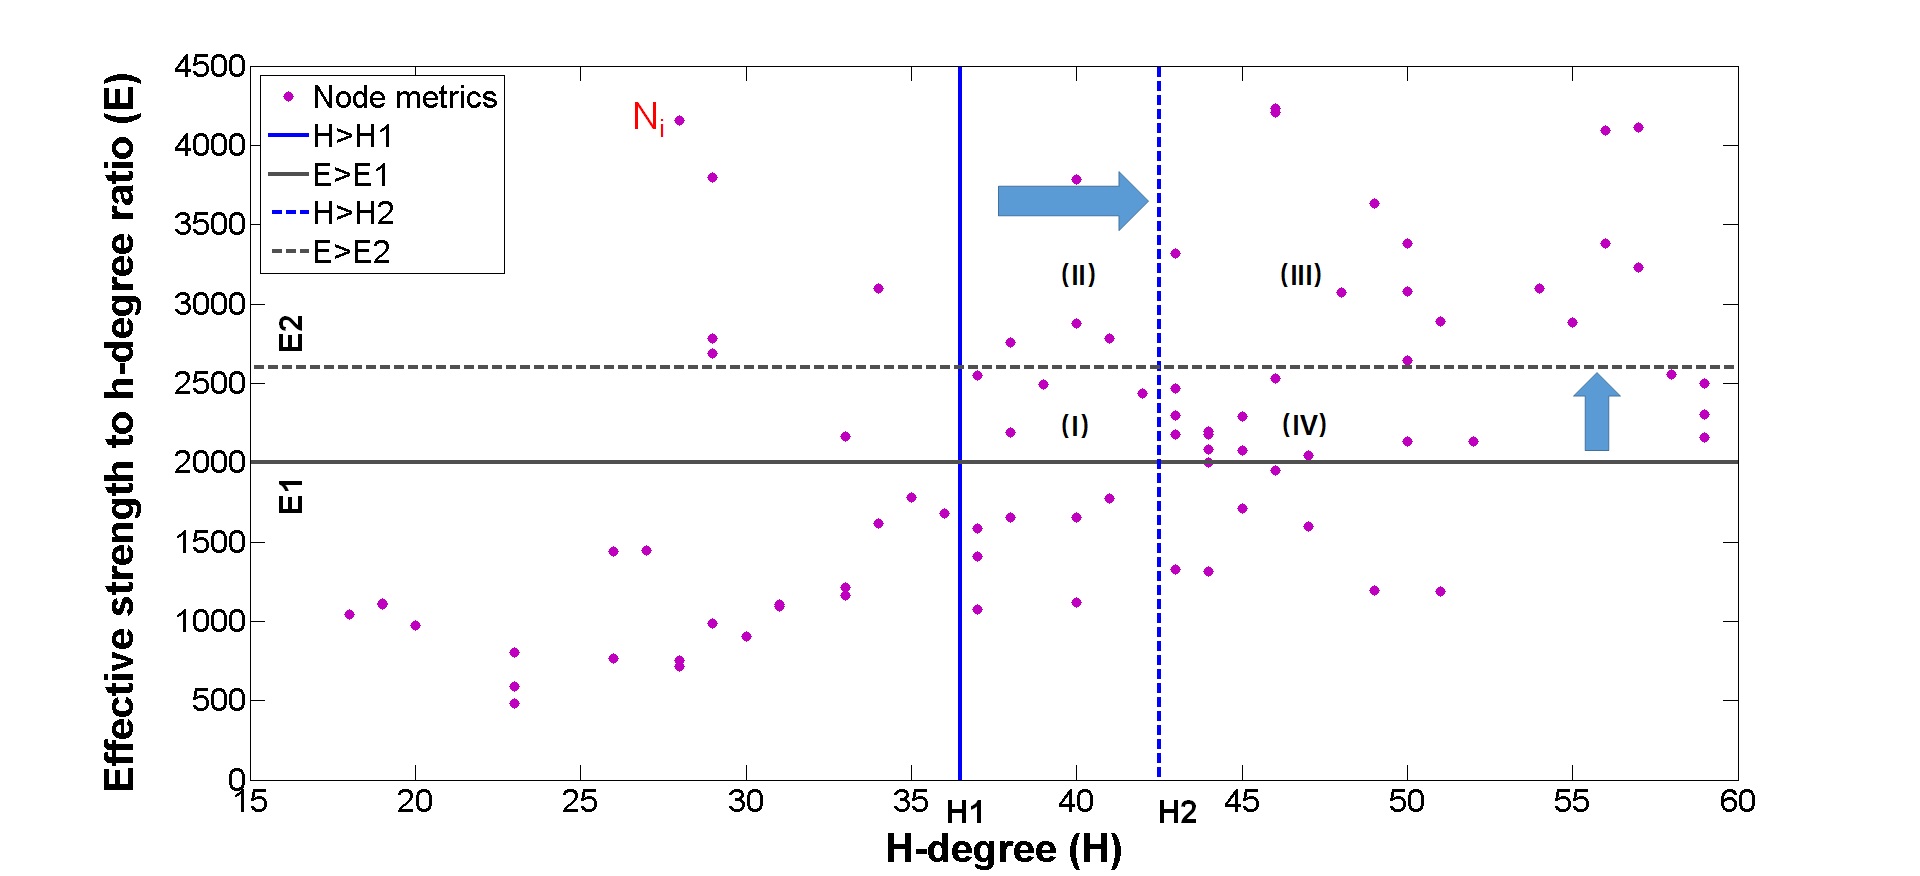
Two network-metrics, h-degree7,8 H(i) and effective strength (S) to h-degree ratio, $$$E(i)=S(i)/H(i)$$$, are employed in RICHER. Across all preset searching-regions (i.e. area confined by H and E that contains rich-club candidates, see Figure 1), the initial search starts from around the median value for H and E. The searching-region is iteratively shrunk (by increasing the H and E thresholds), until R>1 for all members in the searching-region –Note that a rich-club organization must not contain any node with $$$R \in (0,1] $$$. Following this rule, once a rich-club organization is identified, the searching process stops and all nodes having R>1 are identified as rich-club members. In addition, an iterative rescaling approach (i.e.$$$[Min,Max]->[1,Max]$$$ ) is proposed to prevent h-degree from degrading to degree (e.g. when strength of each edge is larger than associated degree), ensuring the median strength remains within the middle part of node degree range (see Figure 1 legend).
Data Acquisition: Anatomical and diffusion MR images (dMRI) of 22 heathy subjects were acquired using a Siemens 3T Trio scanner.
Tractogram reconstruction: Fiber tracking was carried out using MRtrix, with 2 different tracking strategies: (a) a probabilistic streamlines approach based on CSD9+ACT5+SIFT6 (AT approach); (b) DTI+FACT10 (DT approach).
Connectome construction: T1-based FreeSurfer parcellation of grey matter (82-node)11.
Connectome analyses:
(a) rich-club organization: RICHER and RC-degree1 were applied to the 4 connectomes, corresponding to 2 tracking × 2 connectome group averaging (selective-averaging (SelAv)1 and direct-averaging (DirAv)).
(b) Statistical significance: 1000 random networks1 were applied with RICHER and RC-degree. The level of significance value is calculated as p=n/1000, with n the number of rich-club organization detected.
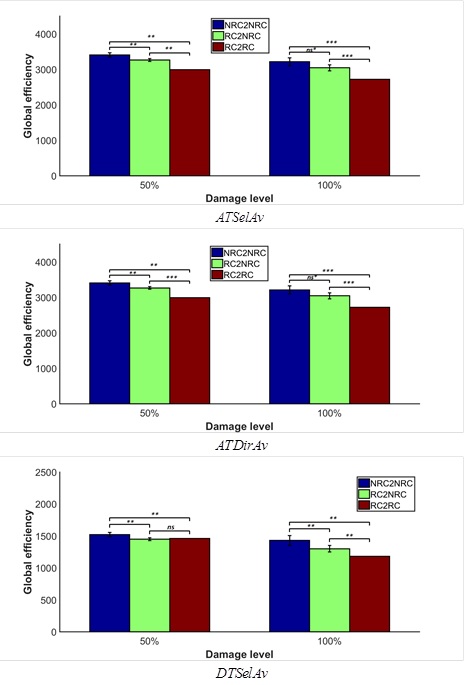
(c) Simulation of network attack: Global efficiency (GE) was computed at 3 types of simulated network attacks1: (i) Random attacks to connections between non-rich-club (NRC) regions (NRC2NRC); (ii) random attacks to hub connections between rich-club (RC) and non-rich-club regions (RC2NRC); and (iii) targeted attacks to connections between rich-club regions (RC2RC). Two damage-levels were simulated. For each damage-level, 1000 samples were generated by randomly attacking network edges while the total weight of damaged edges for NRC2NRC and RC2NRC matched that for RC2RC; otherwise, no random samples were generated. Permutation-tests were conducted to test statistical significance of GE decrease.
Results
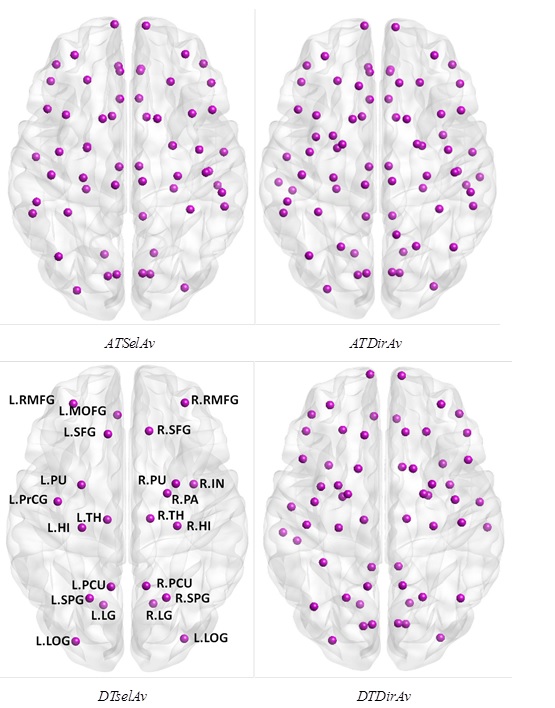
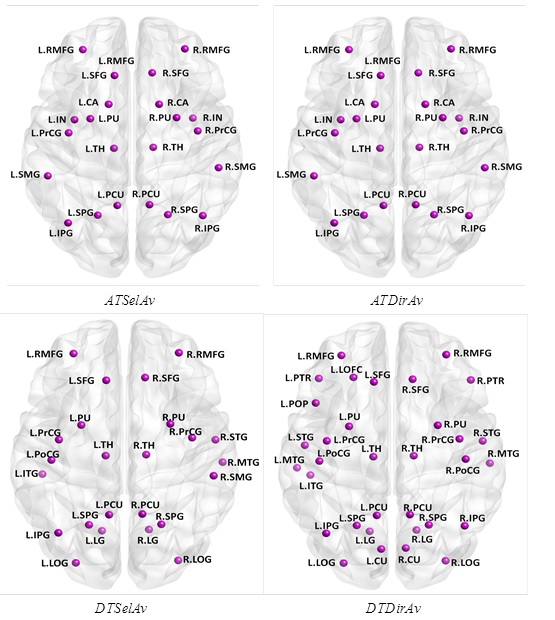
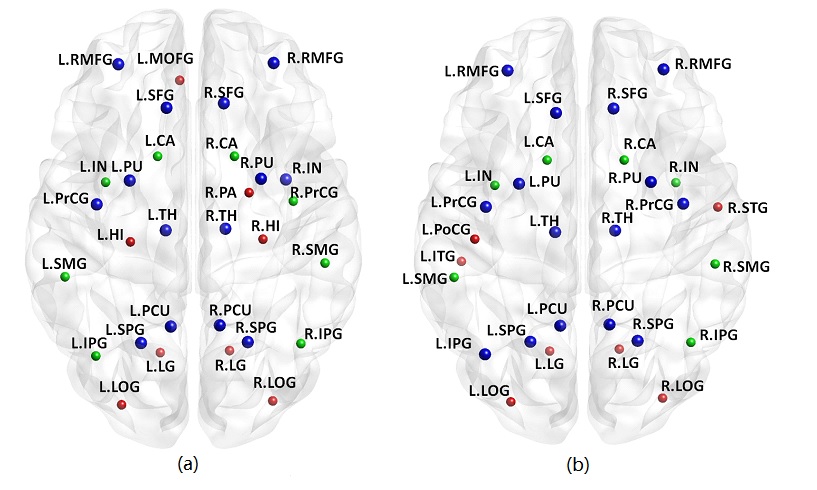
Connectomes for ATSelAv, ATDirAv and DTDirAv are very dense $$$ (81\%, 88\%,78\%) $$$, with over half of the 82 brain regions identified as rich-club members using RC-degree (Figure 2). Figure 3 shows the identified rich-club organization using RICHER from the 4 connectomes, while Figure 4 shows the effect of method to compute rich-club organization and group-averaging strategy: (1) DTSelAv+RC-degree vs. ATSelAv+RICHER (Figure 4(a)); (2) DTSelAv+RICHER vs. ATSelAv+RICHER (Figure 4(b)). Significant GE reductions were detected at 2 damage-levels using RICHER (Figure 5). In contrast, no significant GE reductions were detected using RC-degree (Data not shown).Discussion
It has been progressively accepted that brain connectomes could be very dense3,4. We show that the widely-used method for identifying rich-club organization based on degree (RC-degree) from such densely-connected networks is not meaningful. Our results show that RICHER can identify rich-club organization from dense and sparse networks. Network attack simulations corroborated the validity of RICHER in identifying rich-club organization. Overall, we have demonstrated that rich-club organizations can be reliably identified from dMRI data by combining AT and RICHER.Acknowledgements
No acknowledgement found.References
1. van Den Heuvel, M. P. & Sporns, O. 2011. Rich-club organization of the human connectome. J Neurosci, 31, 15775-86.
2. Tournier, J. D., Mori, S. & Leemans, A. 2011. Diffusion tensor imaging and beyond. Magn Reson Med,65, 1532-56.
3. Markov, N. T., Ercsey-Ravasz, M., Lamy, C., et al. 2013a. The role of long-range connections on the specificity of the macaque interareal cortical network. Proc Natl Acad Sci U S A, 110, 5187-92.
4. Yeh C. H., Smith, R. E., Liang, X., et al. 2016. Correction for diffusion MRI fibre tracking biases: The consequences for structural connectomic metrics. Neuroimage, doi:10.1016/j.neuroimage.2016.05.047. 5. 5. Smith, R. E., Tournier, J. D., Calamante, F. & Connelly, A. 2012. Anatomically-constrained tractography: improved diffusion MRI streamlines tractography through effective use of anatomical information. Neuroimage, 62, 1924-38.
6. Smith, R. E., Touenier, J. D., Calamante, et al. 2013. SIFT: Spherical-deconvolution informed filtering of tractograms. Neuroimage, 67, 298-312.
7. Hirsch, J. E. 2005. An index to quantify an individual's scientific research output. Proceedings of the National Academy of Sciences of the United States of America, 102, 16569-16572.
8. Zhao, S. X., Rousseau, R. & Ye, F. Y. 2011. h-Degree as a basic measure in weighted networks. Journal of Informetrics, 5, 668-677.
9. Tournier, J. D., Calamante, F. & Connelly, A. 2007. Robust determination of the fibre orientation distribution in diffusion MRI: non-negativity constrained super-resolved spherical deconvolution. Neuroimage, 35, 1459-72.
10. Mori S., Crain, B. J., Chacko, et al. 1999. Three-dimensional tracking of axonal projections in the brain by magnetic resonance imaging. Ann Neurol, 45, 265-9.
11. Desikan R.S., Segonne F., Fischl B. et al. 2006. An automated labeling system for subdividing the human cerebral cortex on MRI scans into gyral based regions of interest. NeuroImage, 31:968-80.
Figures