1800
Low Rank plus Sparse Decomposition of ODF Distributions: Whole brain Statistical Analysis of Higher Order Diffusion Datasets1Center for Advanced Imaging Innovation and Research (CAI2R), NYU School Of Medicine, New York, NY, United States, 2Center for Biomedical Imaging, Dept of Radiology, NYU School Of Medicine, New York, NY, United States
Synopsis
Recent advances in data acquisition make it possible to use
Purpose
Higher Angular Resolution Diffusion Imaging (HARDI) methods, such as Diffusion Spectrum Imaging (DSI[1]) and multishell Q-ball imaging[2] are robust tools for non-invasive imaging of in vivo white matter architecture. These methods capture the complex intravoxel crossings[1,3] through the synthesis of Orientation Distribution Functions (ODFs). Recent improvements in sequence acquisition times[4,5,6] have made HARDI a routine viable, and practical tool for clinical applications and neuroscience research. This evolution has highlighted the need for a robust methodology for statistical analysis of group ODF datasets. Often, whole brain statistical analysis focuses on connectivity matrices, either locally[7] or globally[8,9]. In some approaches, the tractograms also inform tract-specific smoothing[9] and enhancement of statistical maps along the tracts[7,9] using Threshold-Free Cluster Enhancement approaches (TFCE[10]). Whilst these tractography based methods are powerful, they suffer from problems related to imperfections in the tractography approach[11] and, by focusing on the identified fiber directions, they might discard subtle differences captured in the ODFs.
A promising ODF statistical analysis method is the voxelwise whole brain analysis of ODFs[12] based on Principal Component Analysis (PCA), though this method suffers from outliers and individual variability. In this work, we present the application of a novel approach for isolating ODF features that are common/different between subject cohorts from subject-specific variance via the Low-Rank plus Sparse (L+S) Matrix Decomposition[13,14,15]. We illustrate this approach by replicating the established association between global white matter integrity and physical obesity[7,16] in the Human Connectome Project dataset.
Methods
Structural (MPRAGE, 1mm isotropic, TR/TE=2400/2.14ms, 2xGRAPPA) and Diffusion (monopolar gradient pulse sequence, 270 q-space samples on three shells, b=1000,2000,3000 s/mm$$$2$$$, TR/TE=5500/89.50ms, 1.25mm isotropic, simultaneous multi-slice acceleration of 3[5]) MRI datasets were downloaded in preprocessed format from the HCP consortium led by Washington University, University of Minnesota, and Oxford University[17] (acquisition on a Siemens 3T Skyra with 100mT/m gradients). We selected the first 144 subjects from the December 2015 release for group analysis (64/80 male/female, age 28.5±4.0, BMI26.3±5.0). Diffusion reconstructions are performed in native subject space using Generalized Q-sampling Imaging reconstruction (GQI[18], implemented in Matlab). Spatial normalization transformations were calculated by the stepwise registration of the subject MPRAGE to the $$$T_1$$$-weighted MNI-152-atlas[19], as included in FSL, and the registration of the subjects diffusion images to the subjects MPRAGE. The calculated transformations were then later applied to the reconstructed diffusion datasets. Both registrations and transformations are performed using elastix and transformix[20]. Images were generated using Matlab and DSI Studio[18]. For tractography, a modified streamline tracking algorithm was used (DSI Studio).
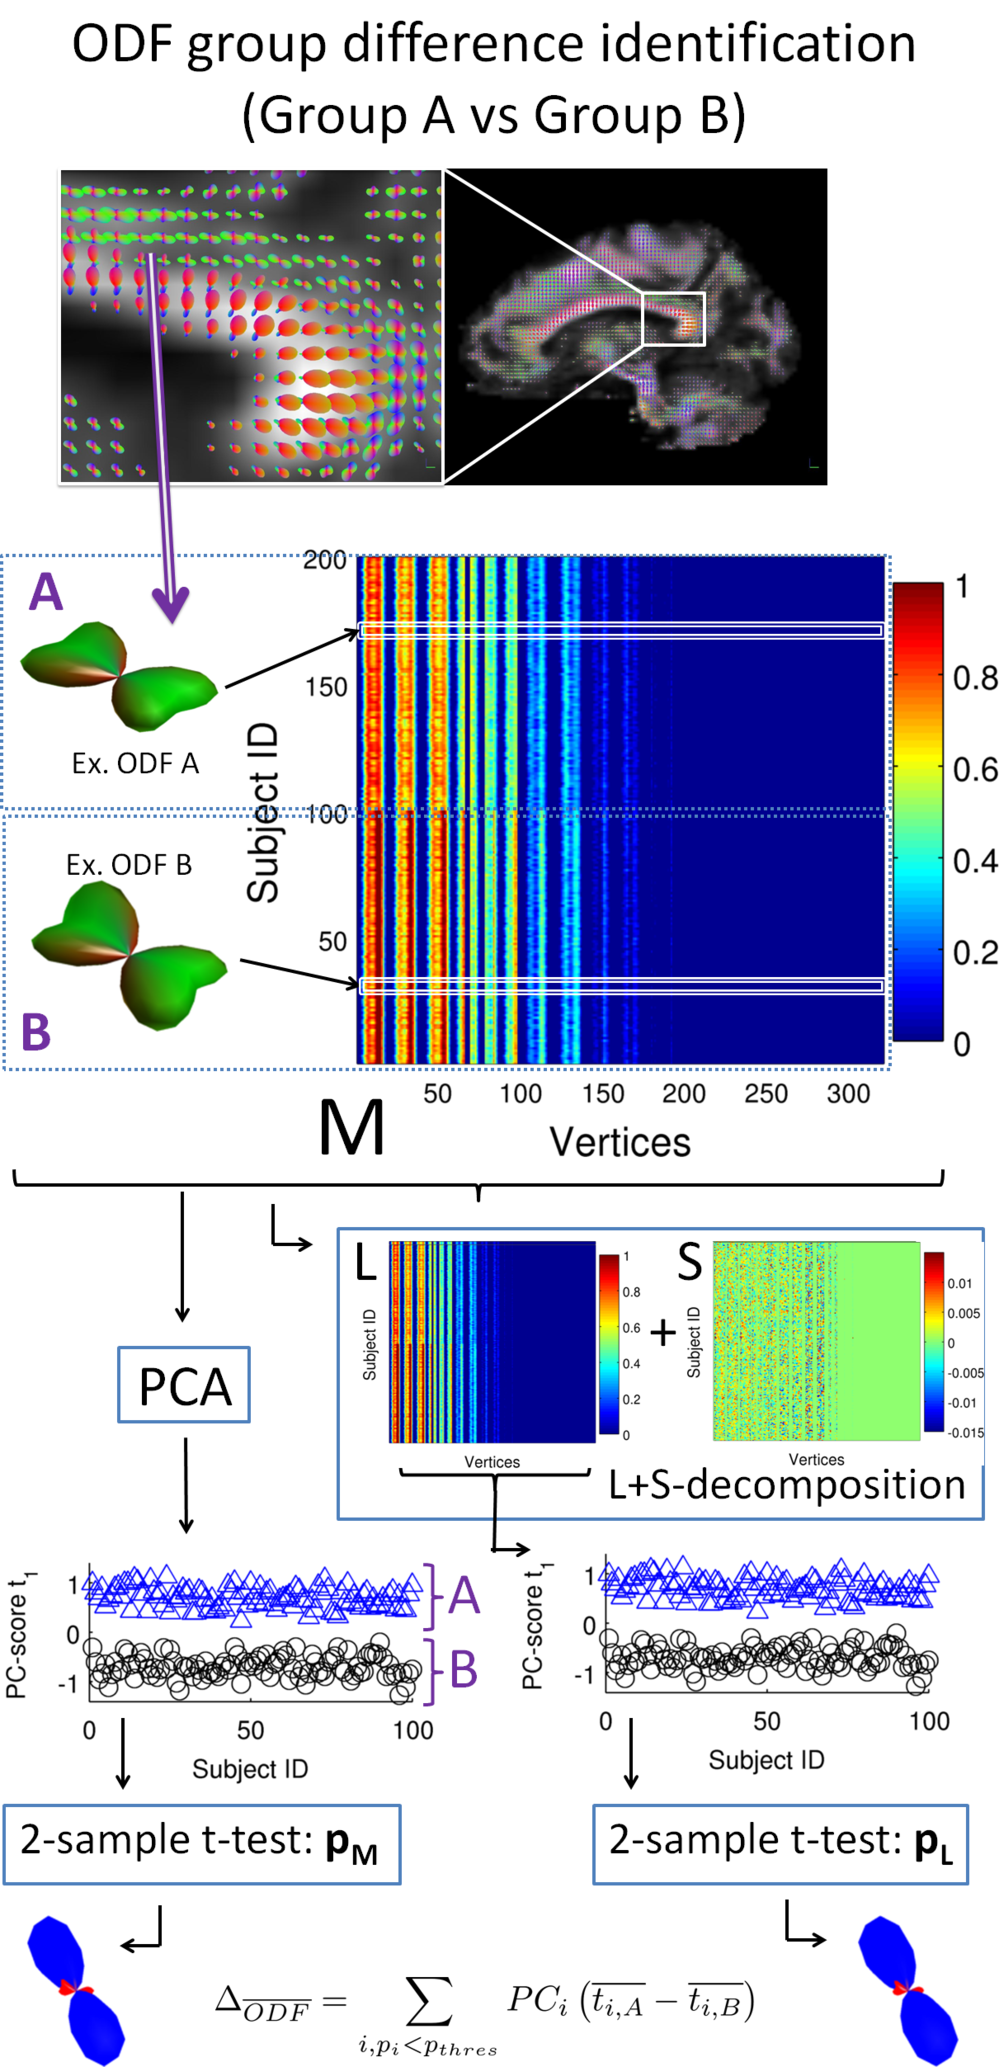
For statistical analysis the registered ODFs of each voxel are reorganized in a matrix M (1 ODF per row, Fig 1) and M is decomposed in a Low-Rank matrix L and a Sparse matrix S[13,14,15]$$\text{minimize}\,\,||L||_*+\lambda||S||_1\\\text{subject to}\,\,L+S=M$$using the Alternating Directions algorithm with $$$||\cdot||_*$$$ the nuclear norm, $$$||\cdot||_1$$$ the $$$l_1$$$-norm and $$$\lambda = 1/\sqrt(n)$$$ a universal choice for the trade-off between L and S (with n the size of the largest dimension of the matrix M). This decomposition estimates ODF features common/different within/between groups by minimizing the rank of L, whilst separating the sparse individual variability and outliers in S (Fig 1). The Principal Component (PC) scores of L are then used as input for statistical tests to evaluate group ODF differences or relationships of ODF features (Principal Components $$$PC_i$$$) with independent variables (in this abstract, BMI, age and sex). For whole-brain statistics, multiple comparisons are corrected with the Threshold-Free Cluster Enhancement Method (TFCE[10]).
When observing significant group differences between PC-scores $$$t_{i,j}$$$ of groups A and B or relations ($$$r_i$$$ with $$$p_i<p_{thres}$$$) of ODF features $$$PC_i$$$ with independent variables, we can calculate difference ODFs $$\Delta_{ODF}=\sum\limits_{i,p_i<p_{thres}}PC_i\left(\frac{1}{n_A}\sum_{j \in A}{t_{i,j}}-\frac{1}{n_B}\sum_{j\in B}{t_{i,j}}\right)$$ of correlation ODFs $$$R_{ODF}=\sum\limits_{i,p_i<p_{thres}}PC_ir_i$$$ respectively.
Results and Discussion
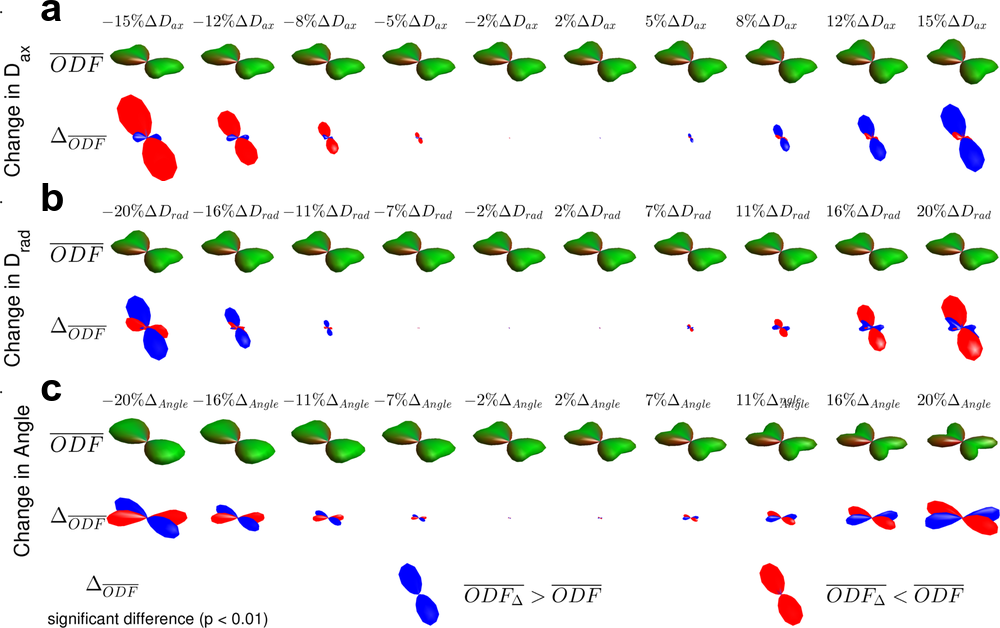
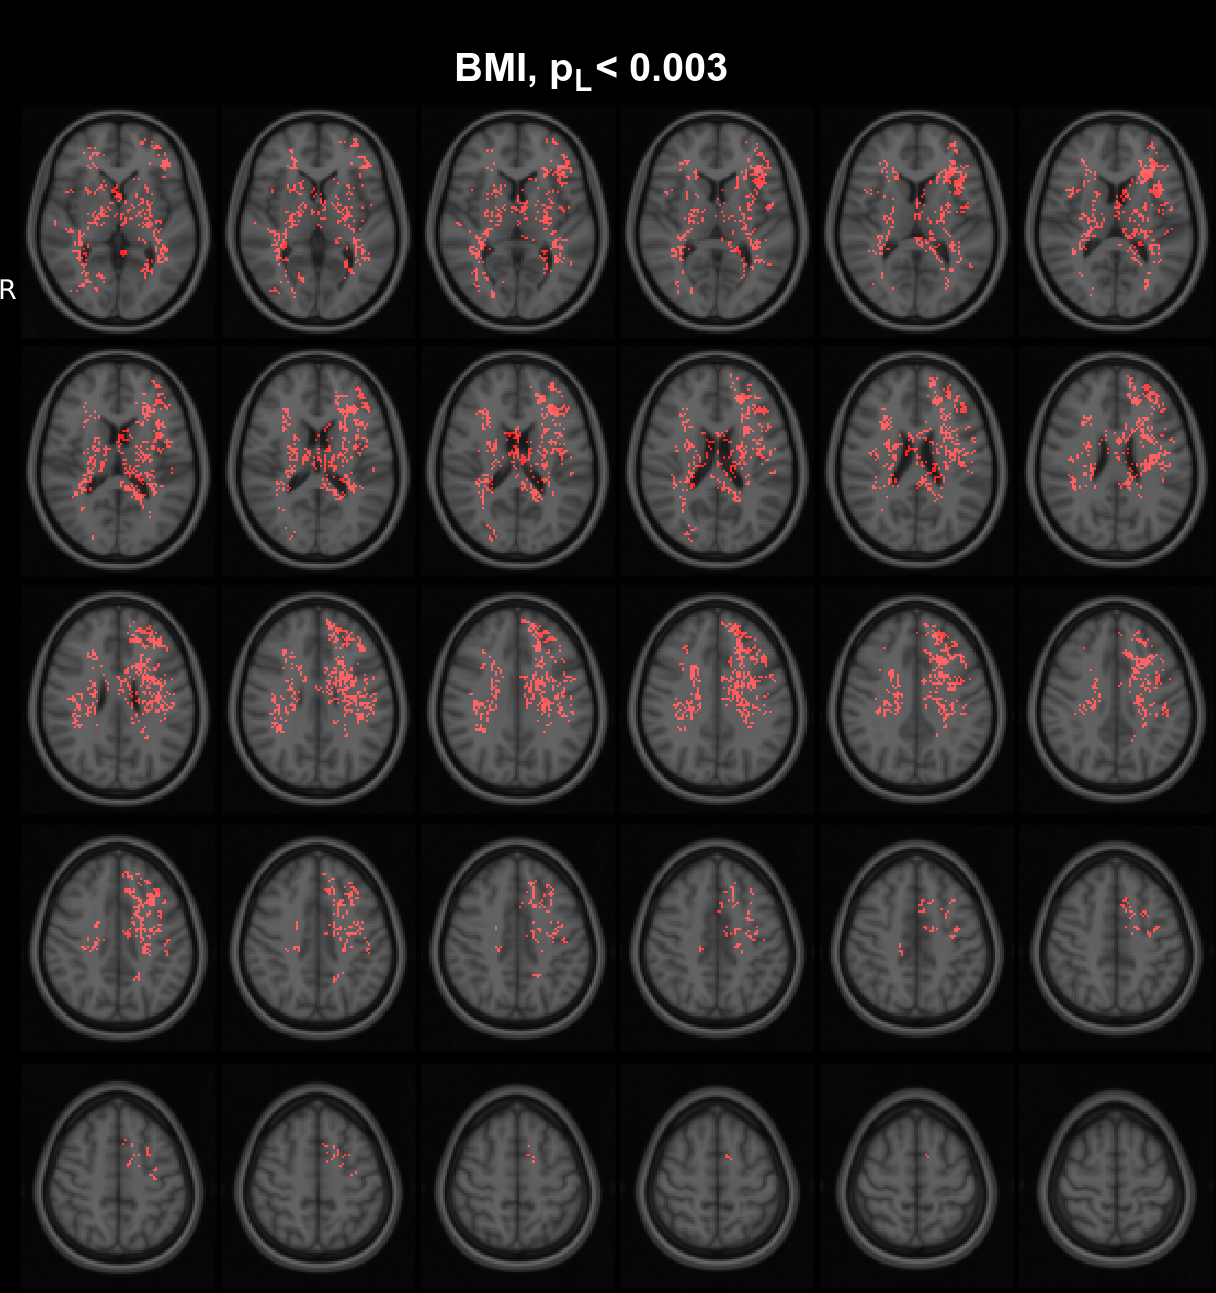
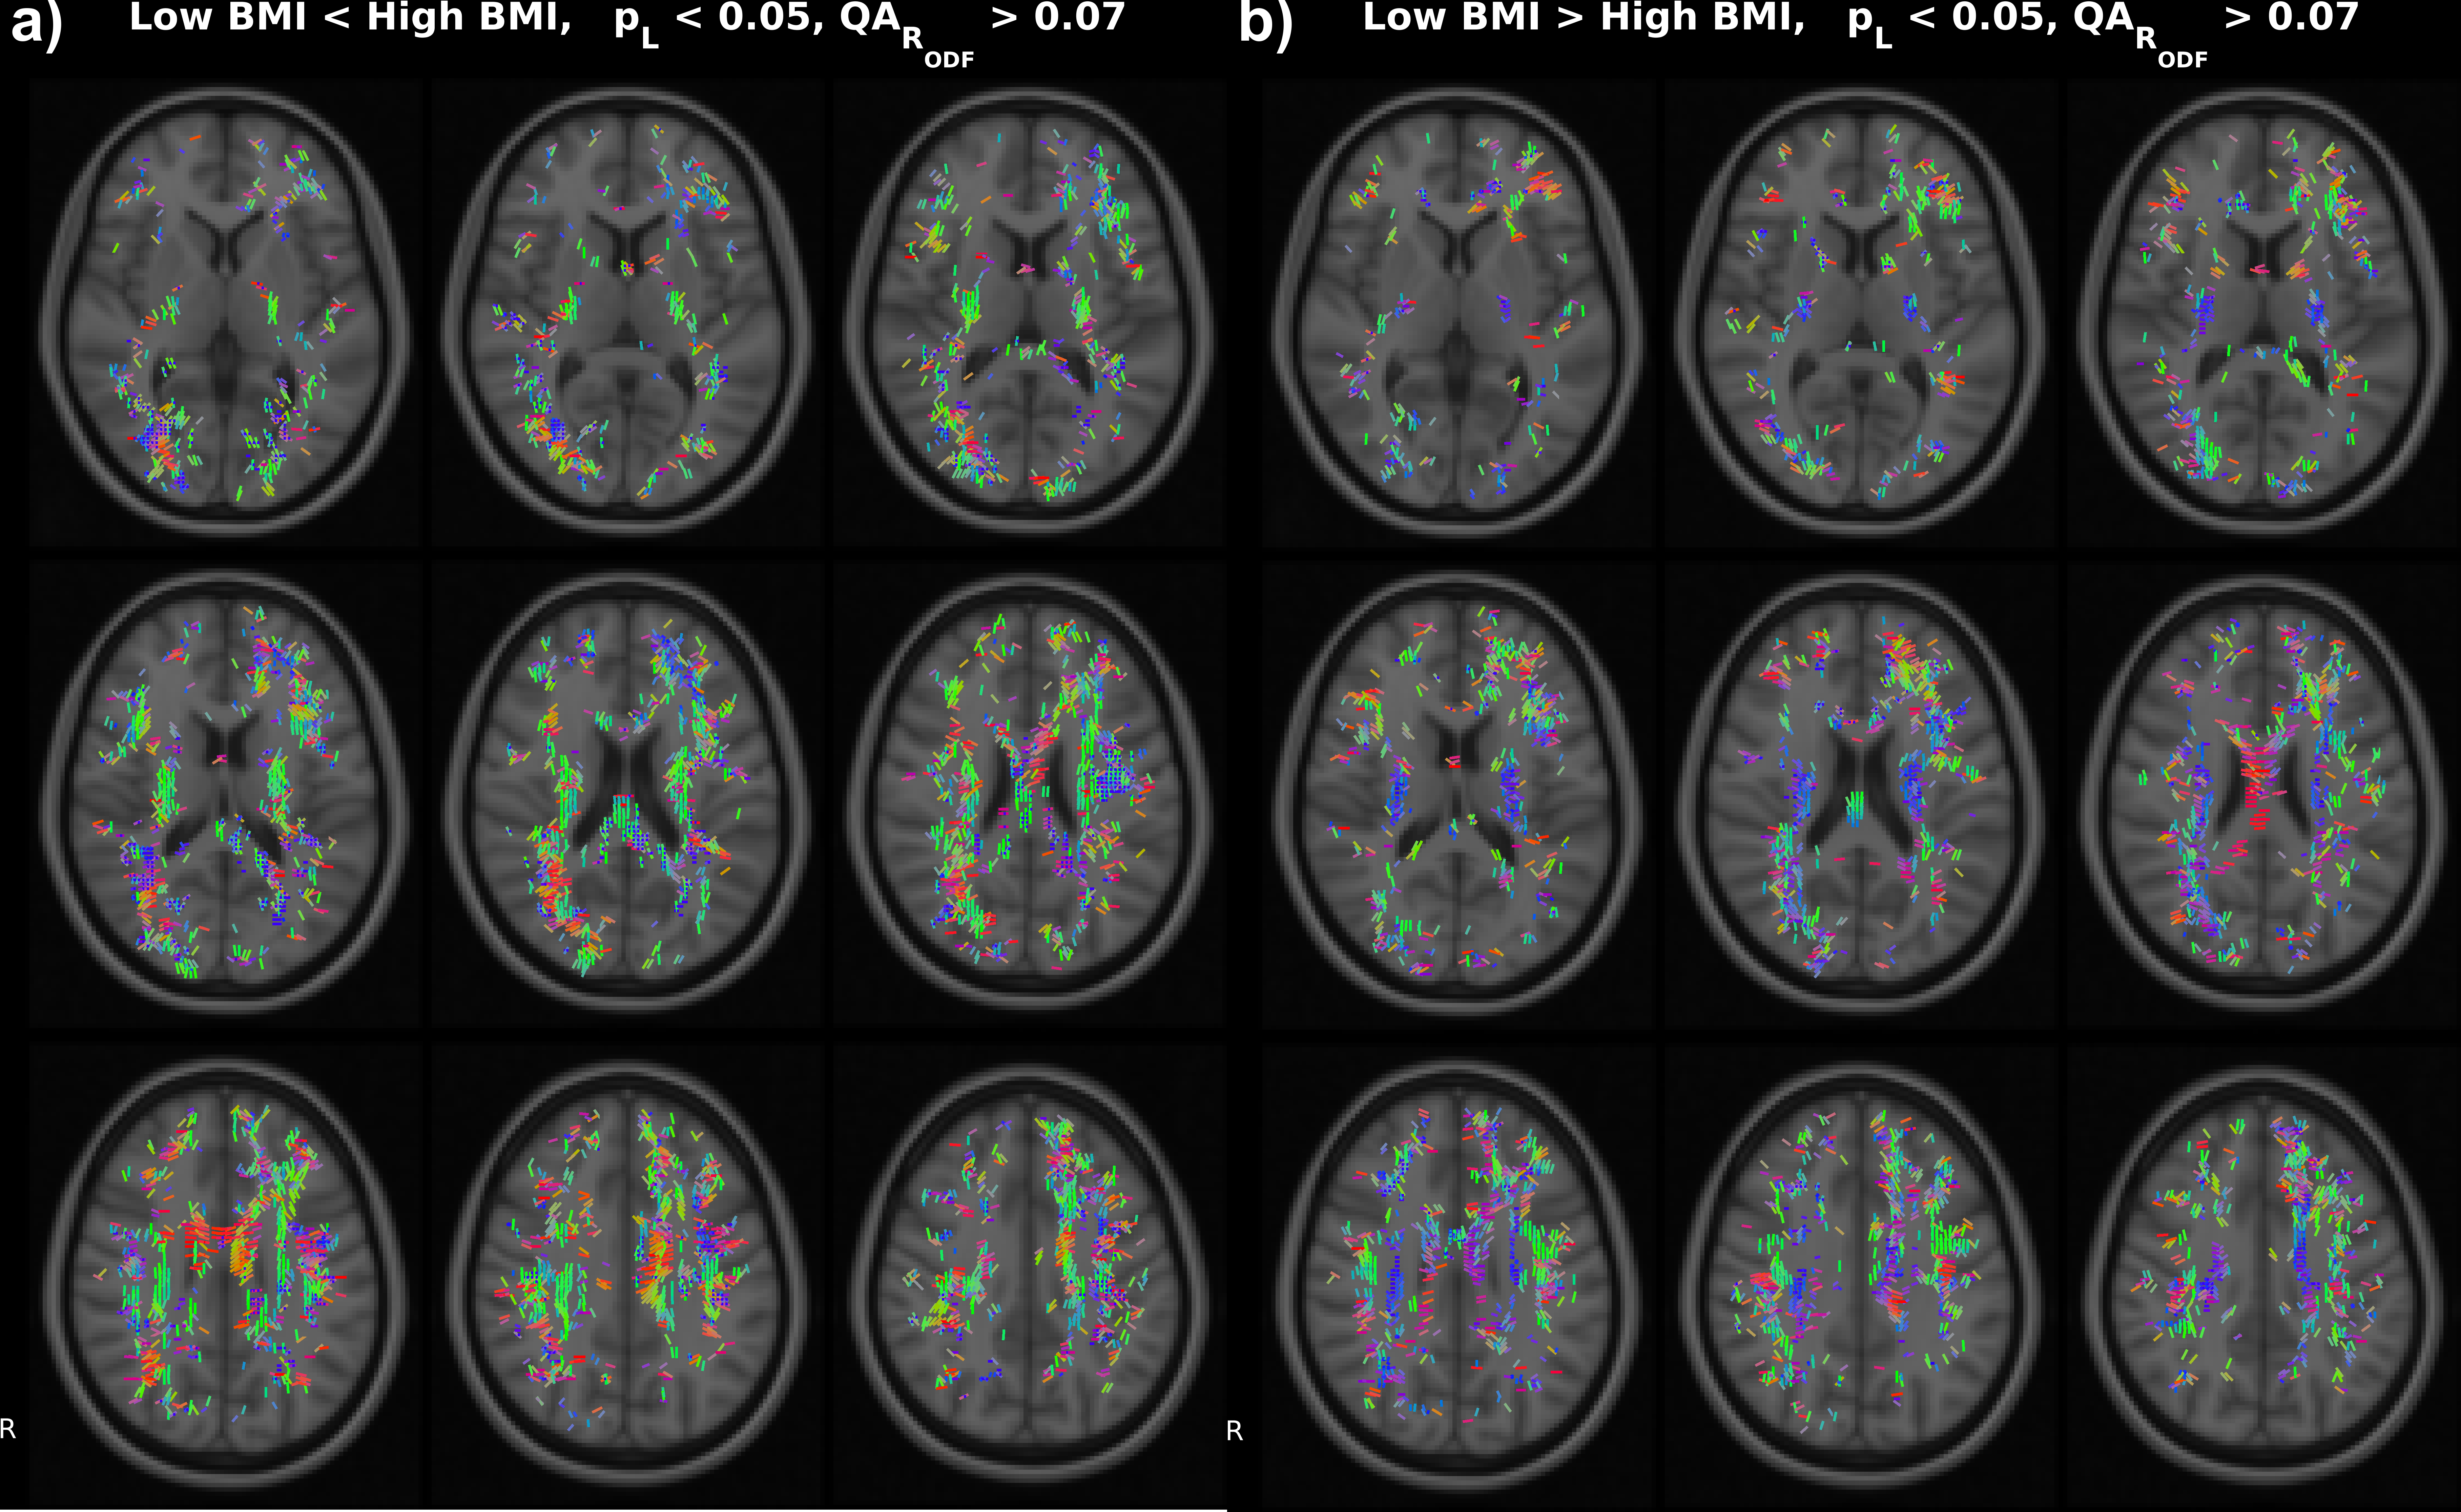
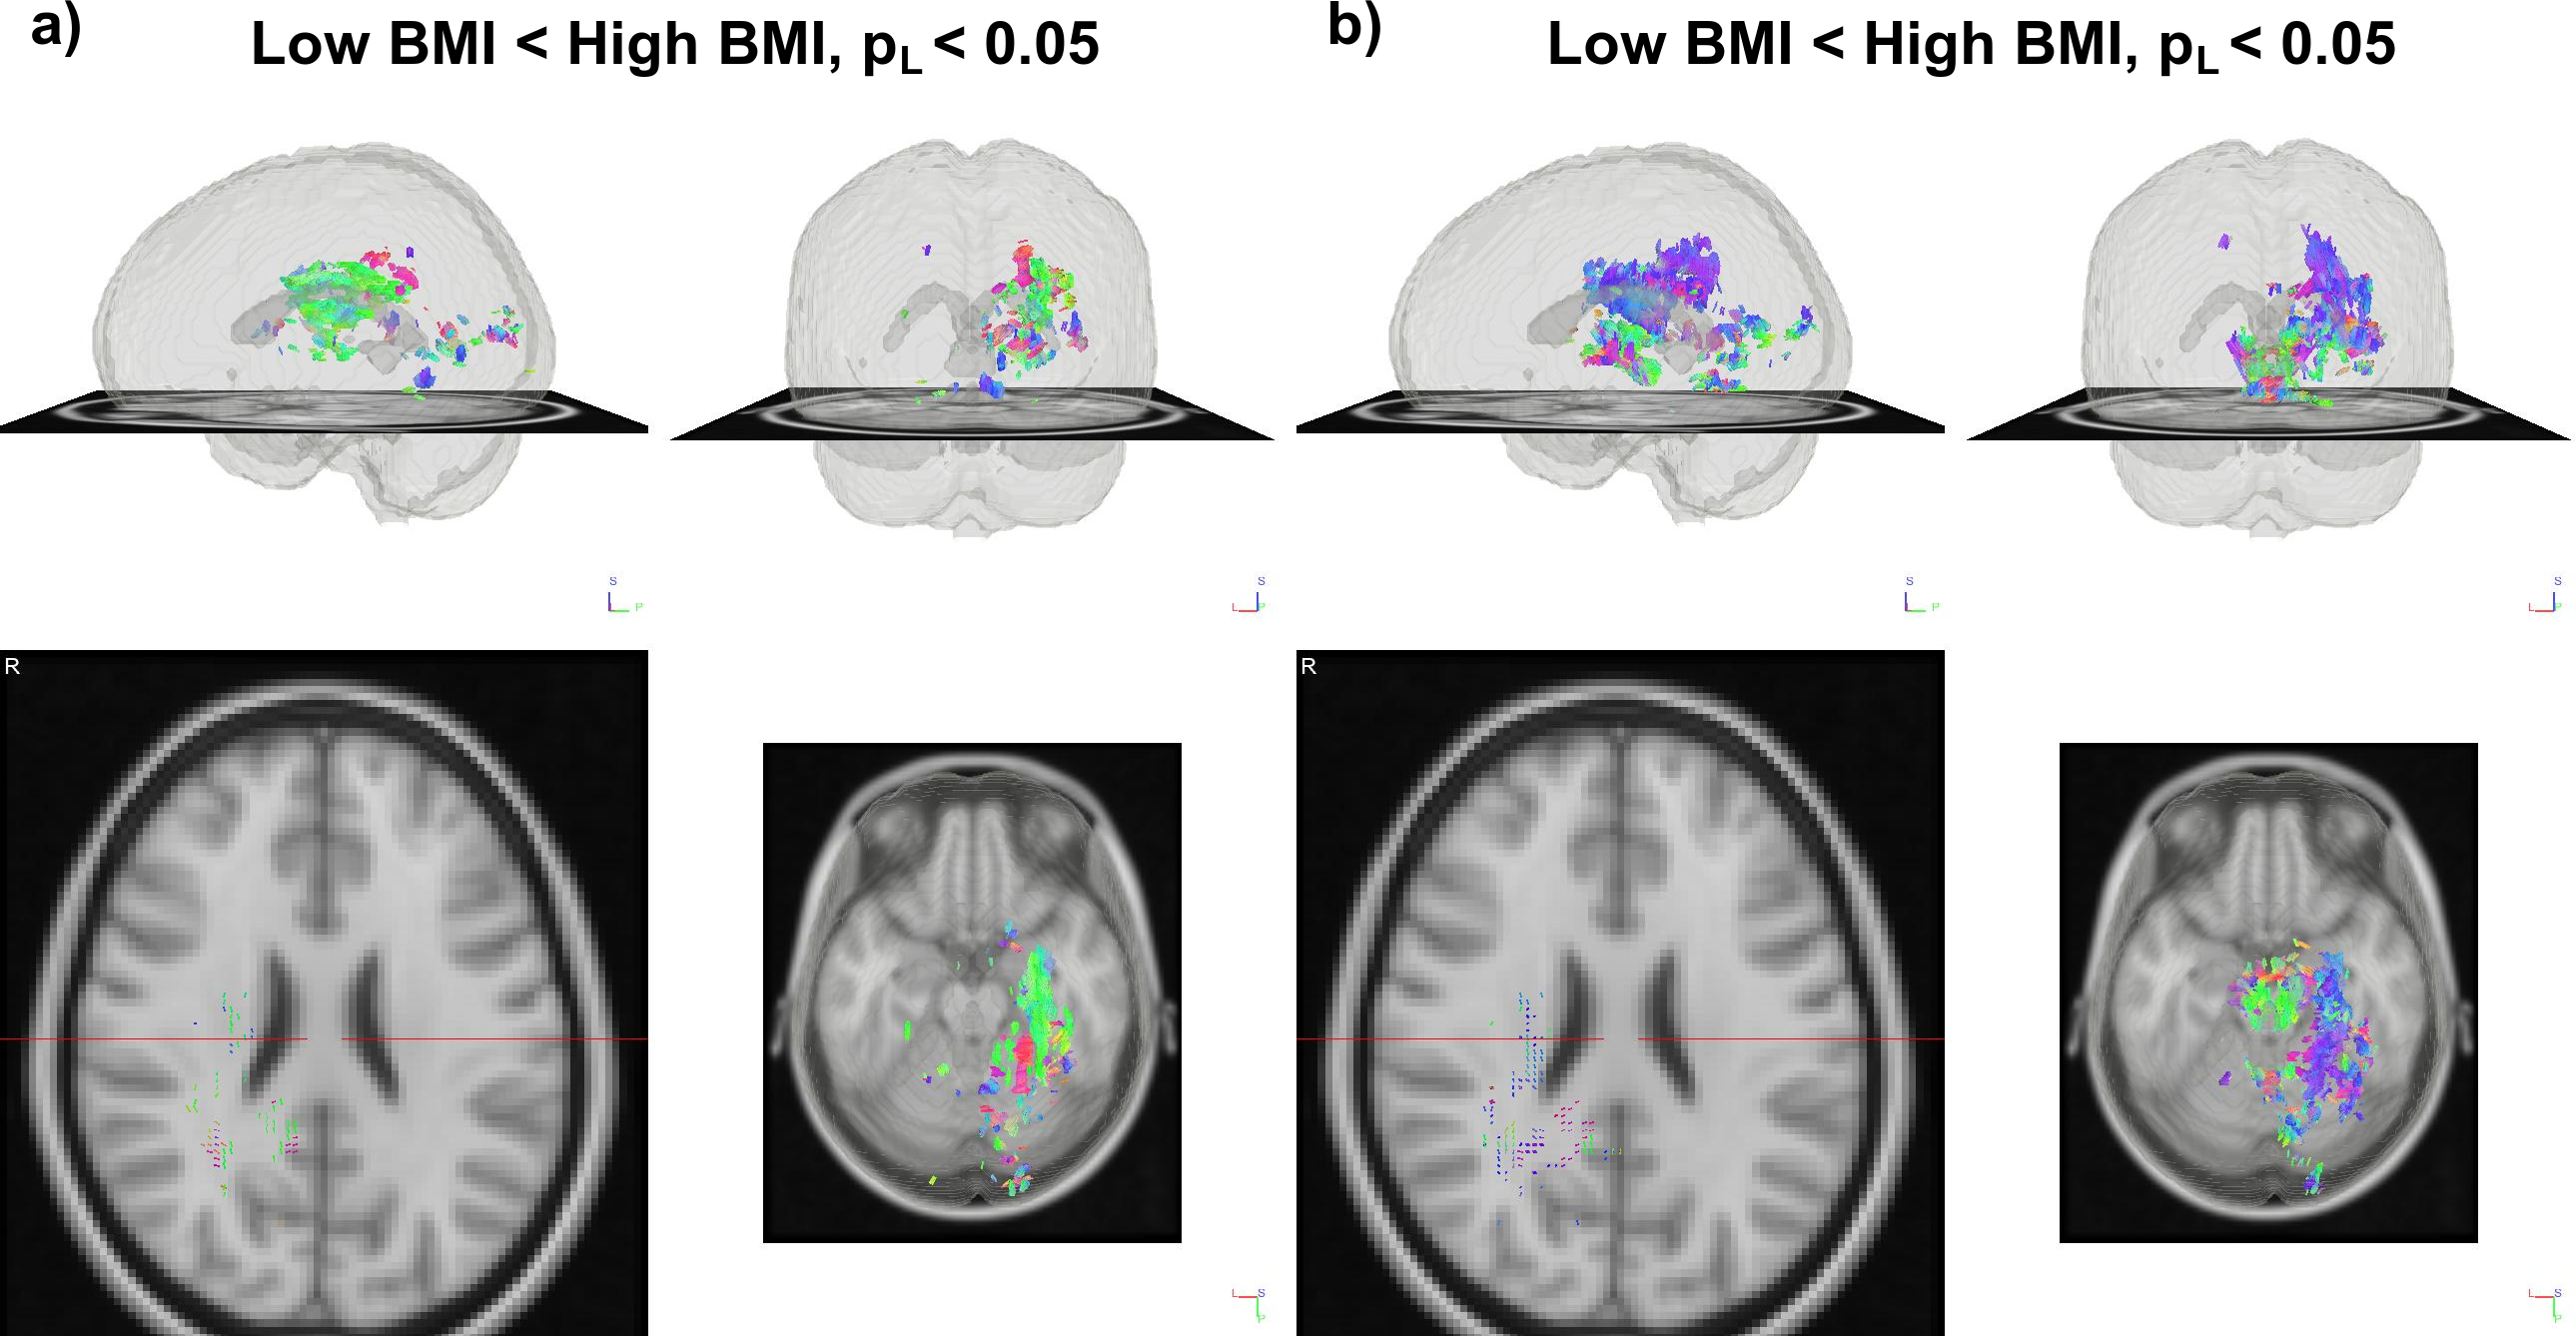
Simulations (Fig. 2) illustrate the ability of the proposed method to pick up small group differences while the $$$\Delta_{ODF}$$$ provide visual interpretation of the results. Numerous significant differences are found as expected (Fig 3) in the whole-brain statistical analysis of the association between BMI and the ODFs. Differences are robustly identified in the analysis of isolated ODF features (L) (Fig 3). Correlation ODFs $$$R_{ODF}$$$, the derived fiber directions (Fig 4) and tractography results (Fig 5) illustrate the white matter tracts which are negatively associated with BMI.Conclusion
L+S-decomposition can improve the separation of key ODF features in large HARDI datasets from individual variability and outliers. These methods could aid with the whole-brain statistical analysis of group differences and correlations with independent variables in neuroscience applications.Acknowledgements
This project is supported in part by PHS Grants R01CA111996, R01NS082436 and R01MH00380. Data were provided in part by the Human Connectome Project, WU-Minn Consortium (Principal Investigators: David Van Essen and Kamil Ugurbil; 1U54MH091657) funded by the 16 NIH Institutes and Centers that support the NIH Blueprint for Neuroscience Research; and by the McDonnell Center for Systems Neuroscience at Washington University.References
[1] Wedeen, V.J. (2012), ‘The geometric structure of the brain fiber pathways’, Science, vol. 335, pp. 1628-34.
[2] Tuch, D.S. (2004), ‘Q-ball imaging’, Magn. Reson. Med., vol. 52, pp. 1358-72.
[3] Fernandez-Miranda, J.C. (2012), 'High-Definition Fiber Tractography of the Human Brain: Neuroanatomical Validation and Neurosurgical applications', Neurosurgery, vol. 71, pp. 430-453.
[4] Setsompop, K. (2012), ‘Blipped-Controlled Aliasing in Parallel Imaging for Simultaneous Multislice Echo Planar Imaging With Reduced g-Factor Penalty’, Magn. Reson. Med., vol. 67, pp. 1210-1224.
[5] Sotiropoulos, S.N. (2013), ‘Effects of Image Reconstruction on Fiber Orientation Mapping From Multichannel Diffusion MRI: Reducing the Noise Floor Using SENSE’, Magn. Reson. Med., vol. 70, pp. 1682-1689.
[6] Baete, S (2015), 'Fast, whole brain Radial Diffusion Spectrum Imaging (RDSI) via Simultaneous Multi Slice Excitation', Proc. Intl. Soc. Magn. Reson. Med., vol 22, p2539.
[7] Yeh, F-C. (2015), 'Connectometry: A statistical approach harnessing the analytical potential of the local connectome', NeuroImage, vol 125, pp. 162-171.
[8] Jahanshad, N. (2015), 'Seemingly unrelated regression empowers detection of network failure in dementia', Neurobiology of Aging, vol. 36, pp. S103-12.
[9] Raffelt, D.A. (2015), ‘Connectivity-based fixel enhancement:Whole-brain statistical analysis of diffusion MRI measures in the presence of crossing fibres’, NeuroImage, vol 117, pp. 40-55.
[10] Smith S.M. (2009), ‘Threshold-free cluster enhancement: Addressing problems of smoothing, threshold dependence and localisation in cluster inference’, NeuroImage, vol 44, pp. 83-98.
[11] Jones D.K. (2013), ‘White matter integrity, ber count, and other fallacies: The do's and don'ts of diffusion MRI’, NeuroImage, vol 73, pp. 239-254.
[12] Chen, J. (2015), 'Principle Component Analysis of Orientation Distribution Function in Diffusion Spectrum Imaging', Human Brain Mapping, vol. 21, page 5126.
[13] Yuan X. (2009), ‘Sparse and Low-Rank Matrix Decomposition Via Alternating Direction Methods’, Optimization Online. November 2009.
[14] Candes, E.J. (2011), 'Robust Principal Component Analysis', Journal of the ACM, vol. 58, No 3, Art 11. [15] Otazo, R. (2015), 'Low-Rank Plus Sparse Matrix Decomposition for Accelerated Dynamic MRI with Separation of Background and Dynamic Components', Magn. Reson. Med., vol. 73, pp. 1125-36.
[16] Verstynen, T.D. (2013), ‘Competing physiological pathways link individual differences in weight and abdominal adiposity to white matter microstructure’, NeuroImage, vol 79, pp. 129-137.
[17] Van Essen, D.C. (2013). The WU-Minn Human Connectome Project: An overview. NeuroImage, vol 80, pp. 62-79.
[18] Yeh, F.C (2010), ‘Generalized q-Sampling Imaging’, IEEE Transactions on Medical Imaging, vol. 29, no. 9, pp. 1626-35.
[19] Mazziotta J. (2001), ’A probabilistic atlas and reference system for the human brain: International Consortium for Brain Mapping (ICBM)’, Phil. Trans. R. Soc. Lond. B., vol 256, pp. 1293-1322.
[20] Klein S.(2010), ‘elastix: A Toolbox for Intensity-Based Medical Image Registration’, IEEE Trans Med Imaging, vol 29, pp. 196-205.
Figures