1798
Cortical Diffusion Analysis of Human Connectome Project Data Identifies Granular Cortices1Department of Electrical Engineering, Stanford University, Stanford, CA, United States, 2Department of Radiology, Stanford University, Stanford, CA, United States, 3The Center for Cognitive and Neurobiological Imaging, Stanford University, Stanford, CA, United States, 4Athinoula A. Martinos Center for Biomedical Imaging, Massachusetts General Hospital, Boston, MA, United States, 5Department of Radiology, Harvard Medical School, Boston, MA, United States
Synopsis
We performed whole-brain cortical surface-based analysis of diffusion orientations on 100 subjects from the Human Connectome Project. Correlations between diffusion angles (angles between primary diffusion orientations and cortical surface normals) and cortical thickness and curvature were removed using rank-based linear regression. The resulting diffusion angle maps show radial diffusion orientations in all regions except for a few granular cortices which have predominantly tangential diffusion orientations. Identification of the granular cortices is greatly enhanced in the group-averaged map compared to a single-subject dataset.
Introduction
Diffusion MRI is commonly used to study the large-scale coherent structure of white matter (WM) and more recently has been employed to study gray matter (GM). Coherent patterns of diffusion anisotropy in the cerebral cortex have been observed in both ex vivo (1-3) and in vivo data (4-8). Specifically, the primary diffusion orientations were found to be either radial or tangential to the cortical surfaces, depending on the cortical location and depth. Prior in vivo human work sacrificed whole-brain coverage in exchange for the additional averaging needed to produce sufficiently high-resolution and high signal-to-noise ratio (SNR) images. Here we perform a group analysis of 100 subjects from the Human Connectome Projects (HCP) to provide a whole-brain map of cortical diffusion patterns.Methods
Data. Pre-processed diffusion (11) and T1-weighted data (with provided FreeSurfer (9, 10) reconstruction results) of 100 subjects from WU-Minn Human Connectome Project (HCP) were downloaded for analysis. (https://www.humanconnectome.org/).
Surface-based Analysis. FreeSurfer (9, 10, 12) was used to compute surfaces, surface normals and co-register the diffusion data to the surfaces. The primary diffusion orientations (from FSL’s (13) BEDPOSTX model (14)) were used to compute the angles between them and the surface normals. Specifically, the angle was calculated as the arccos of the absolute value of their dot product (herein referred as diffusion angle). The diffusion angle ranges [0, 90o], with 0o and 90o meaning diffusion is radial or tangential to the cortical surface. Surface maps of diffusion angle, cortical thickness and curvature were co-registered to FreeSurfer’s fsaverage space for group analysis and utilization of Brodmann areas (BA) atlas (15).
Regression. Rank-based linear regression (diffusion angle~curv+thickness) was performed using R’s (16) RFIT package (17) for each subject. Radiality values were transformed to [-inf, +inf] using a monochrome function (i.e. log(cos(radiality)/(1-cos(radiality))) with the rank preserved. The mean of the cortical thickness and curvature was removed.
Results and Discussion
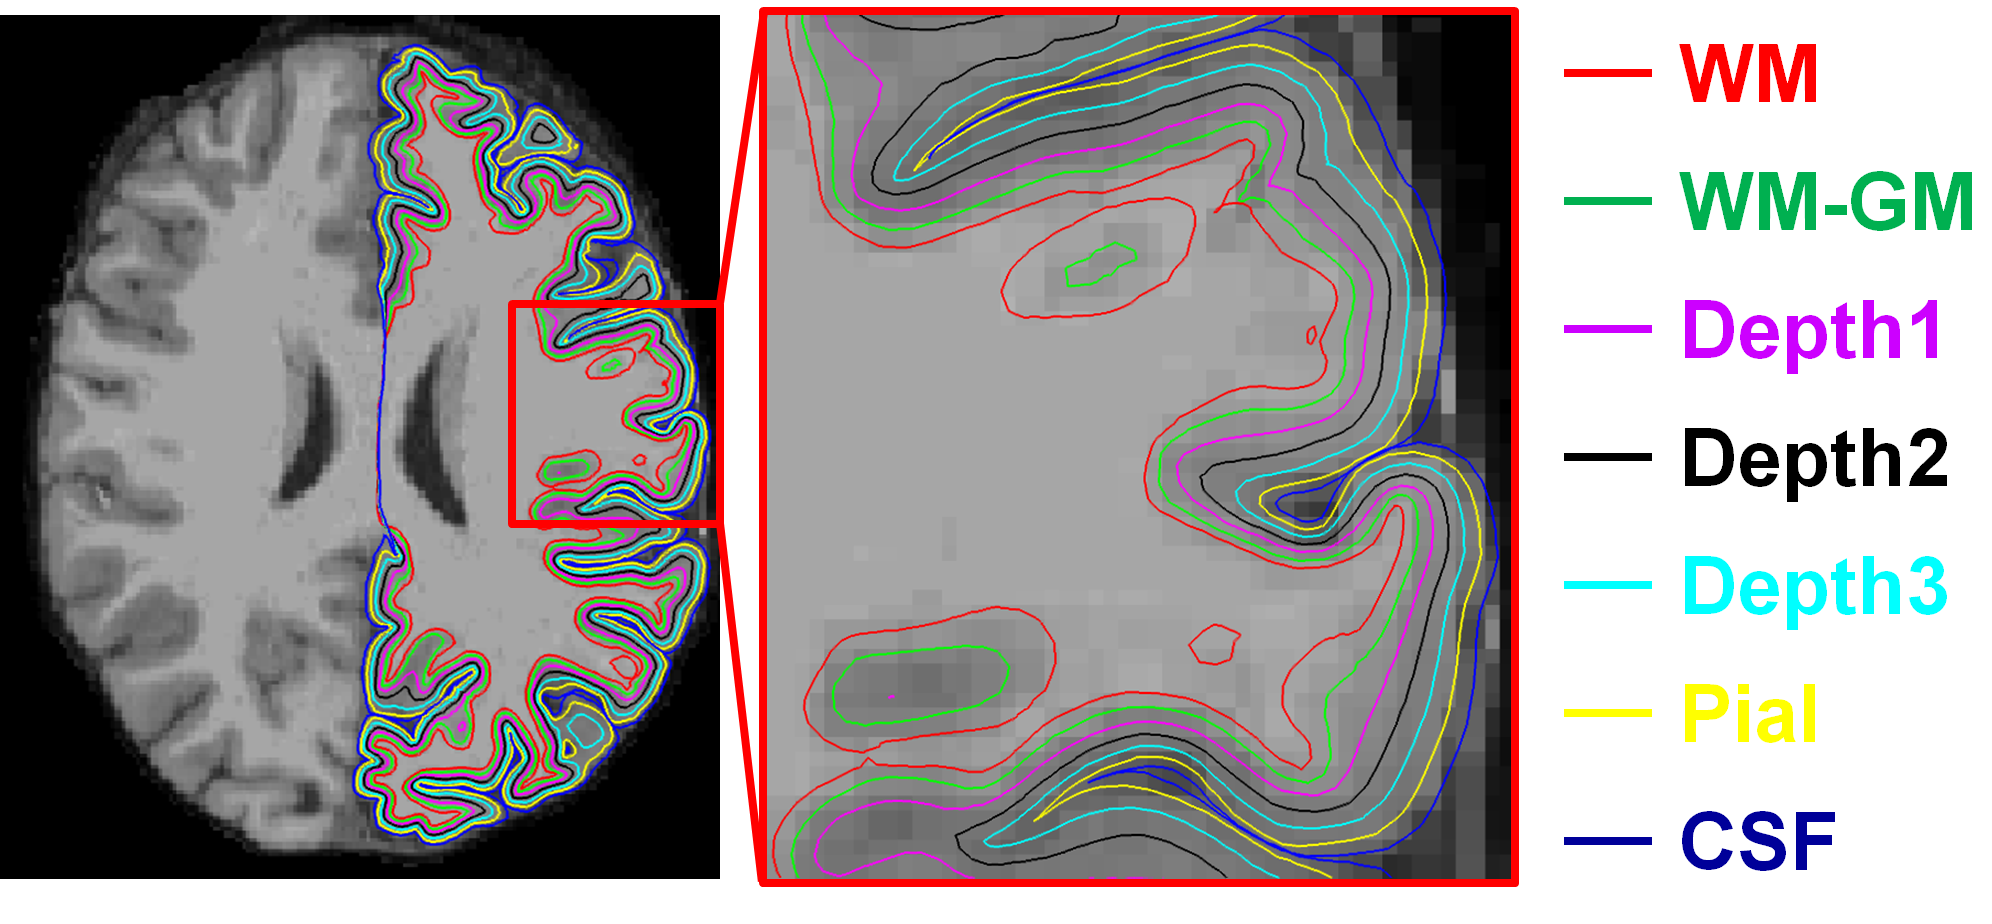
Figure 1 displays the 7 evenly spaced surfaces reconstructed using FreeSurfer. The central cortical surface (Depth 2) has the least partial voluming effect with WM and CSF and therefore was used to provide the final map (shown in Fig.5).
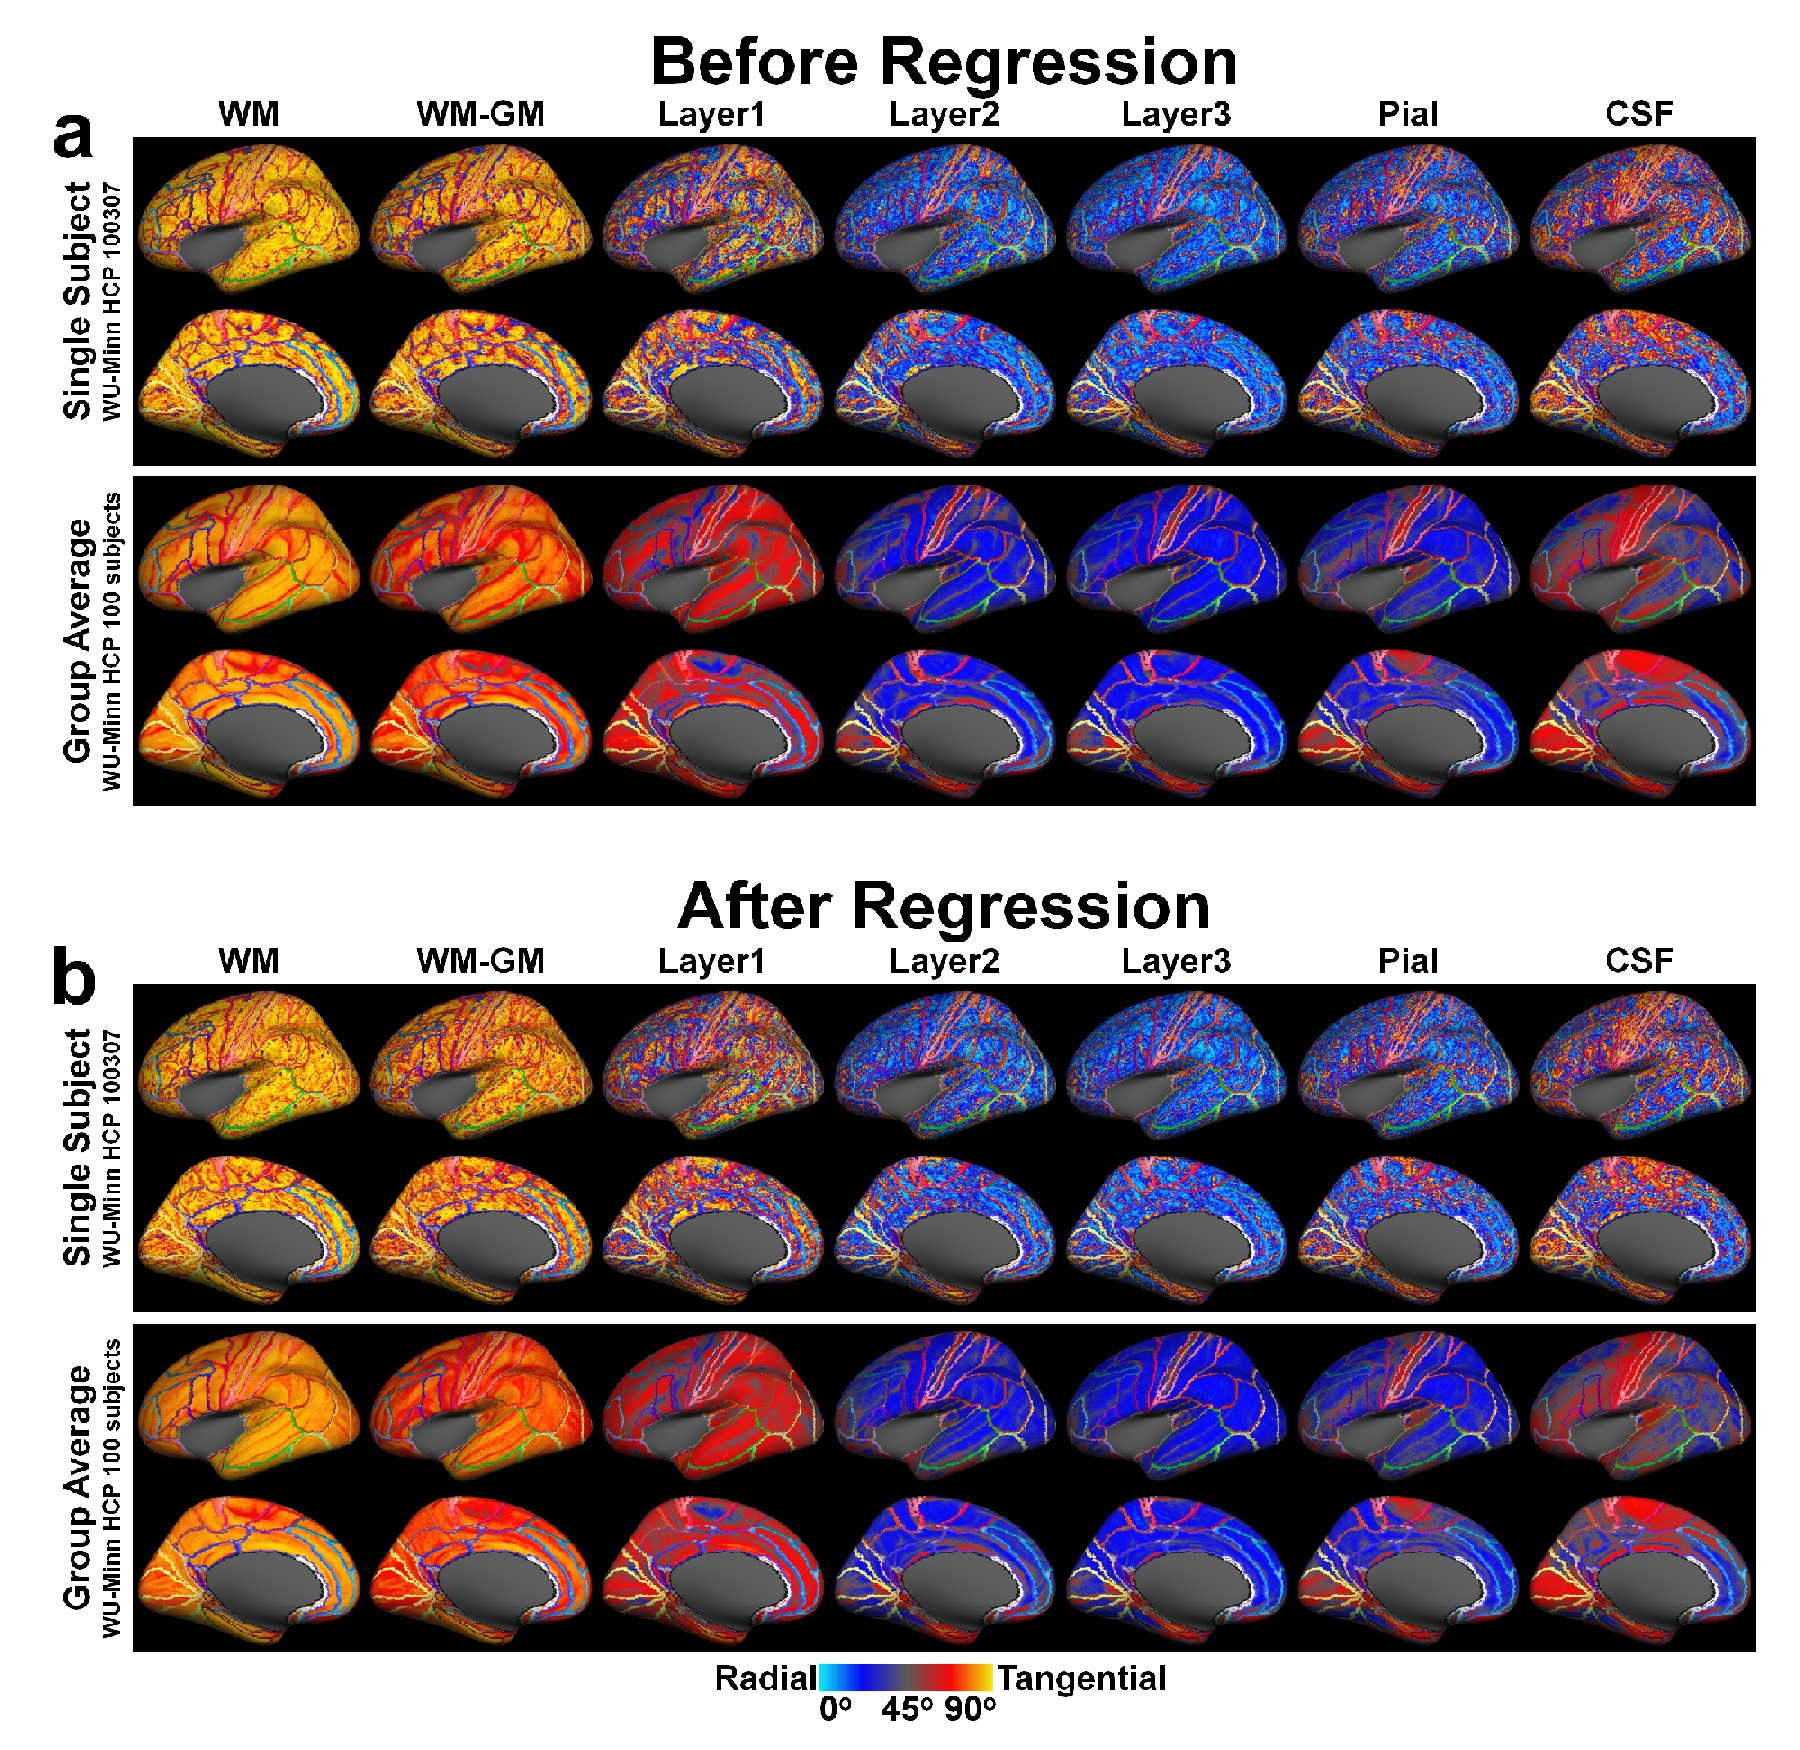
Figure 2 depicts the SNR gain of large group-averaged, whole-brain diffusion angle maps compared to a single-subject (top rows in (a, b)), partial-brain (4, 6) maps. Diffusion is dominantly tangential (red-yellow) near the WM-GM boundary (WM, WM-GM and Depth1) where WM fibers turn into GM; radial (blue) in GM (Depth2, 3 and pial) (except for areas labeled in Fig.5); and neutral (gray) in CSF as diffusion orientations are random. After regression the diffusion angle maps maintain the same overall patterns.
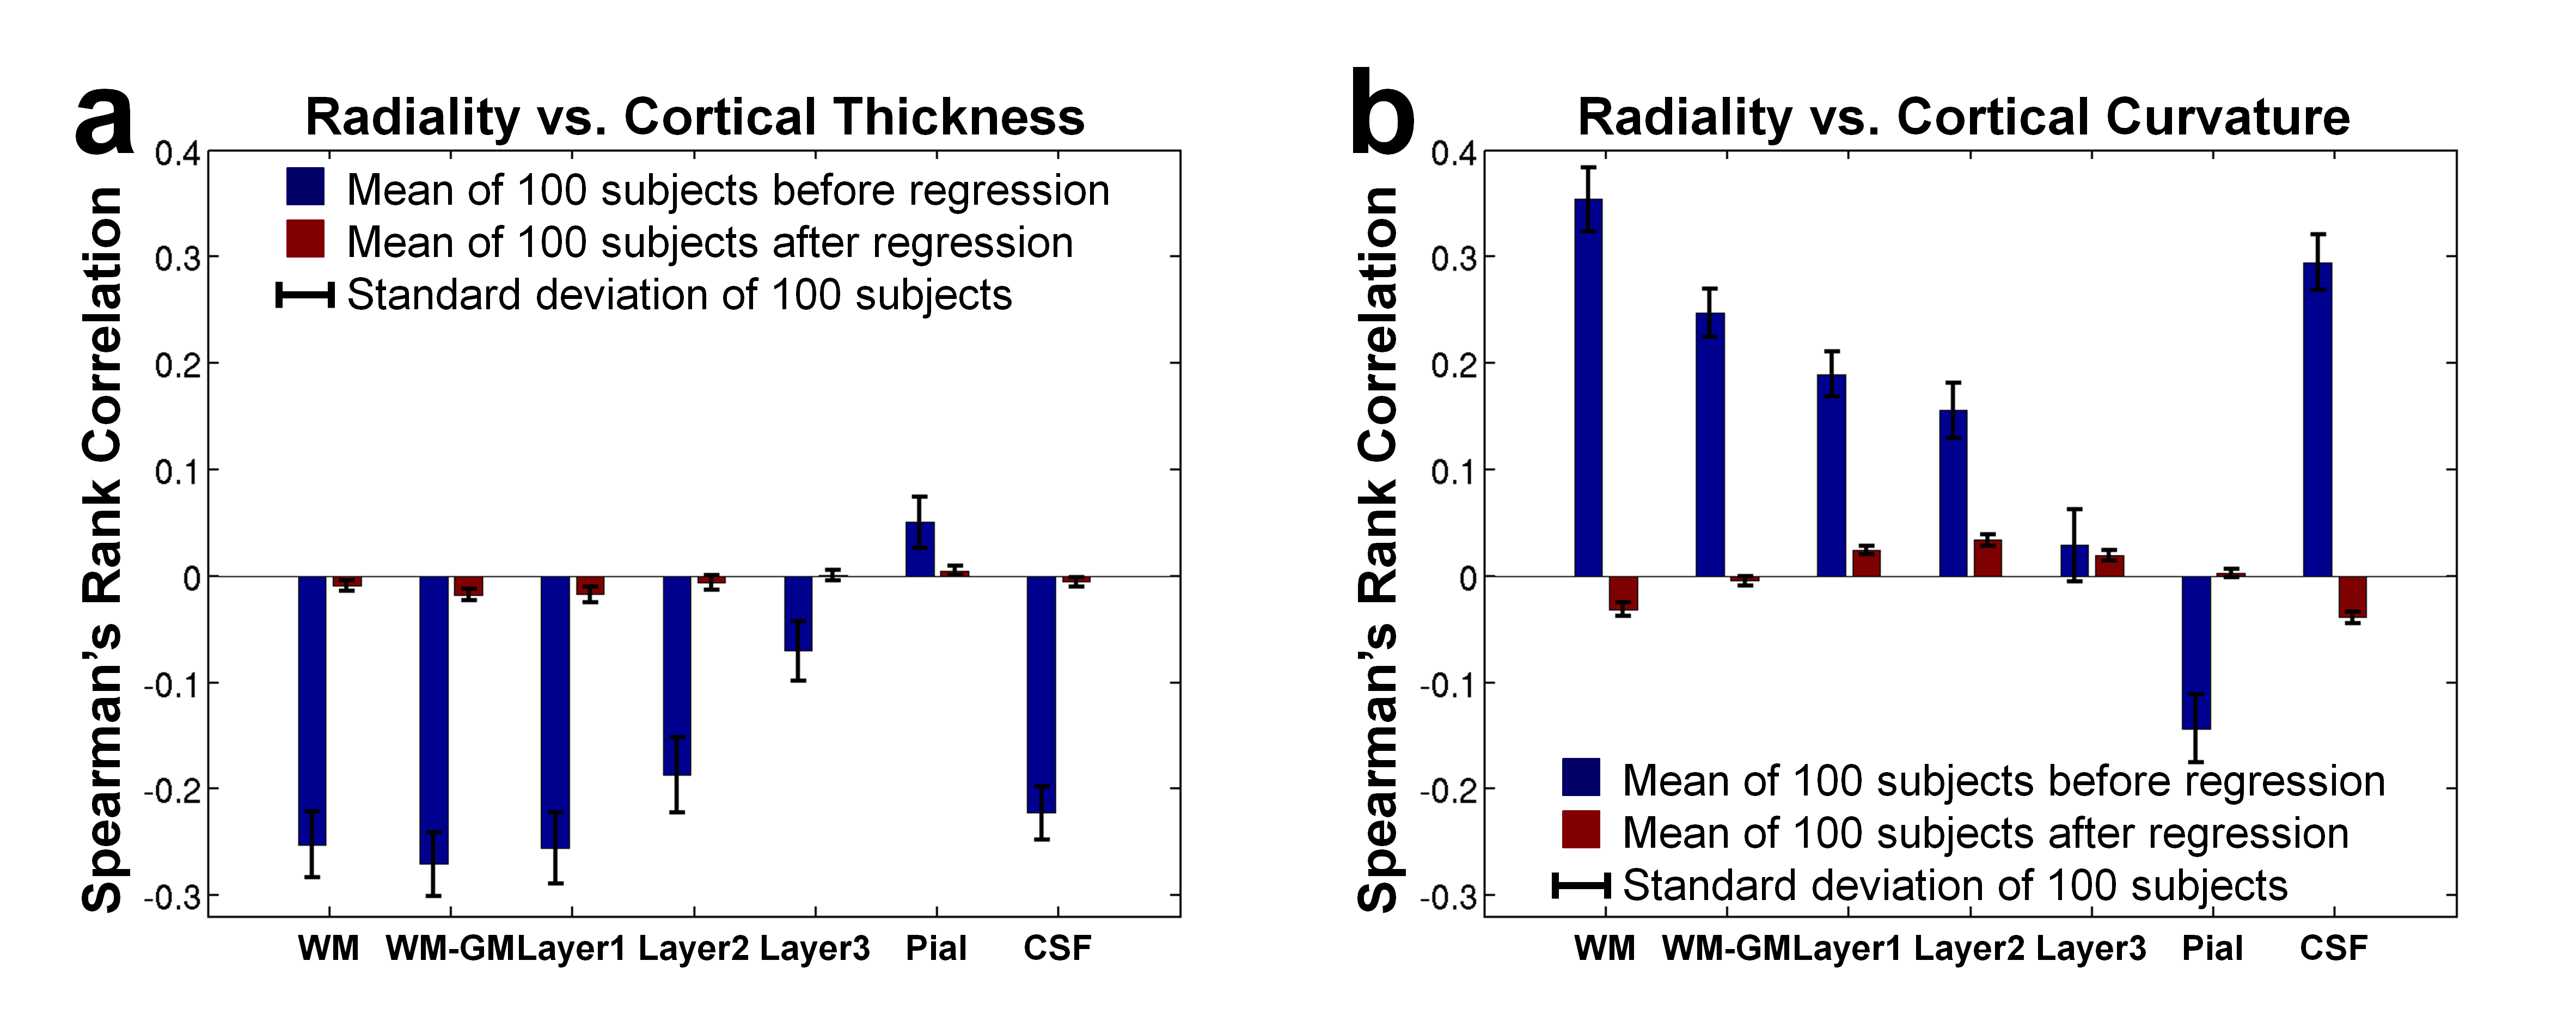
Figure 3 demonstrates that regression successfully removes diffusion angle’s dependence on cortical thickness and curvature (correlation reduced from ~0.3 to ~0.03). Diffusion angle and thickness was negatively correlated, implying that thin cortical areas tend to exhibit tangential diffusion. Diffusion angle and curvature was positively correlated, implying that the crowns of the gyri and the fundi of the sulci tend to exhibit tangential diffusion while the baks of the gyri tend to exhibit radial diffusion.
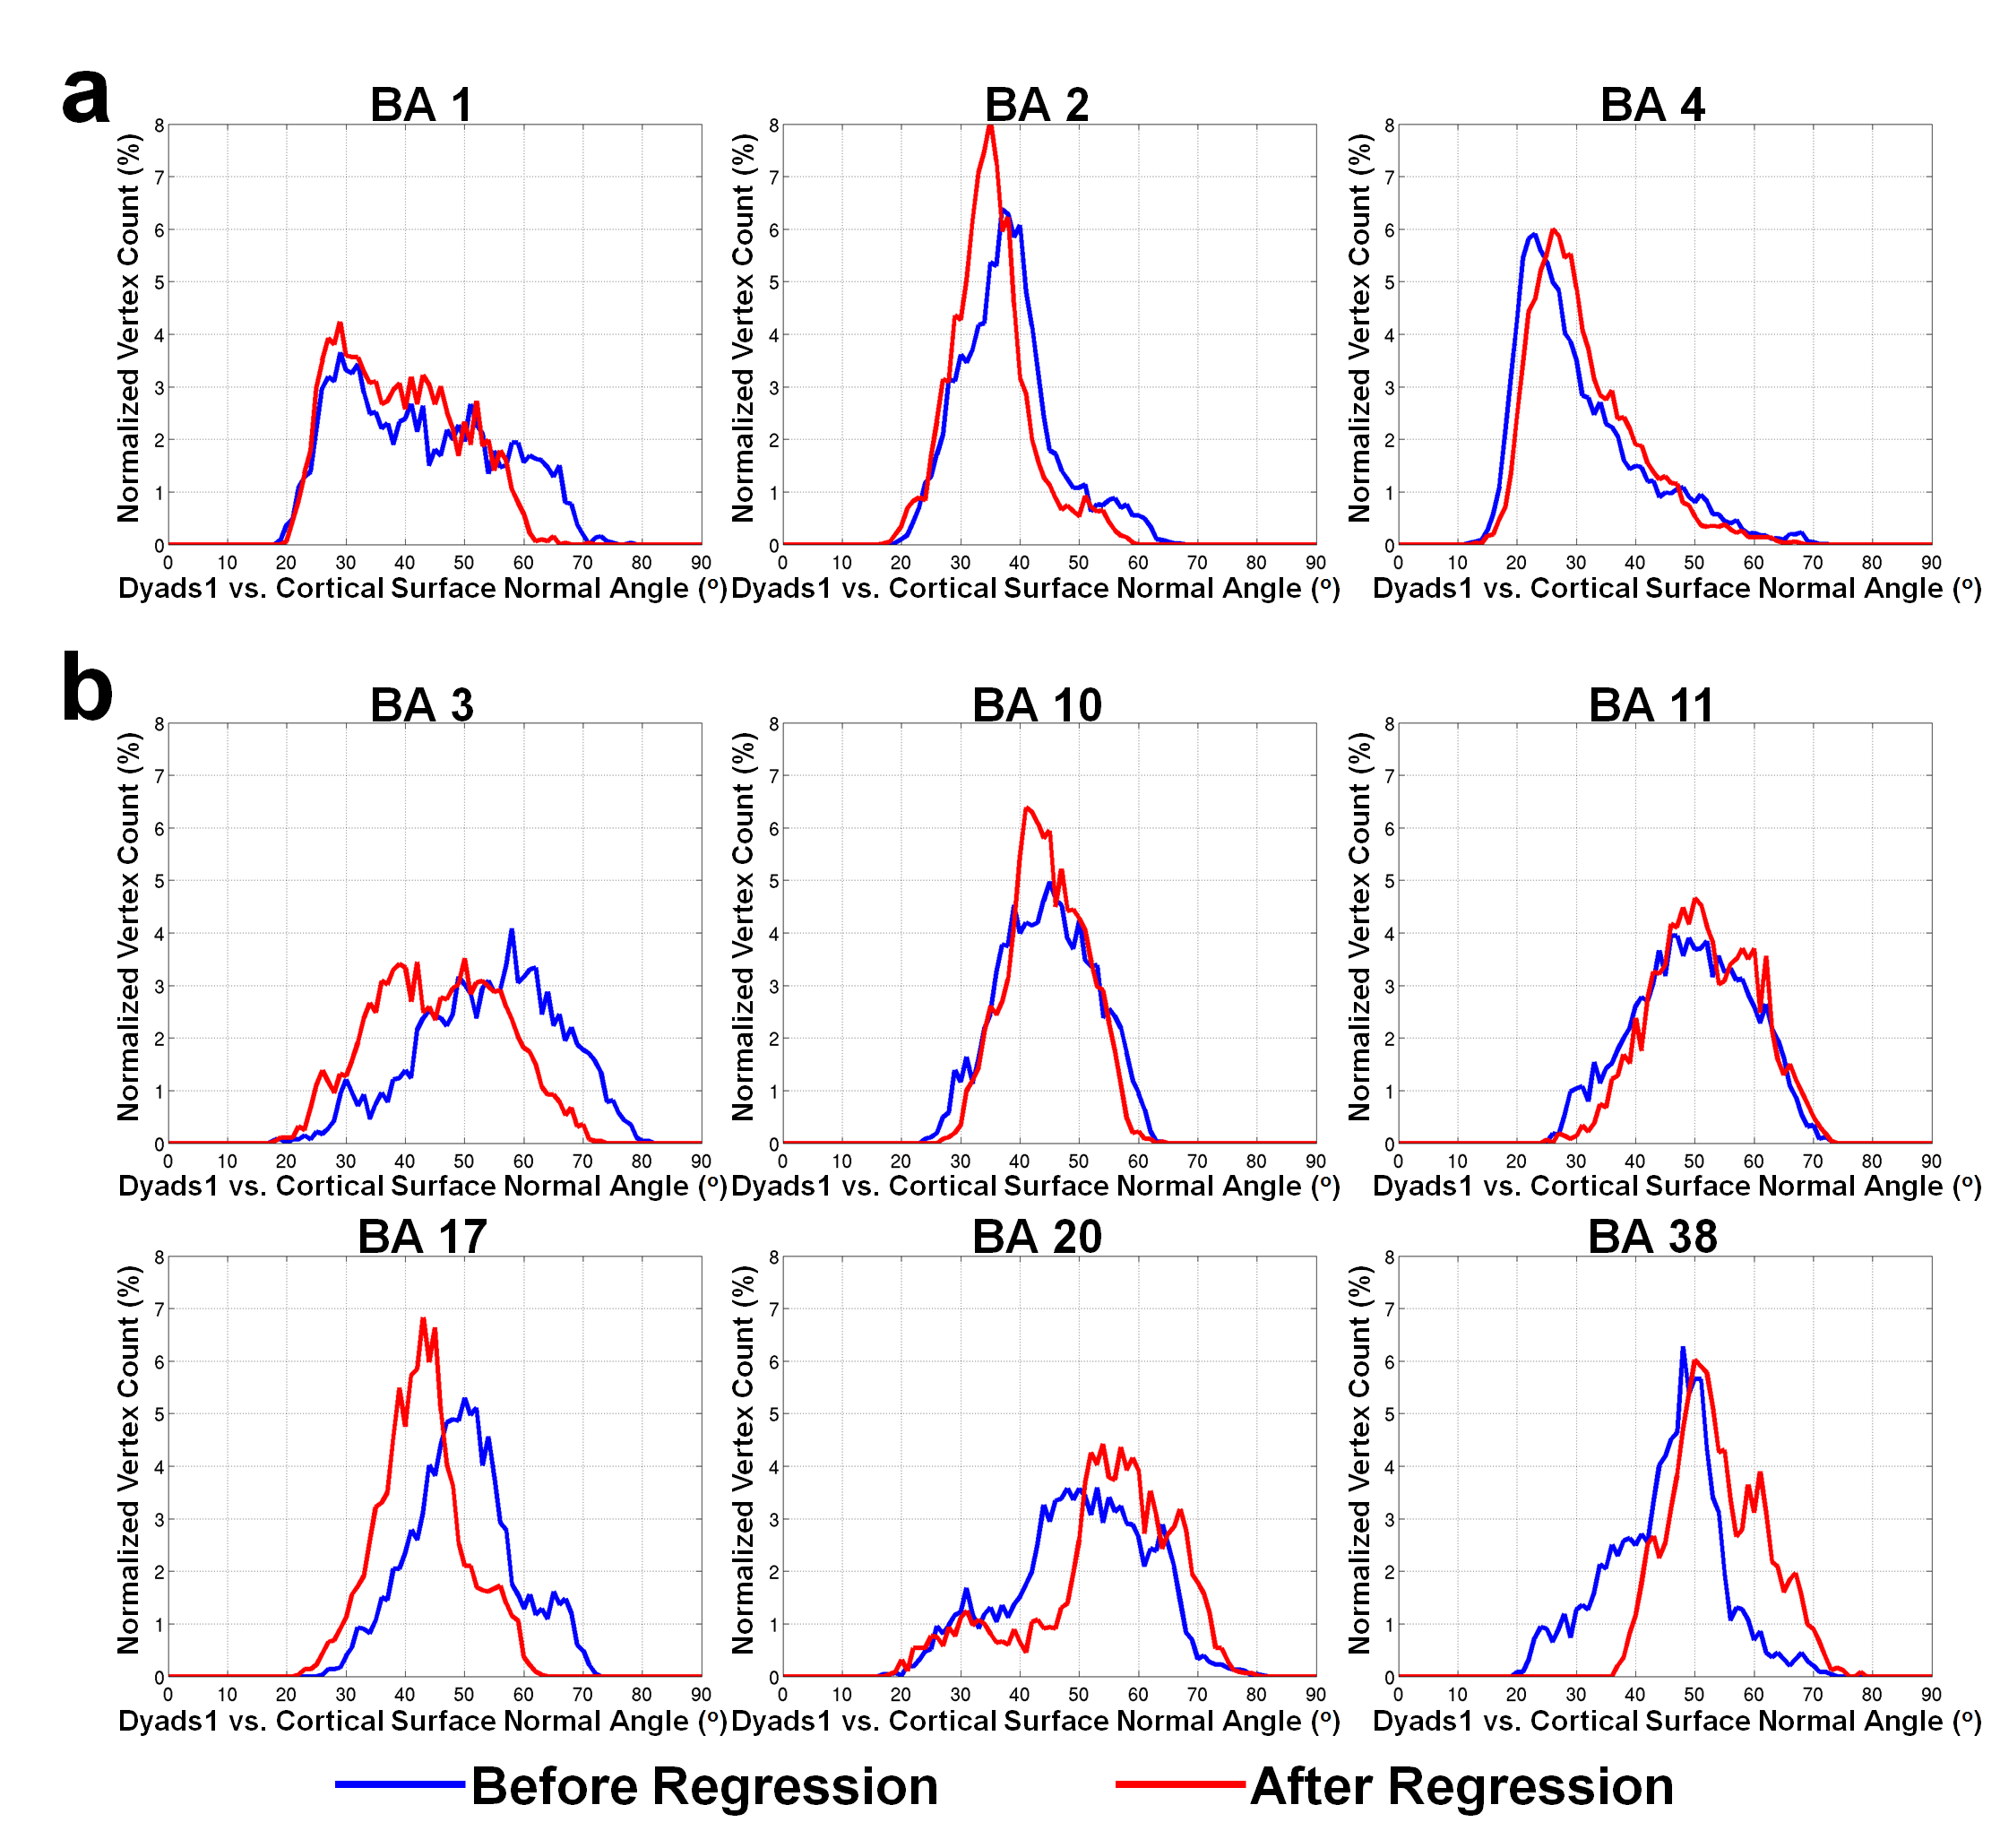
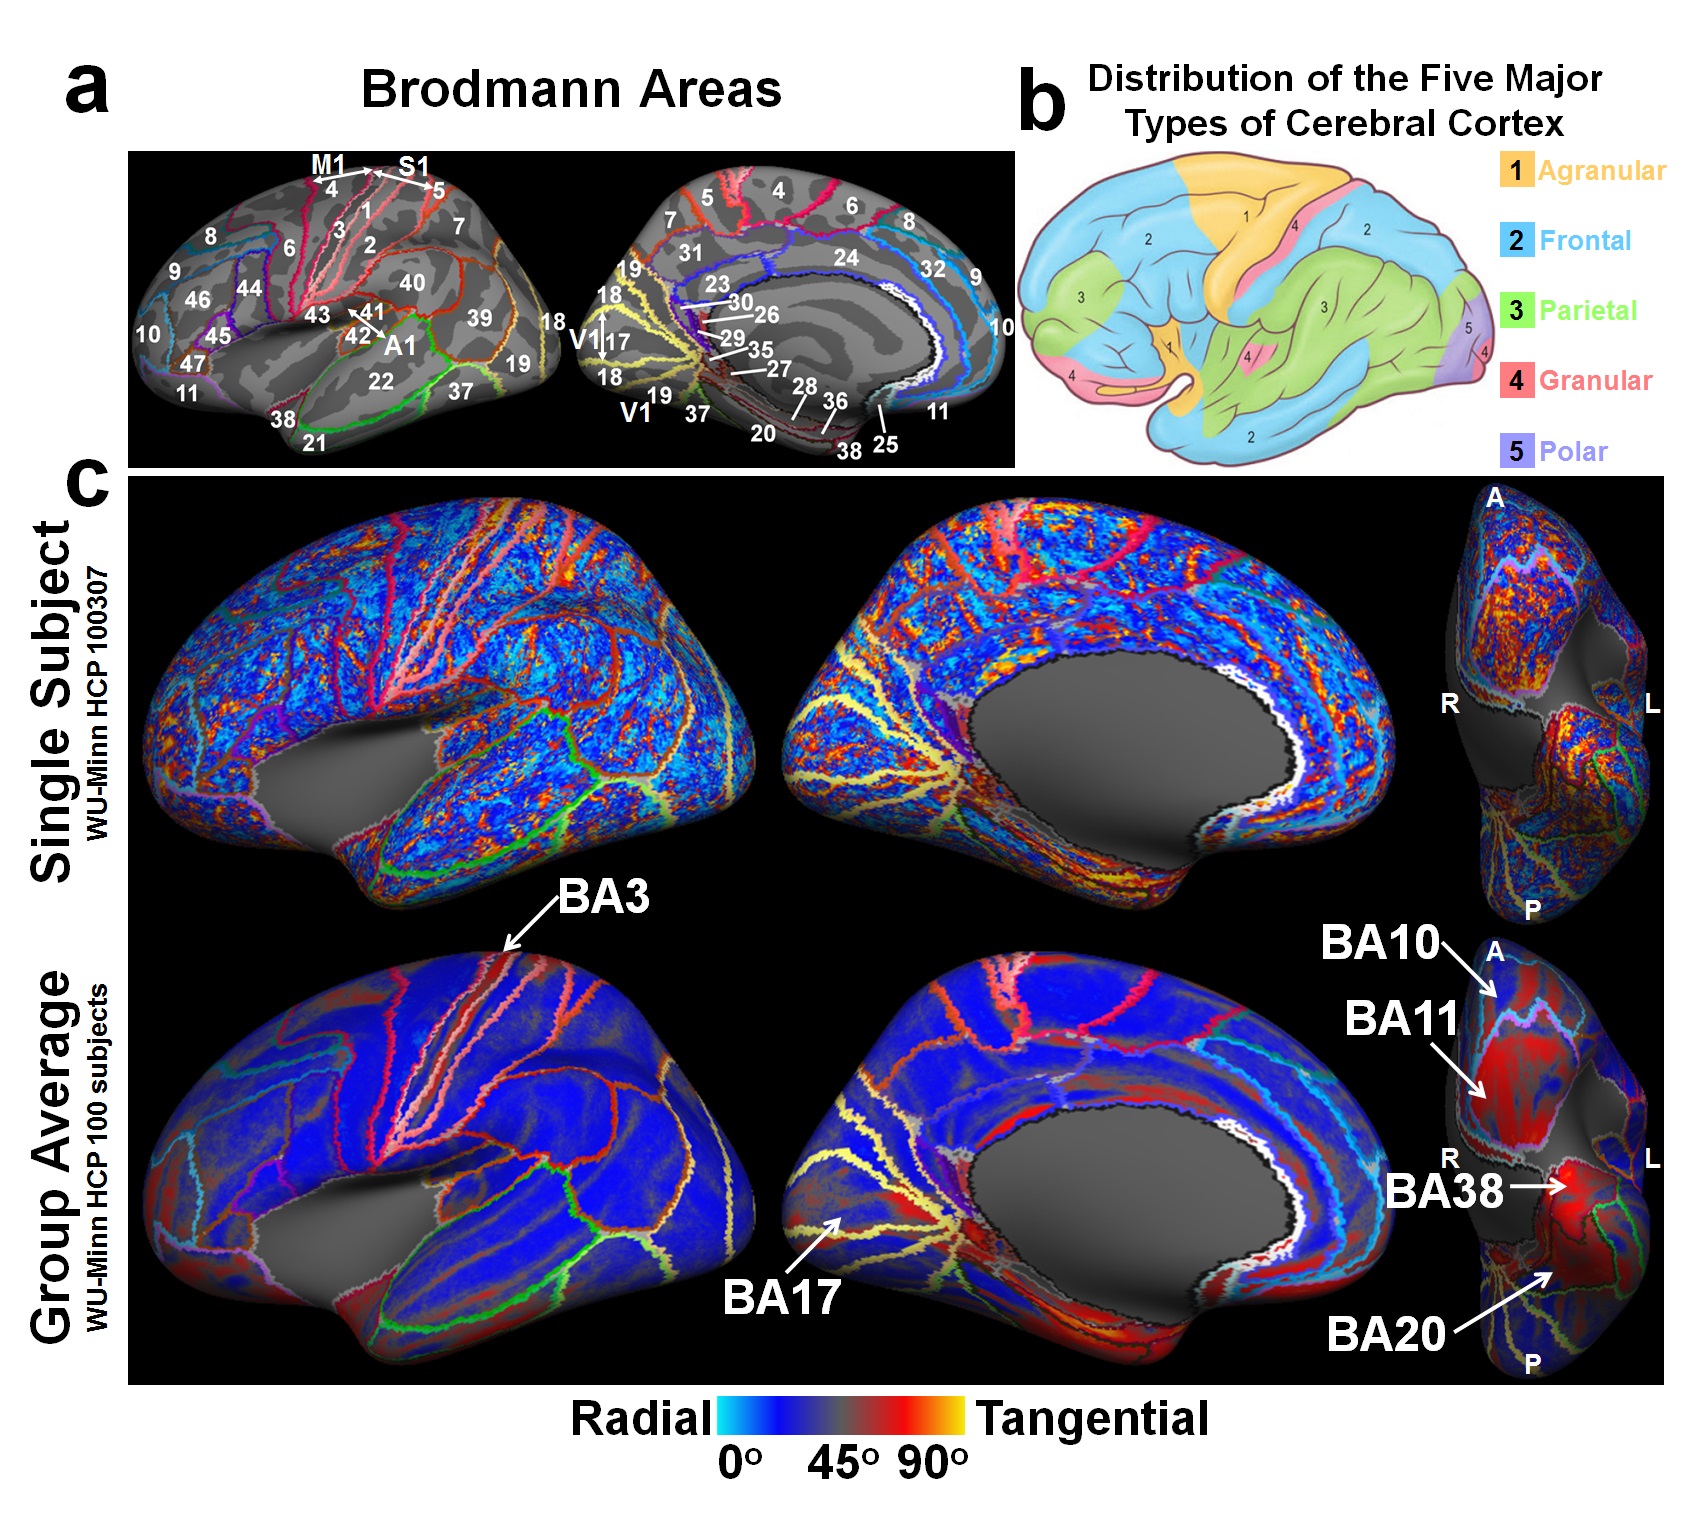
Figure 4 shows the effects of regression on diffusion angle estimates. The diffusion angles in BA3 and BA17 decrease (shifting from tangential diffusion to radial diffusion) while the diffusion angles in BA20 and BA38 increase (i.e. more significant tangential diffusion). However, the overall radial ((a) diffusion angle histogram peak located under 45o) and tangential ((b) diffusion angle histogram peak located above 45o) patterns are preserved after regression. Diffusion angles across the entire cortex range from 20o to 70o, suggesting that the primary diffusion orientations are not strictly parallel or orthogonal to the cortical surface, but rather have a radial (a) or tangential tendency (b) to either extremity.
Figure 5 shows regions
with predominantly large diffusion angles correspond to locations
of heterotypical granular cortices (pink regions in (b), e.g. postcentral
(somatosensory), striate (visual) and superior temporal (acoustic) gyrus). This
property is useful in in vivo segmenting out the granular sub-region of S1
(i.e. BA3) from its neighbors (i.e. M1 (BA4) and another sub-region of S1
(BA1)) which is of interest to many research groups for advancing human brain
mapping (18-20). The identification on the
single-subject map is not as evident as on the group-averaged map.
Summary
The angles between the primary diffusion orientations and cortical surface normals were found to correlate with cortical thickness and curvature. After regressing out these correlations, a whole-brain, group-averaged angle map based of HCP data, identifies regions that correspond to granular cortices.Acknowledgements
Funding was provided by GE Healthcare, NIH: P41-EB015891, S10-RR026351, R01 NS095985.References
1. Leuze CW, et al. Layer-specific intracortical connectivity revealed with diffusion MRI. Cereb Cortex. 2014;24(2):328-39.
2. McNab JA, et al. High resolution diffusion-weighted imaging in fixed human brain using diffusion-weighted steady state free precession. Neuroimage. 2009;46(3):775-85.
3. Aggarwal M, et al. Probing region-specific microstructure of human cortical areas using high angular and spatial resolution diffusion MRI. Neuroimage. 2015;105:198-207.
4. McNab JA, et al. Surface based analysis of diffusion orientation for identifying architectonic domains in the in vivo human cortex. Neuroimage. 2013;69:87-100.
5. Tian Q, et al. In Vivo Measurement of Intra-Voxel Crossing Fibers in the Cerebral Cortex Using Diffusion MRI. In Proceedings of the 23rd Annual Meeting of the International Society for Magnetic Resonance in Medicine (ISMRM), Toronto, Ontario, Canada. 2015; Abstract 2819.
6. Tian Q, et al. In Vivo Characterization of the Radial and Tangential Diffusion Patterns in Human Cerebral Cortex. In Proceedings of the 22nd Annual Meeting of the Organization for Human Brain Mapping (OHBM), Geneva, Switzerland. 2016; Abstract 3540.
7. Truong T-K, et al. Cortical Depth Dependence of the Diffusion Anisotropy in the Human Cortical Gray Matter In Vivo. PloS one. 2014;9(3):e91424.
8. Wu W, et al. High-resolution diffusion MRI at 7T using a three-dimensional multi-slab acquisition. NeuroImage. 2016;143:1-14.
9. Dale AM, et al. Cortical surface-based analysis: I. Segmentation and surface reconstruction. Neuroimage. 1999;9(2):179-94.
10. Fischl B, et al. Measuring the thickness of the human cerebral cortex from magnetic resonance images. Proceedings of the National Academy of Sciences. 2000;97(20):11050-5.
11. Sotiropoulos SN, et al. Advances in diffusion MRI acquisition and processing in the Human Connectome Project. Neuroimage. 2013;80:125-43.
12. Polimeni JR, et al. Laminar analysis of 7T BOLD using an imposed spatial activation pattern in human V1. Neuroimage. 2010;52(4):1334-46.
13. Jenkinson M, et al. FSL. NeuroImage. 2012;62(2):782-90.
14. Behrens T, et al. Characterization and propagation of uncertainty in diffusion-weighted MR imaging. Magnetic resonance in medicine. 2003;50(5):1077-88.
15. Brodmann K. Brodmann's: Localisation in the Cerebral Cortex: Springer Science & Business Media; 2007.
16. Team RC. R: A language and environment for statistical computing. 2013.
17. Kloke JD, et al. Rfit: Rank-based estimation for linear models. The R Journal. 2012;4(2):57-64.
18. Geyer S, et al. Areas 3a, 3b, and 1 of human primary somatosensory cortex: 1. Microstructural organization and interindividual variability. Neuroimage. 1999;10(1):63-83.
19. Geyer S, et al. Areas 3a, 3b, and 1 of human primary somatosensory cortex: 2. Spatial normalization to standard anatomical space. Neuroimage. 2000;11(6):684-96.
20. Glasser MF, et al. Mapping human cortical areas in vivo based on myelin content as revealed by T1-and T2-weighted MRI. The Journal of Neuroscience. 2011;31(32):11597-616.
21. Standring S. Gray's anatomy: the anatomical basis of clinical practice: Elsevier Health Sciences; 2015.
Figures