1796
Longitudinal tissue changes in tumefactive demyelinating lesion associated with the administration of disease modifying drugs: a free water diffusion MRI study.1Trento University, Department of Cognitive Science, Trento, Italy, 2Brigham and Women’s Hospital, Harvard Medical School, 3Section of Neurology, Hospital of Rovereto, 4Section of Neurology, Hospital of Rovereto, APSS, 5Section of Neuroradiology, Mayo Clinic, 6Neuroradiologist, U.O. Radiology
Synopsis
It is challenging to diagnostically distinguish tumefactive demyelinating lesions (TDLs) from tumors surrounded by massive edema and mid-line shift such as high grade gliomas. We demonstrate free water diffusion MRI analysis to identify water diffusivity compartments in the lesion, and to monitor effects of medical treatment over time. We believe that free water diffusion analysis can be important adjunct to conventional MR, and adds value by improving our understanding of the histologic components of a lesion, which can help clinical diagnosis and potentially avoid biopsy.
Introduction
Tumefactive demyelinating lesion (TDL) is defined as a demyelinating lesion greater than 2 cm. MR imaging (MRI) is currently an effective technique for the identification of TDL. However, the presence of massive vasogenic edema in TDL can radiologically mimic a tumor mass, making a differential diagnosis of TDL from high-grade glioma difficult2-3, often requiring biopsy, which is invasive and stressful for patients. The diffusion properties of lesions, as assessed by diffusion MRI, have been used to identify underlying pathophysiological features of TDL, such as increased cellularity, cytotoxic edema etc. However, conventional diffusion measures such as the apparent diffusion coefficient (ADC) suffer from partial volume effects, which limit their sensitivity and specificity. The free water analysis is a method that eliminates partial volume with free-water1, and provides an additional dimension to assess lesions, especially those that involve edema, which induces considerable partial volume with free-water.The aim of this study is to retrospectively apply free water analysis on a verified case of complex TDL to evaluate its usefulness as a diagnosis tool, and as a way to monitor the effects to treatment. Using free-water analysis we were able to identify different regions in the lesion, which could correspond with different underlying pathophysiological features. In these regions we were also able to track changes over time, corresponding with treatment.Methods
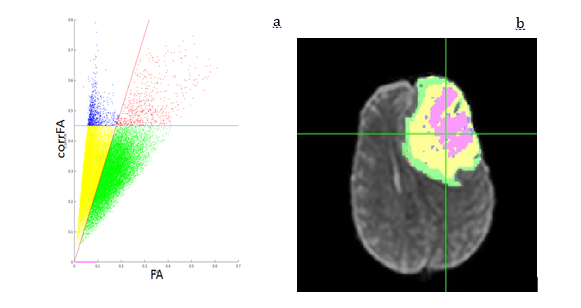
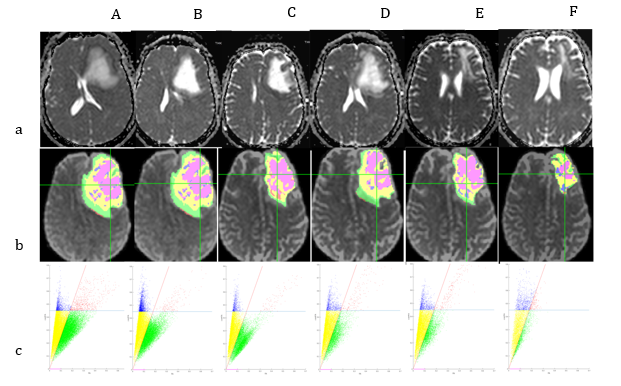
41 years old female presented to the ER with progressive anomic aphasia and mild hemiparesis of the right arm. An MR at baseline (A) revealed a lesion in the left frontal lobe (80,7mmx67mm on the axial plane) with midline shift. Conventional and advanced MR techniques allowed for a diagnosis of TDL. Additional scans were acquired following 1 week of intravenous bolus of corticosteroids (CCS) (B), two weeks after tapering of CCS (C), two weeks without any treatment (D), one month after 1st cycle of immunosuppressant (cyclophosphamide), 1 week following a bolus CCS (E) and one month after 2nd cycle of cyclophosphamide (F). Diffusion MRI acquisition was run on a 1.5T MR scanner, 20 gradient directions with b=1000 mm2/s, one b=0 and isotropic voxel resolution of 2,5 mm. The data was analyzed using diffusion tensor imaging (DTI) resulting with a fractional anisotropy (FA) map. Free-water analysis was also performed, resulting with corrected FA maps. The lesions were manually traced, and then clustered into 4 regions by scattering DTI's FA against the corrected FA, and applying two linear separators (Fig. 1). A fifth region was defined as voxels with free-water fraction of 100% (equivalent to corrected FA of 0). The clusters were then mapped back to the image domain. Yellow and green voxels have been labeled as inflammatory debris and active demyelination respectively, based on their location in the lesion: the active demyelination area shaped as an open ring, in the outer section of the lesion, and the inflammatory debris more central surrounding the free water.Results
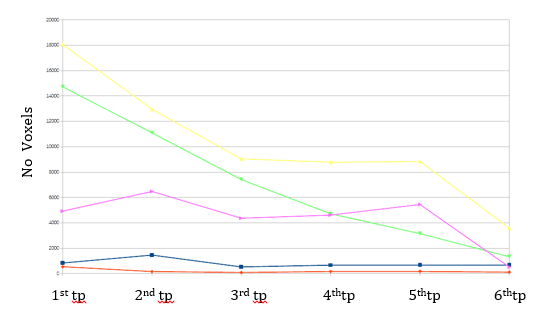
As shown in Fig. 1 and Fig.2, the area of inflammatory debris and active demyelinating front of the lesion steadily decrease with corticosteroid (CCS) therapy (B and C). With dosage reduction of CCS (C) and without CCS treatment (D), both these regions start to increase again. Immunosuppressant therapy (E and F) shows a dramatic and more desirable reduction of the active demyelination and inflammatory components, reducing the size of the core necrotic area as well (F).Discussion
The method presented here allowed distinguishing 5 regions within the lesion. Based on the pathophysiology of TDL we hypothesized that three of these regions correspond to: pockets of free water or necrosis (purple region), damaged brain tissue possibly with inflammatory debris (yellow region) and the front of the lesion characterized by active demyelination and presence of inflammatory cells (green region).Conclusion
We demonstrated the usefulness of free-water analysis for understanding the make-up of diagnostically challenging TDL, potentially obviating the need for biopsy. In future studies the pathophysiology of the regions we identified could be associated with biopsy data. Our findings also suggest that this type of analysis could be useful in revealing the efficacy of drugs and to better understand on what component of the lesion they act upon.Acknowledgements
No acknowledgement found.References
1) Pasternak, O., Sochen, N., Gur, Y., Intrator, N., & Assaf, Y. Free water elimination and mapping from diffusion MRI. Magnetic Resonance in Medicine. 2009;62(3), 717–730.
2) Given CA, 2nd, Stevens BS, Lee C. The MRI appearance of tumefactive demyelinating lesions. AJR Am J Roentgenol. 2004;182:195–9
3) Tan HM, Chan LL, Chuah KL, et al. Monophasic, solitary tumefactive demyelinating lesion: neuroimaging features and neuropathological diagnosis. Br J Radiol. 2004;77:153–6.
Figures