1790
Fractional anisotropy spatial covariance analysis in Parkinson’s disease suggests a disease related degeneration pattern1Radiological Sciences, Division of Clinical Neuroscience, School of Medicine, University of Nottingham, Nottingham, United Kingdom, 2Sir Peter Mansfield Imaging Centre, School of Medicine, University of Nottingham, 3Centre for Neurodegeneration and Neuroinflammation, Imperial College London, London, United Kingdom, 4Both authors contributed equally.
Synopsis
Parkinson’s
disease (PD) is characterised by disrupted functional and structural brain
networks. Structural network changes are thought to better reflect progression
of the neurodegeneration. To study the pattern of neurodegeneration in
Parkinson’s disease (PD), we investigated the correlation pattern of fractional
anisotropy (FA) with substantia nigra (SN) using a structural covariance
analysis method. We also correlated FA maps with the unified Parkinson's
disease rating scale (UPDRS); we found a disruption of SN covariance FA maps in
PD compared to controls. Moreover, disease severity was significantly
correlated with FA in cerebellar and anterior cingulate cortex (ACC).
Purpose
To investigate FA spatial correlation pattern between substantia nigra (SN) and rest of brain in Parkinson’s disease (PD) subjects, and to study FA associations with disease severity UPDRS 3.Method
One hundred and two subjects (64 males and 68 PD subjects) (63.4±9.3 years old for PD; 62.8±9.8 years old for healthy control (HC); age of PD is not significant different from HC group.) underwent a multimodal multi-centre MRI study protocol at two sites (the Hammersmith Hospital, Imperial College London Research, and Queen Medical Centre, University of Nottingham). The study was performed with the informed consent of the subjects and the approved by the respective local Research Ethics Committee and governance bodies. A 3.0 T SIEMENS TrioTim with 32-channel head coils and a 3.0 T GE MRI scanners were used to collect diffusion tensor imaging (DTI) for fractional anisotropy (FA) image reconstruction. For each subject, a high spatial resolution anatomical T1 image was also collected for registration DTI image to Montreal Neurologic Institute (MNI) space. The structural image was registered to the MNI space using FSL-flirt function (http://fsl.fmrib.ox.ac.uk/fsl/fslwiki/ ), and FA image was then transformed to MNI using the transformation matrix obtained from structural image registration. All data were analysed in MNI space. A probabilistic mask of SN1 in MNI space was employed for both PD and healthy control subjects. Left and right SN were combined in the analysis, and the average FA value in the SN mask was calculated. We concatenated all 3D FA map of each subject to form a 4D FA matrix. Then, the correlation between the SN seed region and the rest of brain was computed for each group separately. Also, we compared the FA spatial correlation between HC and PD subject group using a regression model. Correlations between UPDRS 3 score (mean 30.7±11.9) with the FA value was estimated in a subgroup of 33 PD subjects (60±9 years, 22 male) from Imperial College London study cohort.Result
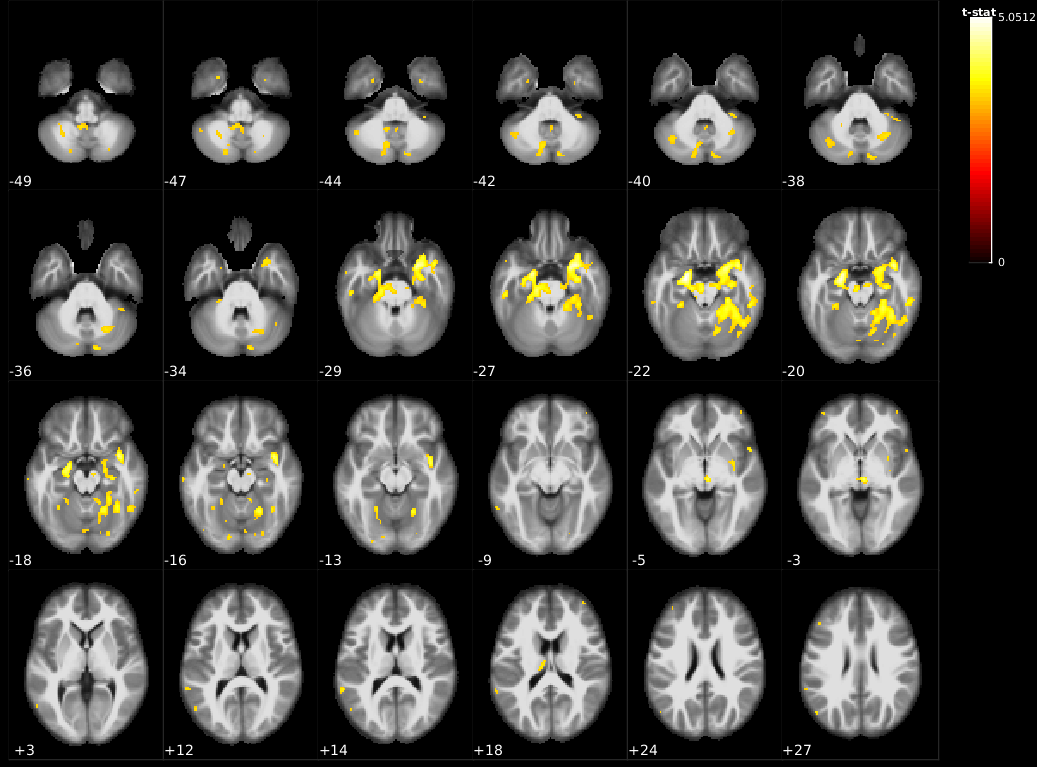
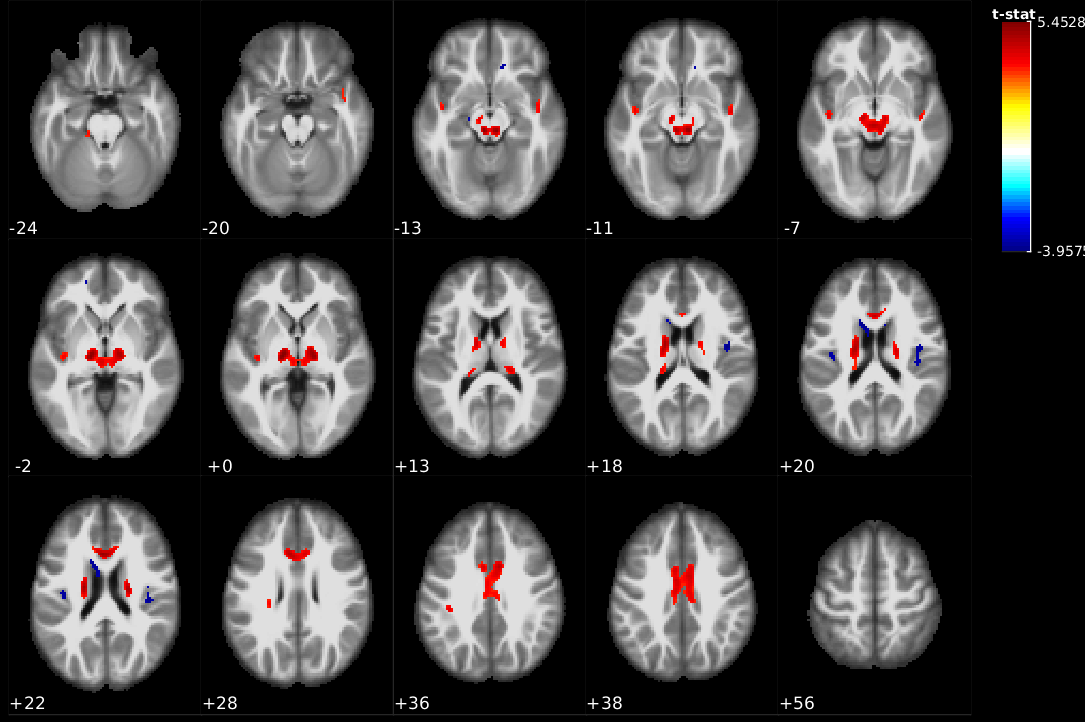
The ‘normal’ correlation map of averaged nigral FA value with the rest of the brain in controls is shown in Figure 1. Hippocampal and parahippocampal gyrus show significant correlation with SN from HC dataset. The correlation map in PD patients showed substantially more spatial correlations than HC in supratentorial white matter regions, bilateral thalami, and paralimbic cortical regions, and additional focal negative correlations (comparing Figure 1 with Figure 2).
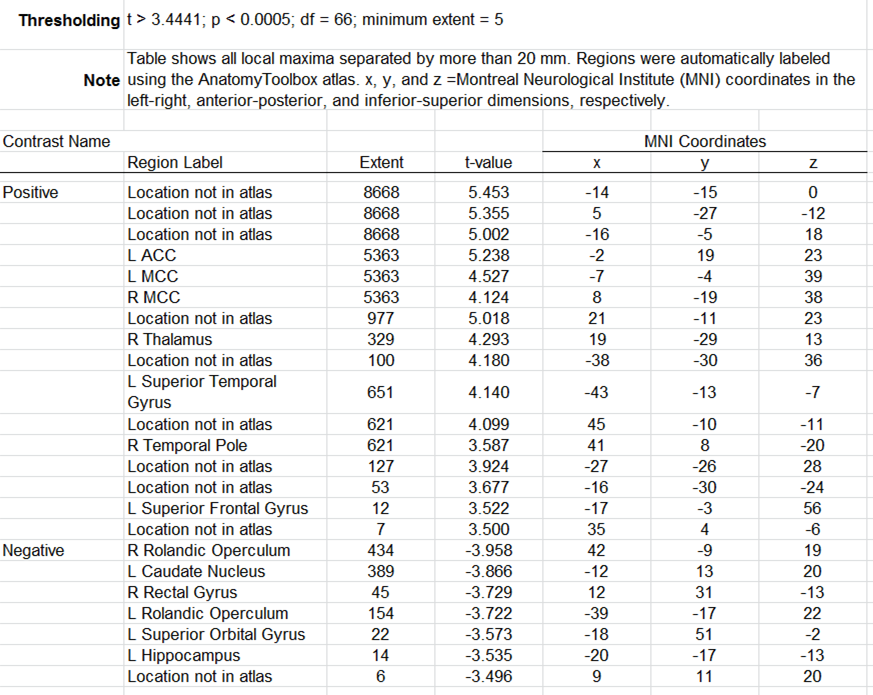
In the PD subject group (Figure 2), we found positive significant correlation in ACC, MCC, and temporal lobe pole (see Supplementary Table for detail). Furthermore, rolandic operculum, caudate, and hippocampus show negative correlations with FA values in SN regions.
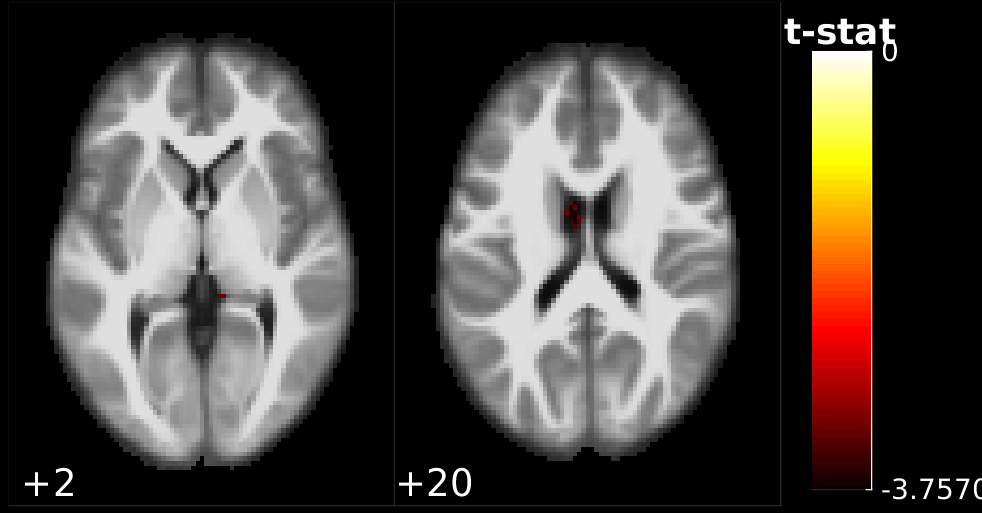
Figure 3 shows the FA spatial correlation difference map between HC and PD groups using a regression method. Significant differences were observed in caudate nucleus regions.
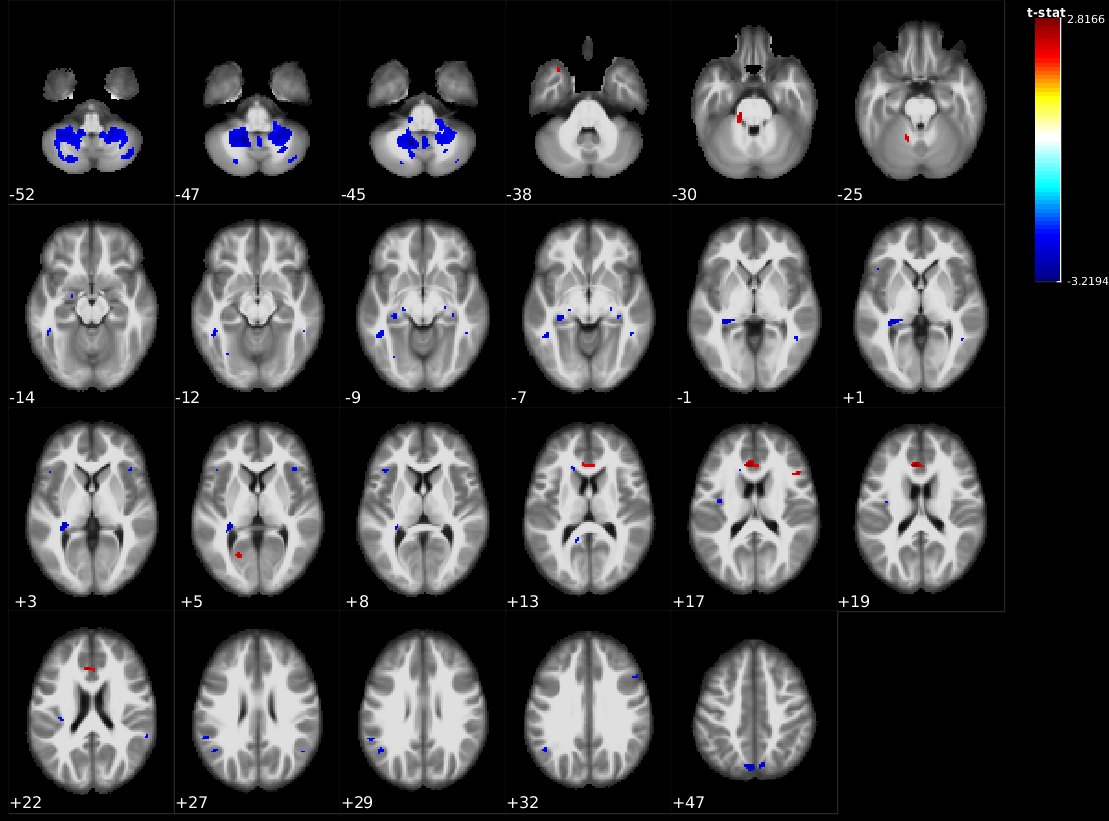
UPDRS-III motor severity scores showed significant negative correlations in cerebellar, white matter, insular lobe, hippocampus, amygdala, and temporal gyrus as well as a few positive cortical correlations mainly in the ACC (Figure 4).
Discussion
We extended structural covariance analysis2 to FA maps due to its proven higher sensitivity of neurodegenerative processes. We then used SN seed regions to investigate the pattern of synchronised progression of PD. The observed differences in correlation patterns of seed region and the rest of the brain in PD compared to controls point to a disease-related pattern of synchronous alteration of water diffusion properties with SN pathology. Positive covariance with nigral FA, and negative correlation with motor severity would be in line with a disease-relative degenerative pattern. Interpretation of negative covariance findings and positive correlations with motor severity in the cingulum is more speculative but may reflect compensatory mechanisms. Our findings have to be considered preliminary and need to be confirmed in an independent cohort. There is controversy regarding the diagnostic utility of regional DTI in PD between studies3-7. These preliminary results suggest that the covariance FA method may provide improved sensitivity to detect a PD-related signature of brain abnormalities.Acknowledgements
This work is supported by Parkinson's disease UK.References
1. Keuken, M.C., Forstmann, B.U., 2015. A probabilistic atlas of the basal ganglia using 7 T MRI. Data in Brief 4, 577-582.
2. Mechelli, A., Friston KJ, Frackowiak R, et al., 2005. Structural covariance in the human cortex. The Journal of Neuroscience 25, 8303-8310.
3. Hirata, F.C.C., Sato, J.R., Vieira, G., et al, 2016. Substantia nigra fractional anisotropy is not a diagnostic biomarker of Parkinson’s disease: A diagnostic performance study and meta-analysis. European Radiology, 1-9.
4. Langley, J., Huddleston, D.E., Merritt, M., et al., 2016. Diffusion tensor imaging of the substantia nigra in Parkinson's disease revisited. Human Brain Mapping 37, 2547-2556.
5. Loane, C., Politis, M., Kefalopoulou, Z., et al., 2016. Aberrant nigral diffusion in Parkinson's disease: A longitudinal diffusion tensor imaging study. Movement Disorders 31, 1020-1026.
6. Schwarz, S.T., Abaei, M., Gontu, V., et al., 2013. Diffusion tensor imaging of nigral degeneration in Parkinson's disease: A region-of-interest and voxel-based study at 3 T and systematic review with meta-analysis. NeuroImage: Clinical 3, 481-488.
7. Vaillancourt, D.E., Spraker, M.B., Prodoehl, J., et al., 2009. High-resolution diffusion tensor imaging in the substantia nigra of de novo Parkinson disease. Neurology 72, 1378-1384.
Figures