1778
Compressed Sensing to Accelerate Connectomic Histology in the Mouse BrainNian Wang1, Gary Cofer1, Robert J. Anderson1, Russell Dibb1, Yi Qi1, Alexandra Badea1, and G. Allan Johnson1
1Center for In Vivo Microscopy, Department of Radiology, Duke University, Durham, NC, United States
Synopsis
We evaluated the utility of compressed sensing (CS) for diffusion tensor (connectomic) histology in the mouse brain at high field (9.4T). We explored the effect of b values, compression factors, and k-space sampling strategies. We were able to achieve compression factors of 4X through judicious choice of k-space sampling patterns. Comparison to a comprehensively acquired data set (full sampling at 43 μm with 120 angles) allowed us to reduce the acquisition time by nearly 30X with minimal loss in the resulting connectome.
Purpose
Diffusion tensor histology holds great promise for quantitative characterization of connectivity in mouse models of neurological and psychiatric conditions. While higher angular resolution sampling schemes provide more reliable results, they also lead to increasingly long acquisitions 1. Therefore, a method to accelerate diffusion tensor imaging (DTI) acquisition is highly desirable. Compressed sensing is an accelerated imaging method, which enables reconstruction of undersampled data by exploiting image sparsity 2. Non-linear reconstruction in CS enhances the robustness of image reconstruction 3. In this study, we evaluated the feasibility of accelerated high-resolution DTI (60 µm3) for the mouse brain using CS with an acceleration factor of 4. We optimized the k-space sampling strategy for CS DTI data acquisition, and compared results with the fully sampled acquisition 1. To increase computational efficiency, we have adapted the CS reconstruction into a high-performance computing (HPC) environment.Methods
Animal experiments were carried out in compliance with the Duke University Institutional Animal Care and Use Committee. Wild-type adult male C57BL/6 mice specimens were chosen for MR imaging. Actively stained specimens were scanned at 9.4T (Oxford 8.9-cm vertical bore; Agilent VnmrJ 4.0 imaging console) using a modified 3D diffusion-weighed spin-echo pulse sequence with CS acceleration factor ranging from 4–8X. The repetition time (TR) was 90 ms, echo time (TE)=11 ~ 15 ms. DTI scans with six b-values (3000, 4000, 5000, 6000, 7000, 9000 s/mm2) were acquired independently with 60-µm isotropic spatial resolution. The diffusion sampling protocol included 31 unique diffusion directions and 3 non-diffusion-weighted (b0) measurements. With CS=4X, the total acquisition time was 430 minutes for one complete data set (3 baseline + 31 directions). Multiple k-space sampling strategies were explored. Specifically, the k-space sampling pattern (SPk) generated by a probability density function (PDF) for acquiring diffusion-weighted data was determined by parameters pa and pb using the equation: SPk=exp(-(pb*k/n)pa) 4. SPk was optimized using simulations with pa=1.8 and pb=3.6, and then tested by retrospectively resampling a fully sampled MRI data set. The optimized SPk was then used to drive the undersampled MR acquisition. CS reconstruction was applied to the undersampled k-space data by minimizing the following function: $${f(x) = \parallel Fx-y\parallel_2^2+a_{1} \parallel W x \parallel_{1}+a_{2} TV(x)}$$where x is the image and y is its corresponding k-space, F is the FFT, W is the sparse transform, a1 and a2 are weighting factors, TV is the total variation. Each 34-volume acquisition was reconstructed in ~ 20 minutes when using 4 HPC nodes (64 physical cores). After the CS reconstruction, the diffusion tensor was calculated at each voxel and used to generate fractional anisotropy (FA) and apparent diffusion coefficient (ADC) maps. The orientation distribution function (ODF) was calculated using DSI Studio software 5.Results
Figs 1a–b show the simulation results with different CS sampling patterns. CS reconstruction was significantly affected by the SPk. The CS reconstruction with optimized SPk demonstrated limited artifacts with 4 and 8X acceleration (Fig 1c). Figs 2a–d show the FA mapping at different b-values. The FA histogram with b-value=4000 s/mm2 (Fig 2e) was compared to previous high-resolution high-angular fully sampled mouse brain with b-value at 4000 s/mm2 1. The Hellinger Distance was used to assess the CS FA mapping by comparing it with the reference mouse FA. The Hellinger Distance became higher as the b-value increased, while the Hellinger Distance of b-value=3000 and 4000 were lower, since the DTI data of the reference mouse was acquired at b-value=4000 s/mm2 (Fig 2f). Figs 2g–h illustrate the FA and ADC in different white matter structures using different b-values. Both FA and ADC decrease with increasing b-value. The generalized Q-sampling imaging tractography in the white matter region with crossing fibers in mouse brain is shown in Fig 3. Crossing fibers in the hippocampus were better resolved using multi-shell acquisition method (arrows) than single shell. The deterministic tractography connectivity matrices for the mouse brain are shown in Fig 4. Higher angular resolution showed better connectivity among a few regions.Discussion and Conclusion
The robust CS reconstruction is strongly affected by the k-space sampling patterns used for MRI acquisition. With the optimized sampling pattern, both FA and ADC values showed good agreement with the fully sampled data. The ODF demonstrated the advantages for resolving crossing fibers in the mouse brain using multi b-values reconstruction. Compressed sensing holds the potential for achieving whole brain connectivity close to the fully sampled data.Acknowledgements
This work was supported by NIH/NIBIB P41 EB015897 and NIH 1S10OD010683-01.References
(1) Calabrese E, Badea A, Cofer G, et al. A diffusion MRI tractography connectome of the mouse brain and comparison with neuronal tracer data. Cerebral Cortex 2015; 25: 4628–4637. (2) Lustig M, Donoho D, Pauly JM. Sparse MRI: The application of compressed sensing for rapid MR imaging. Magnetic Resonance in Medicine 2007; 68: 1182-1195. (3) Lustig M, Donoho DL, Santos JM, Pauly JM..Compressed sensing MRI: A look at how CS can improve on current imaging techniques. IEEE Signal Processing Letters 2008; 25: 72-82. (4) Helmer KG, Chou M-C, Preciado RI, et al. Multi-site study of diffusion metric variability: characterizing the effects of site, vendor, field strength, and echo time using the histogram distance, Proc SPIE 9788, Medical Imaging 2016,:97881G. (5) Yeh FC, Wedeen VJ, Tseng W-Y I. Generalized q-sampling imaging. IEEE Transactions on Medical Imaging. 2010; 29: 1626-1635.Figures
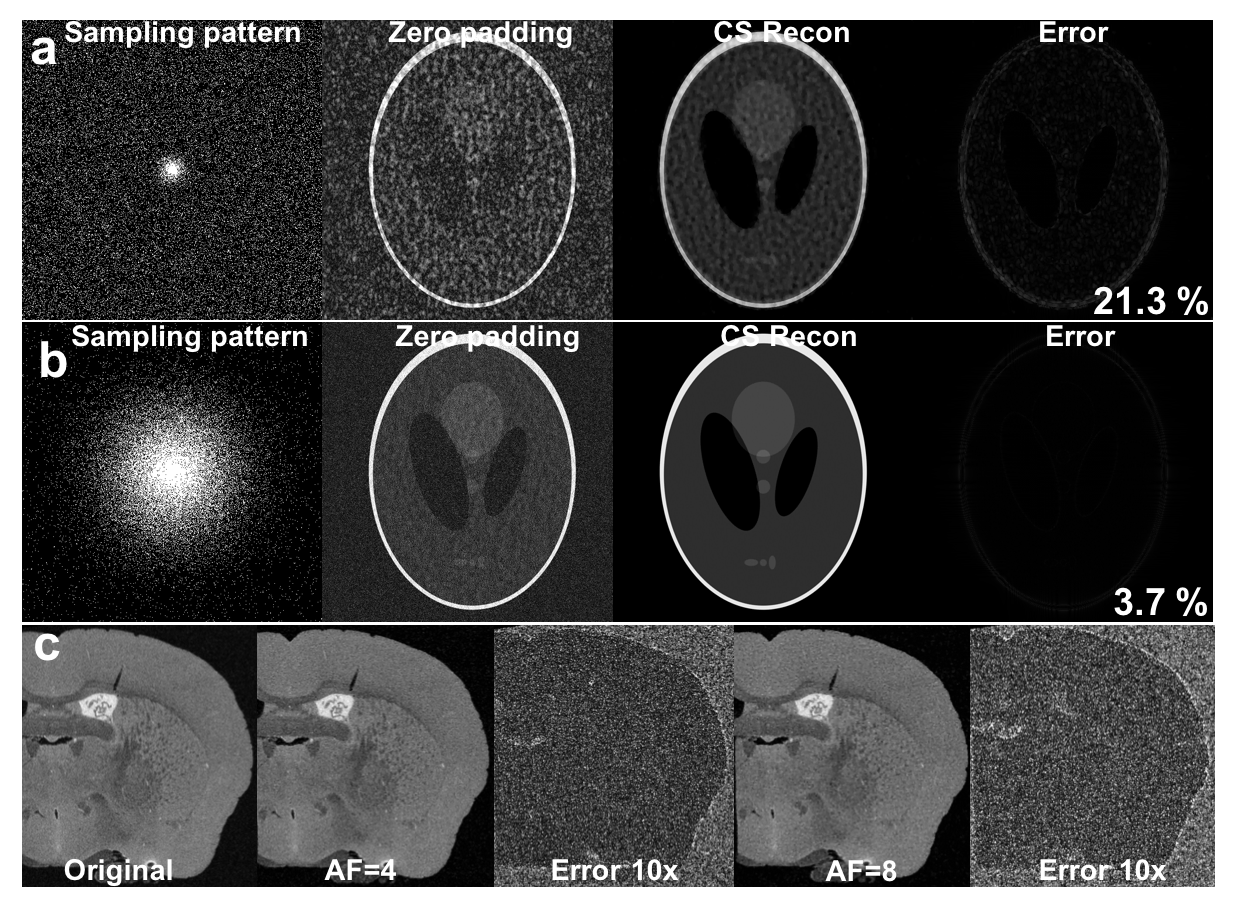
Fig 1. Simulation results using
different k-space sampling patterns and different acceleration factors. (a and b)
show the simulation results with different CS k-space sampling patterns. (c)
shows the CS reconstruction mouse with optimized SPk with
acceleration factor of 4 and 8.
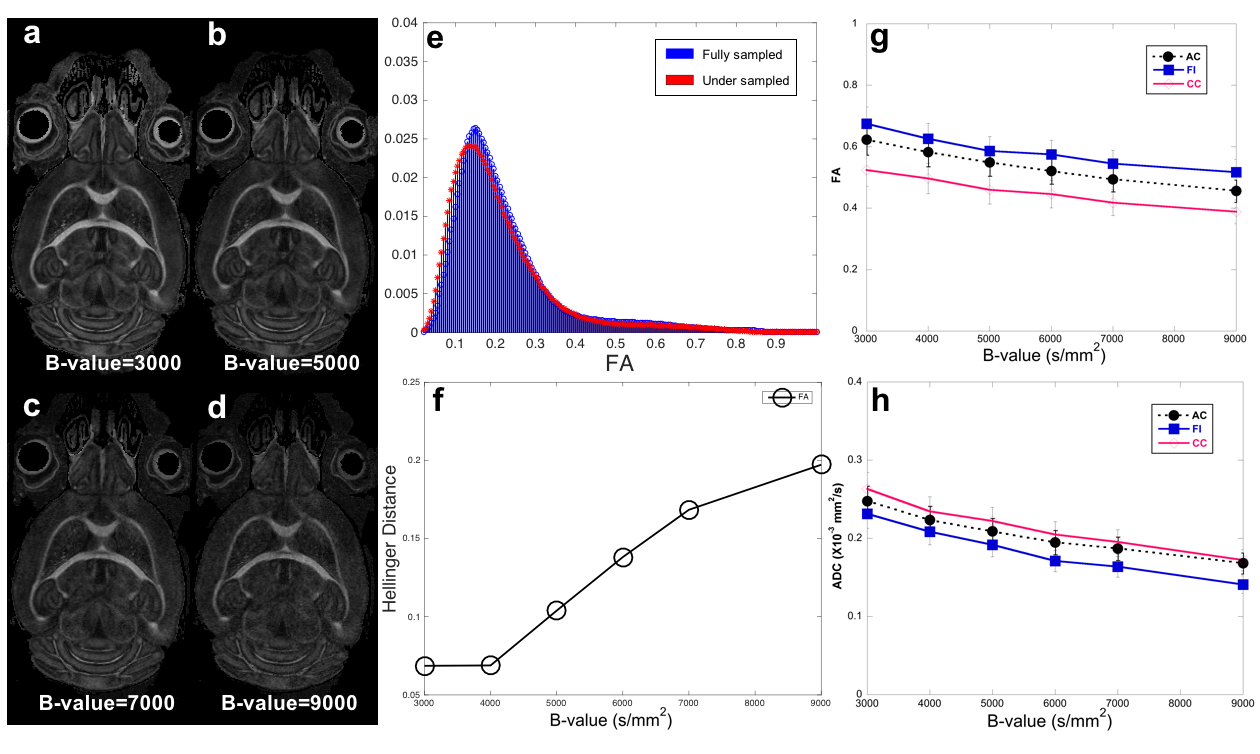
Fig 2. b-value dependence of both FA
and ADC values. (a–d) show the FA mapping at different b-values. The FA with b-value=4000
s/mm2 was compared to previous high-resolution high-angular sampled
data (e-f). The Hellinger Distance was used to assess the CS FA mapping by
comparing it with the reference mouse FA mapping (b-value=4000 s/mm2).
(g–h) illustrate the FA and ADC in different white matter structures that were
computed by DTI using different b-values. AC: anterior commissure; FI: fimbria
of hippocampus; CC: corpus callosum.
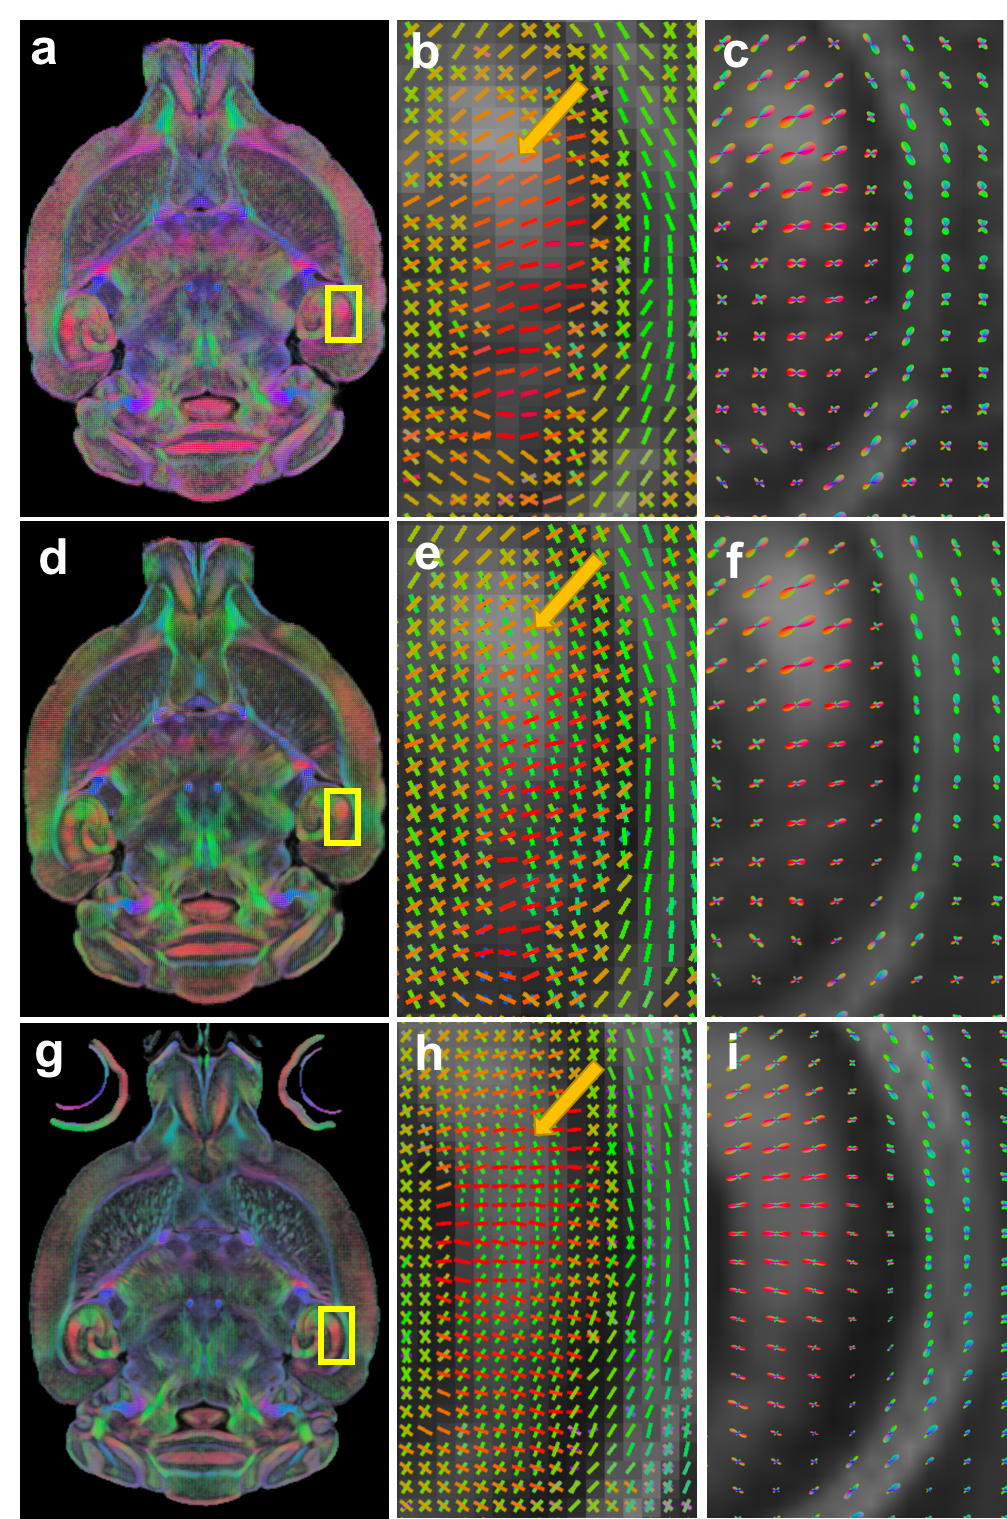
Fig 3. The generalized Q-sampling imaging
(GQI) tractography in the crossing fibers in the hippocampus: (a-c)
compressed sensing results from single-shell reconstruction; (d–f) compressed
sensing results from multi-shell reconstruction; (g–i) fully sampled results
from single-shell with 120 diffusion gradients. Orientation distribution function
shows very similar distribution between CS and fully sampled data.
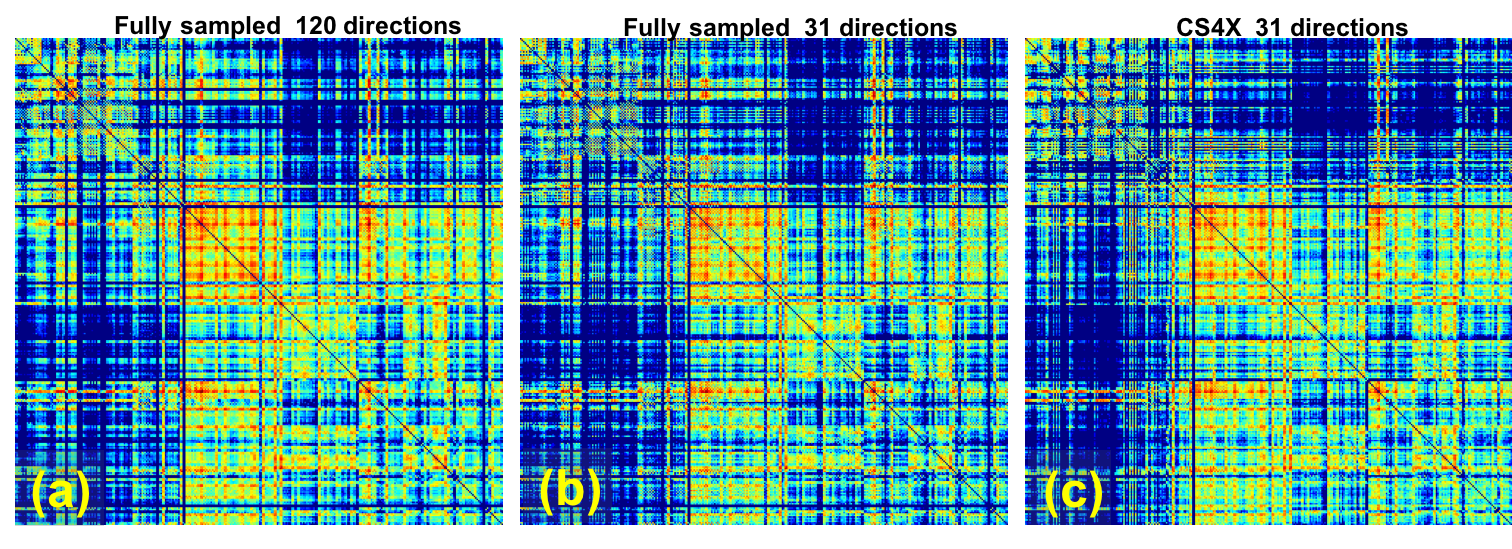
Fig 4. Deterministic tractography
connectivity matrix for the mouse brain: (a) fully sampled data with 120
diffusion directions; (b) fully sampled data with 31 diffusion directions; (3)
4X compressed data with 31 diffusion directions. Relative connectivity
estimates between 166 anatomic regions are displayed with a log10
scale.