1777
Evaluation of the Quality of Eddy-Currents and EPI Distortion Correction for Diffusion MRI: A Dataset for Benchmarking1Quantitative Medical Imaging Section, NIBIB/NIH, Bethesda, MD, United States, 2SQUITS/NICHD/NIH, Bethesda, MD, United States, 3Henry Jackson Foundation, Bethesda, MD, United States, 4NIH MRI Research Facility, National Institute of Neurological Disorders and Stroke, National Institutes of Health, Bethesda, MD, United States
Synopsis
In recent years, numerous methodologies have been proposed for the correction of motion, eddy-currents and echo planar imaging (EPI) distortions for diffusion MRI data. The typical strategy to assess the quality of these corrections is to compare them to an undistorted image, such as a T1-weighted or T2-weighted structural image, with different quality measures such as outlines, similarity metrics or segmentation overlaps. Even though several of these measures are quantitative, the use of wide range of validation strategies in combination with data with significantly different distortion properties complicates a direct comparison of these techniques. In this work, we propose a quantitative, unbiased and robust strategy to evaluate the performances of these correction techniques and provide a publicly available benchmarking dataset.
Introduction
Since the early days of diffusion MRI, it has been well-known fact that diffusion weighted images suffer from motion & eddy-currents induced distortions that cause misalignment among different volumes. These distortions significantly affect the quality of the computed diffusion model such as the diffusion tensor (DTI) high angular resolution (HARDI) based features [1]. It is widely accepted in the community that these distortions must be corrected to perform a reliable analysis. Numerous methodologies have been proposed to remedy these distortions ranging from simple affine registration [2,3] and physically based quadratic distortion models [4] to quadratic registration with predicted diffusion signals [5]. In the past decade, echo planar imaging distortions, including concomitant field distortions [6] and susceptibility distortions [7] have also been considered as another important confound that significantly affects the computed scalar maps [8] or fiber tractography [9]. Several methodologies to correct for these distortions ranging from field-mapping [7], elastic registration [8,10] and blip-up blip down phase encoding [11-14] have also been proposed. Reliable evaluation of these correction strategies, for both eddy currents and EPI distortions is a challenging task as most of these publications employed datasets with varying distortion levels and different quality assessment strategies. In this work, we propose a quantitative and robust evaluation methodology for both eddy-currents and EPI distortion correction techniques and provide an accompanied dataset acquired with specific experimental design requirements for all methods in consideration.Materials
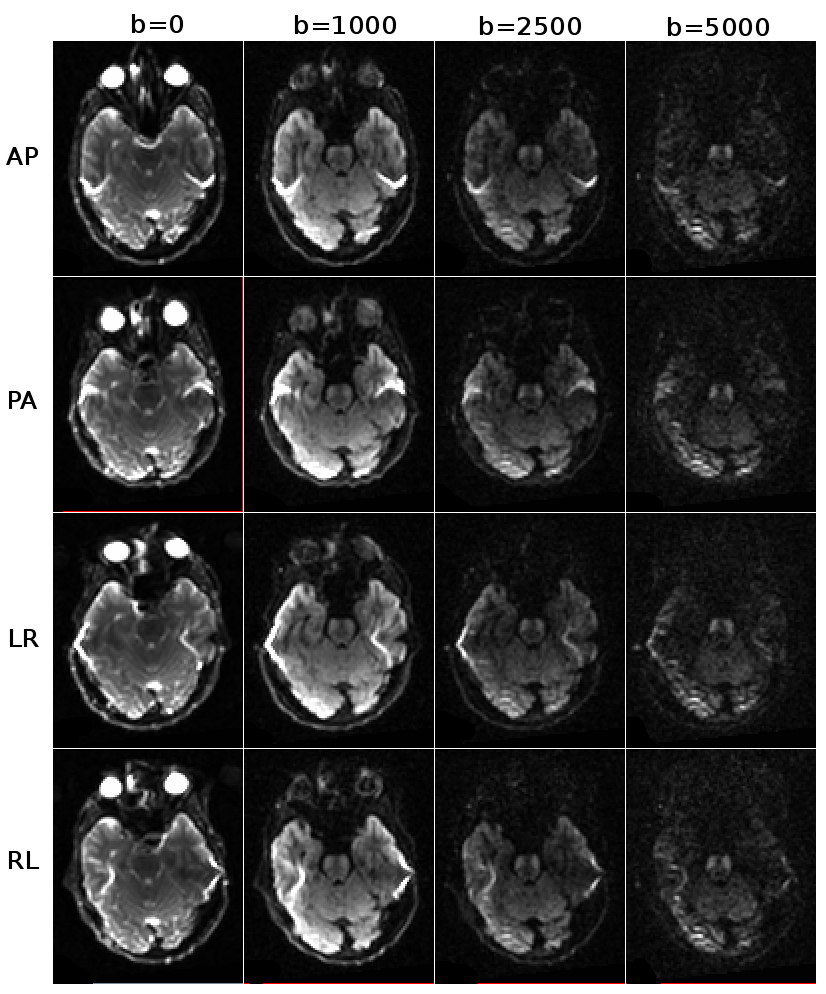
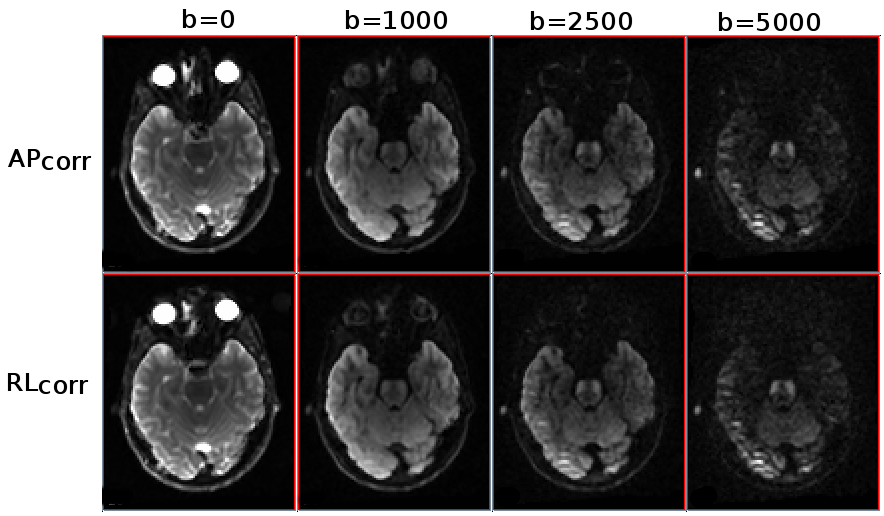
DWIs were collected from a single healthy volunteer on a 3T Siemens Prisma scanner with a single-shot spin-echo EPI sequence (resolution=2.5mm isotropic, matrix size=96x96, 64 slices, TR/TE=9300/89ms). Twice-refocusing was disabled and a GRAPPA factor of 2 was used. A single acquisition session consisted of 3 volumes with b=0 s/mm2 and 30 diffusion weighted volumes (33 volumes). This acquisition was repeated for three b-values: b=1000 s/mm2, b=2500 s/mm2, b=5000 s/mm2, with identical diffusion gradients (99 volumes). This set was reacquired with identical diffusion gradient orientations but with different diffusion gradient polarity, from the southern hemisphere of diffusion sphere (198 volumes) to create an ideal acquisition scheme for approaches such as eddy [5]. This set was subsequently repeated for four different phase encoding: AP, PA, RL, LR (792 volumes). Finally, to introduce motion artifacts, the volunteer was told to move his head to different orientations and all the acquisitions were repeated to obtain three main head orientations, which yielded a total of 2376 volumes. Additionally, a T1-weighted and T2-weighted structural image was also acquired. The entire acquisition was performed in four sessions and took 9 hours. Figure 1 displays the raw images for the three b-values and four phase encoding directions for a given gradient direction. Figure 2 displays the versions corrected for eddy-currents distortions with the approach in [4] and EPI distortions with [14].Methods
Displacements due to both eddy-currents and EPI distortions are mostly along the phase encoding direction. Under ideal conditions, displacements due to eddy current distortions are identical in norm but in opposite directions when the diffusion gradient direction polarity or the phase encoding direction is reversed. Similarly, for EPI distortions, the displacements occur along the same axis, with the same amount, but in different directions for AP-PA and RL-LR. Therefore, theoretically, given a distortion correction scheme, either for eddy currents or EPI distortions, the corrected versions of these images, APcorr, PAcorr, RLcorr, LRcorr, should be identical (disregarding the noise). Thus, a potentially robust, intuitive and quantitative metric to assess the quality of a correction scheme is the voxelwise variance of these four images after correction. With a perfect correction methodology, these variance maps would appear as noise maps and the presence of any structures would indicate a bias in the tested correction algorithm.
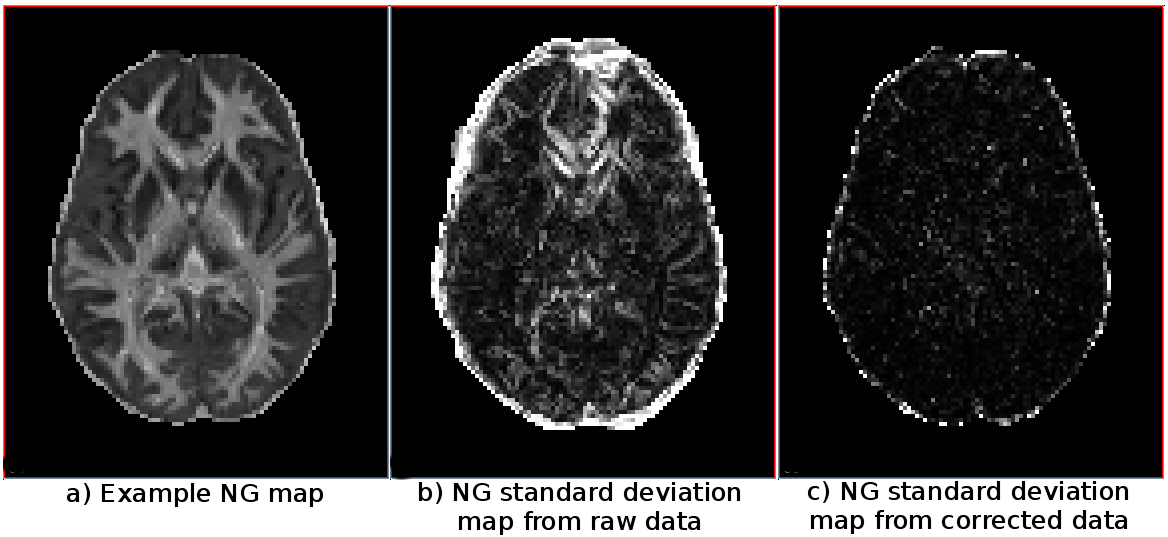
An example quality assessment: To illustrate the proposed quality assessment framework, we performed a MAP-MRI [15] based diffusion propagator estimation using the raw distorted data (Figure 1) and the corrected version (Figure 2) and extracted the non-gaussianity (NG) measures. NG was selected for this test due to its sensitivity to misalignments in the data. Figure 3 displays the standard deviation maps for both the distorted and corrected cases, where the corrected version’s lower and unstructured variance values indicate significant improvements over the raw data.
Conclusions
A standardized quality evaluation strategy and dataset is of crucial importance to assess the performances of different motion, eddy currents and EPI distortion correction methodologies. The proposed framework along with the accompanied dataset is robust and quantitative and is an ideal candidate for benchmarking these techniques.Acknowledgements
Support for this work included funding from the Congressionally Directed Medical Research Programs (CDMRP).References
1. Pierpaoli., C. , 2010, Chapter 18, Artifacts in Diffusion MRI, In Derek Jones, Diffusion MRI, ISBN: 9780195369779.
2. Jezzard P, Barnett AS, Pierpaoli C. Characterization of and correction for eddy current artifacts in echo planar diffusion imaging. Magn Reson Med 1998; 39: 801–812.
3. Mohammadi S, Möller HE, Kugel H, Müller DK, Deppe M., Correcting eddy current and motion effects by affine whole-brain registrations: evaluation of three-dimensional distortions and comparison with slicewise correction., Magn Reson Med. 2010 Oct;64(4):1047-56. doi: 10.1002/mrm.22501.
4. Rohde GK, Barnett AS, Basser PJ, Marenco S, Pierpaoli C. Comprehensive approach for correction of motion and distortion in diffusion-weighted MRI. Magn Reson Med 2004; 51: 103–114.
5. Jesper L. R. Andersson and Stamatios N. Sotiropoulos. An integrated approach to correction for off-resonance effects and subject movement in diffusion MR imaging. NeuroImage, 125:1063-1078, 2016.
6. Du YP, Joe Zhou X, Bernstein MA. , Correction of concomitant magnetic field-induced image artifacts in nonaxial echo-planar imaging., Magn Reson Med. 2002 Sep;48(3):509-1
7. Jezzard, P., Balaban, R.S., 1995. Correction for geometric distortion in echo-planar images from B0 field variations. Magn. Reson. Med. 34, 65–73.
8. Wu, M., Chang, L. C., Walker, L., Lemaitre, H., Barnett, A. S., Marenco, S., Pierpaoli, C., 2008. Comparison of EPI distortion correction methods in diffusion tensor MRI using a novel framework. Proceedings of MICCAI 11, 321–329.
9. Irfanoglu, M. O., Walker, L., Sarlls, J., Marenco, S., Pierpaoli, C., 2012. Effects of image distortions originating from susceptibility variations and concomitant fields on diffusion MRI tractography results. Neuroimage 15 (61), 275–288.
10. Tao, R., Fletcher, P. T., Gerber, S., Whitaker, R. T., 2009. A variational image- based approach to the correction of susceptibility artifacts in the alignment of diffusion weighted and structural MRI. Information Processing in Medi- cal Imaging 21, 651–663.
11. Bowtell, R. W., McIntyre, D. J. O., Commandre, M. J., Glover, P. M., Mans- field, P., 1994. Correction of geometric distortion in echo planar images. In: Proceedings of 2nd Annual Meeting of the SMR. San Francisco, p. 411.
12. Andersson, J. L., Skare, S., Ashburner, J., 2003. How to correct susceptibility distortions in spin-echo echo-planar images: Application to diffusion tensor imaging. NeuroImage 20 (2), 870–888.
13. Holland, D., Kuperman, J. M., Dale, A. M., 2010. Efficient correction of inho- mogeneous static magnetic field-induced distortion in echo planar imaging. Neuroimage 50, 175–183.
14. Irfanoglu MO, Modi P, Nayak A, Hutchinson EB, Sarlls J, and Pierpaoli C. DR-BUDDI (Diffeomorphic Registration for Blip-Up blip-Down Diffusion Imaging) method for correcting echo planar imaging distortions. NeuroImage 106 (2015) 284–299.
15. Özarslan E, Koay CG, Shepherd TM, Komlosh ME, Irfanoglu MO, Pierpaoli C, and Basser PJ. (2013) Mean Apparent Propagator (MAP) MRI: a novel diffusion imaging method for mapping tissue microstructure.Neuroimage 78:16-32.
Figures