1774
Clinically Feasible Optic Nerve Diffusion Basis Spectrum Imaging at 3T1Translational and Molecular Imaging Institute, Icahn School of Medicine at Mount Sinai, New York, NY, United States, 2Department of Radiology, Icahn School of Medicine at Mount Sinai, New York, NY, United States, 3Graduate School of Biomedical Sciences, Icahn School of Medicine at Mount Sinai, New York, NY, United States, 4Department of Radiology, Washington University, Saint Louis, MO, United States, 5Department of Neurology, Washington University, Saint Louis, MO, United States, 6Department of Neuroscience, Icahn School of Medicine at Mount Sinai, New York, United States
Synopsis
Optic nerve MRI is susceptible to eyeball movement. The relatively long acquisition time of advanced diffusion MRI (dMRI) methods exacerbates the motion sensitivity in optic nerve dMRI and limits the clinical implementation of these methods. In this work, we evaluate a short (less than 2.5 min per eye) single slice coronal optic nerve dMRI acquisition protocol at 3T and propose a 2D optic nerve center searching algorithm customized for such dMRI data. We demonstrate improved optic nerve center contrast after image alignment and the expected benefits of reduced partial volume effects from diffusion basis spectrum imaging (DBSI) analysis.
Purpose
Advanced diffusion MRI (dMRI) acquisition and signal
modeling, such as diffusion basis spectrum imaging (DBSI)1, hold the
promise to offer microstructural information specific to axonal degeneration
that is not accessible with conventional dMRI methods, such as diffusion tensor
imaging (DTI). However, these advanced dMRI methods typically require relatively
dense q-space sampling. Consequently, the longer dMRI acquisition time limits integration
into routine clinical neuroradiology protocol. The challenge of shortening the
dMRI acquisition time is especially salient for clinical optic nerve MRI
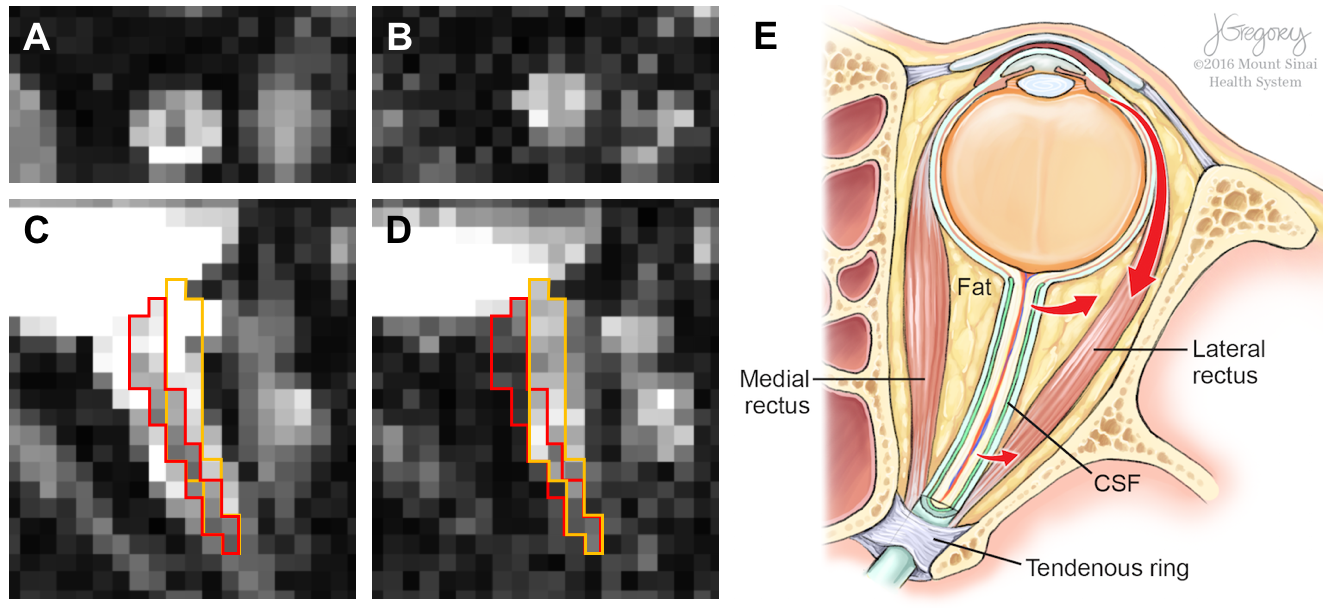
protocol, because of the unavoidable eyeball movement-induced non-linear optic
nerve movement2 (Fig. 1)
during the dMRI acquisition and the competing requirement of high resolution to
resolve the small optic nerve. Here, we present a short clinically-feasible (less
than 2.5 min for each eye) optic nerve dMRI acquisition protocol at 3T and the associated
optic nerve center alignment procedure, and demonstrate sufficient data quality
for DBSI modeling.Methods
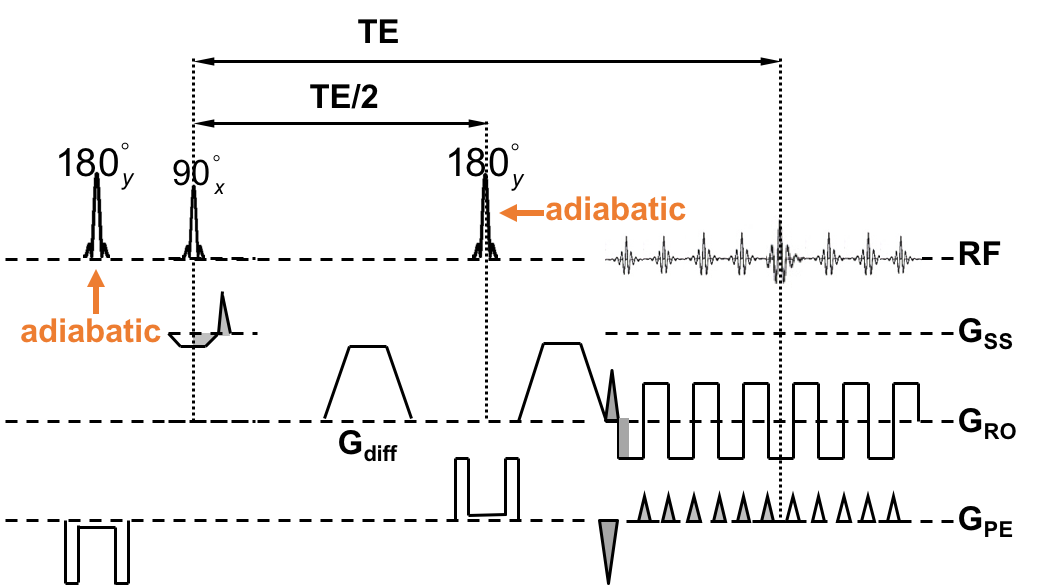
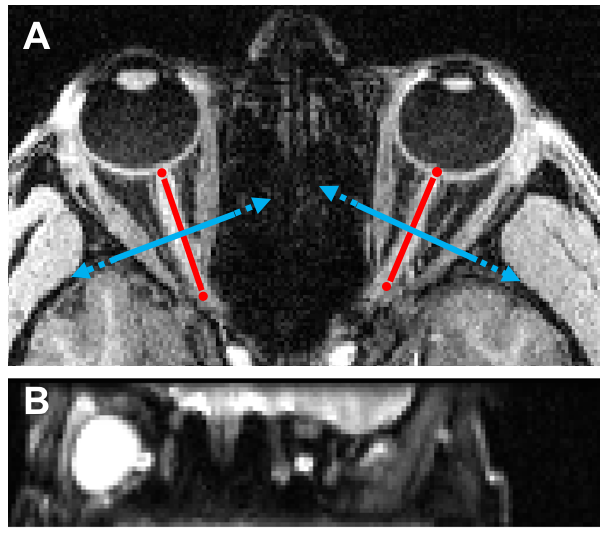
MRI: Optic nerve dMRI data were acquired in five healthy adult subjects on a 3T scanner (Trio, Siemens) with a 32-ch head coil (12 anterior receive elements only). An inner-volume-imaging spin echo EPI diffusion sequence modified from our previous implementation3 (Fig. 2) was used to acquire reduced field-of-view (FOV) optic nerve images at 1.3 mm × 1.3 mm in-plane resolution, FOV=166 mm x 41.5 mm, matrix=128 x 32, single 3 mm thick slice (coronal slice positioned perpendicular to and at the center of the intraorbital optic nerve, Fig. 3), phase-encoding (PE) direction=foot->head, 6/8 partial Fourier, echo spacing=0.87 ms, ETL=24 (20.9 ms), bandwidth=1346 Hz/Px, TR/TE=2500/56 ms, monopolar diffusion encoding, optimized 25 multi-bval (linearly spaced) multi-bvec diffusion scheme with bmax=1000 s/mm2 and two b0, two effective averages with alternating diffusion gradient polarity, Tacq=2 min 20 sec per eye. The two sequence modifications included (i) implementation of hyperbolic secant (HS) adiabatic inversion/refocusing pulses for improved slab profile in the PE direction and (ii) placement of the second inversion/refocusing pulse immediately before the excitation pulse to reduce the time interval between the two inversion/refocusing pulses.
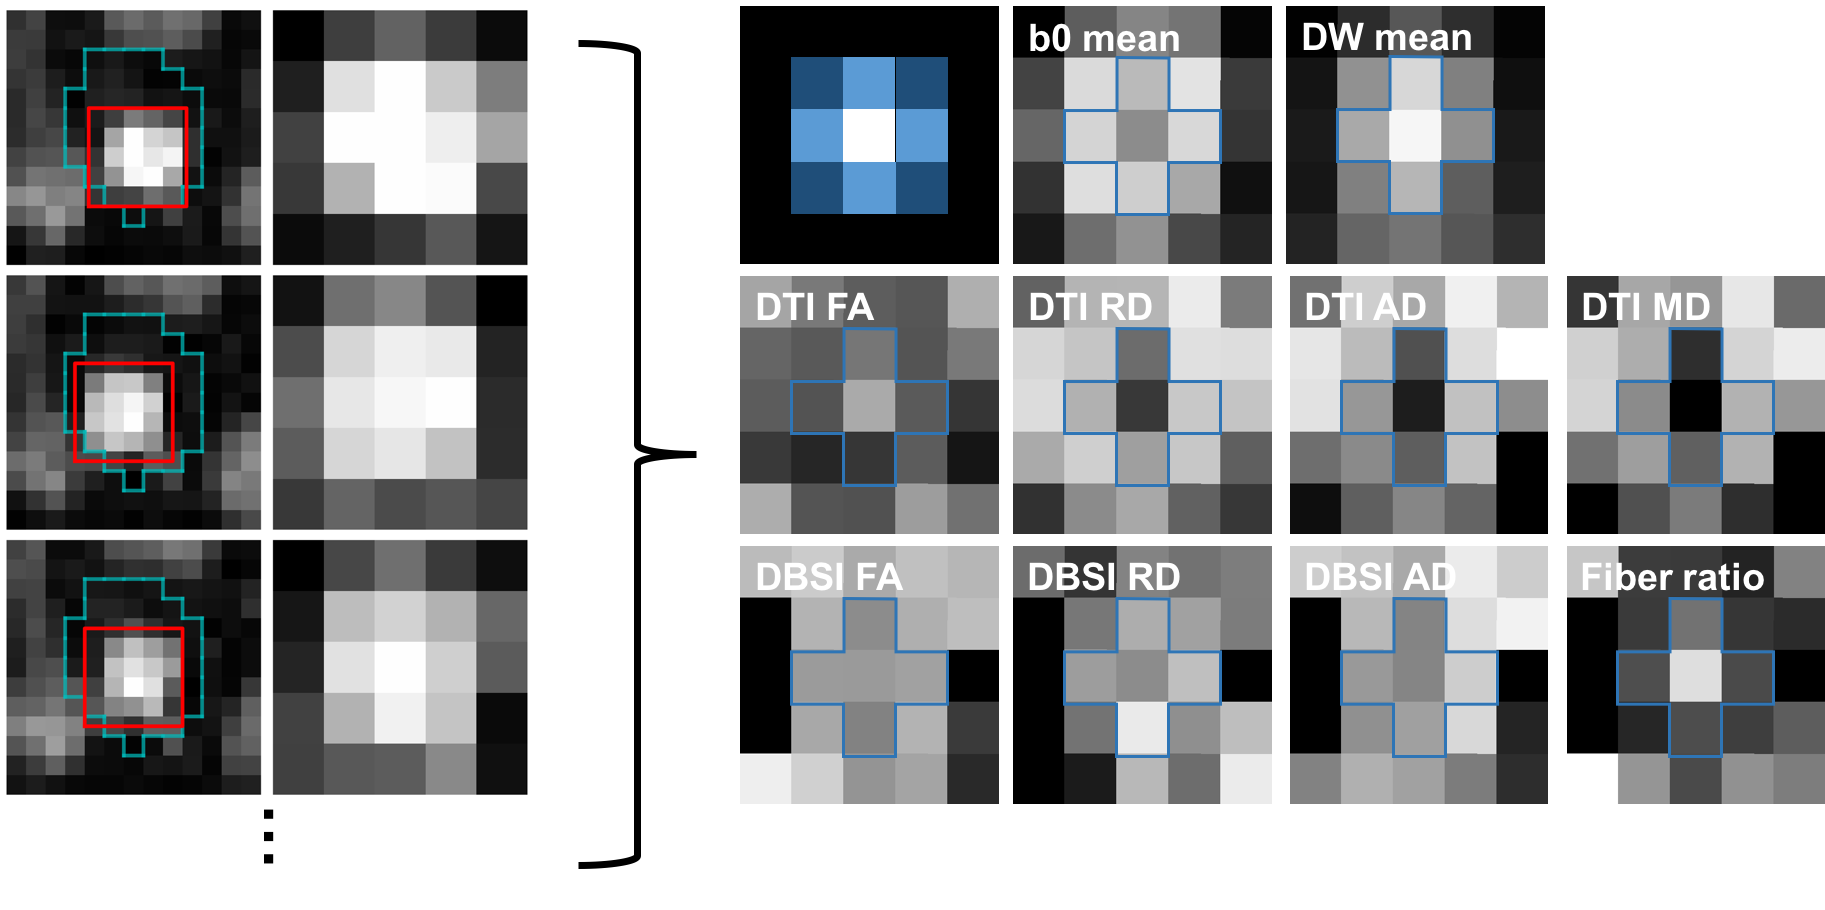
Optic nerve center alignment: A manual mask for all dMRI frames was drawn including the optic nerve but excluding extraocular muscles for image alignment (Fig. 4, cyan color). On each frame, the optic nerve center was defined on 0.1 voxel unit space (spline interpolation) within the mask region by finding a square 5×5 (voxel) kernel whose sum of image intensities was maximal (Fig. 4, red color). The center of the 5×5 kernel was assigned as the optic nerve center and the image intensity was resampled to the original voxel resolution. The resulting 5×5 kernel from each dMRI frame were concatenated for diffusion signal modeling.
Diffusion analysis: DBSI/DTI maps were generated using an in-house MATLAB program. The region-of-interest (ROI) of the optic nerve was the center voxel of the 5×5 kernel.
Results
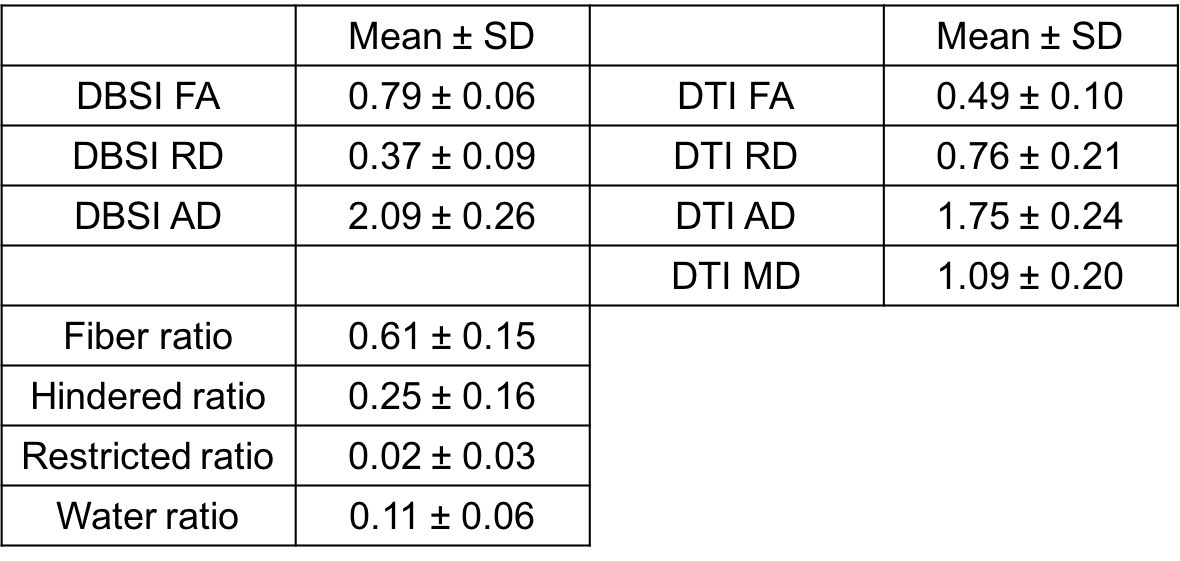
Sufficient optic nerve contrast to the surrounding suppressed fat signal allows definition of the optic nerve (including CSF and dura) for every dMRI frame (Fig. 4). The optic nerve center is hypointense compared to the surrounding CSF on the mean b0 frames of the registered optic nerve (Fig. 4, b0 mean), while the optic nerve center is hyperintense on the mean of diffusion-weighted (DW) frames (Fig. 4, DW mean). The DBSI maps also showed the expected contrast of optic nerve center (e.g., Fig. 4, fiber ratio). The DBSI results at the optic nerve center were comparable to our previous studies in mouse optic nerve4 and human brain white matter5 and demonstrated the expected robustness to partial volume effects as compared to DTI results (Table 1).Discussion
Partial volume effects from the surrounding CSF is a significant confound in optic nerve dMRI (even at 1.3 mm isotropic resolution as we have previously shown), especially for atrophic optic nerves due to chronic neurodegeneration6,7. Advanced dMRI methods capable of modeling multiple tissue compartments, such as DBSI, can alleviate CSF contamination to offer more specific and less biased microstructure parameters. However, clinical applicability of optic nerve DBSI has been hampered by higher q-space sampling and data quality requirements. We addressed this limitation by implementing a short single slice coronal optic nerve dMRI protocol with specific optimization in dMRI acquisition and optic nerve center alignment. Compared to previous coronal optic nerve dMRI studies8,9, our individualized optic nerve acquisition allows slice positioning perpendicular to each nerve for better optic nerve center definition using our proposed searching algorithm.Conclusion
High resolution optic nerve DBSI with sufficient data quality can be achieved with a short (<2.5 min) single slice coronal optic nerve dMRI protocol at 3T for clinical neuroradiology integration.Acknowledgements
NIH/NINDS R21NS090910 and NIH/NEI U01EY025500References
1. Wang, Y. et al, Quantification of increased cellularity during inflammatory demyelination, Brain, 2011; 134(12) 3587-3598.
2. Kim, J.-W. et al, Non-linear Distortion Correction in Human Optic Nerve Diffusion Imaging, Proceedings of 24th International Society for Magnetic Resonance in Medicine. 2016; poster #2054.
3. Xu, J. et al, Assessing optic nerve pathology with diffusion MRI: from mouse to human, NMR Biomed. 2008; 21(9):928-40.
4. Wang, X. et al, Diffusion basis spectrum imaging detects and distinguishes coexisting subclinical inflammation, demyelination and axonal injury in experimental autoimmune encephalomyelitis mice, NMR Biomed. 2014; 27(7) 843-852.
5. Wang, Y. et al, Differentiation and quantification of inflammation, demyelination and axon injury or loss in multiple sclerosis, Brain. 2015; 138(Pt 5):1223-1238.
6. Naismith, R. T. et al, Radial diffusivity in remote optic neuritis discriminates visual outcomes, Neurology. 2010; 74(21):1702-1710.
7. Chang, S. T. et al, Optic nerve diffusion tensor imaging parameters and their correlation with optic disc topography and disease severity in adult glaucoma patients and controls, J Glaucoma. 2014; 23(8):513-520.
8. Wheeler-Kingshott, C. A. et al, ADC mapping of the human optic nerve: increased resolution, coverage, and reliability with CSF-suppressed ZOOM-EPI, Magn Reson Med. 2002; 47(1):24-31.
9. Hickman, S. J. et al, Optic nerve diffusion measurement from diffusion-weighted imaging in optic neuritis, AJNR Am J Neuroradiol. 2005; 26(4):951-956.
Figures