1773
Gray matter cellular volume fraction imaging and Alzheimer’s disease1Laboratory of Neuro Imaging, USC Mark and Mary Stevens Neuroimaging and Informatics Institute, Keck School of Medicine of USC, University of Southern California, Los Angeles, CA, United States
Synopsis
Neuronal loss is one of the major outcomes of neurodegenerative diseases such as Alzheimer’s disease (AD) [1,2]. Given the microscopic level of changes associated with neurodegeneration, it is challenging to image with conventional MRI techniques. Microstructural diffusion-weighted MRI is a powerful tool, which has been shown to be sensitive to microscopic brain tissue characteristics [3,4]. However, a relative lack of specificity has impeded its transition to clinic.
Here we focus primarily on deriving cell content information in gray matter and apply it to AD. We acquired multi-shell dMRI of two postmortem samples of human hippocampal tissue (one AD and one control) at the same time, with isotropic resolution of 200 mm, using a 16.4T scanner. We modeled signal attenuation based on the observed evidence of faster signal decay of the cellular compartment. Then, we derived the cell volume fraction by fitting the model to the data and compared it within and between our tissues.
Purpose
The aim of this project is to achieve highly sensitive and specific estimates of cell content in gray matter, focusing on AD. We test our model using ultra high-field, high resolution diffusion MRI imaging of human postmortem hippocampal tissue samples.Method
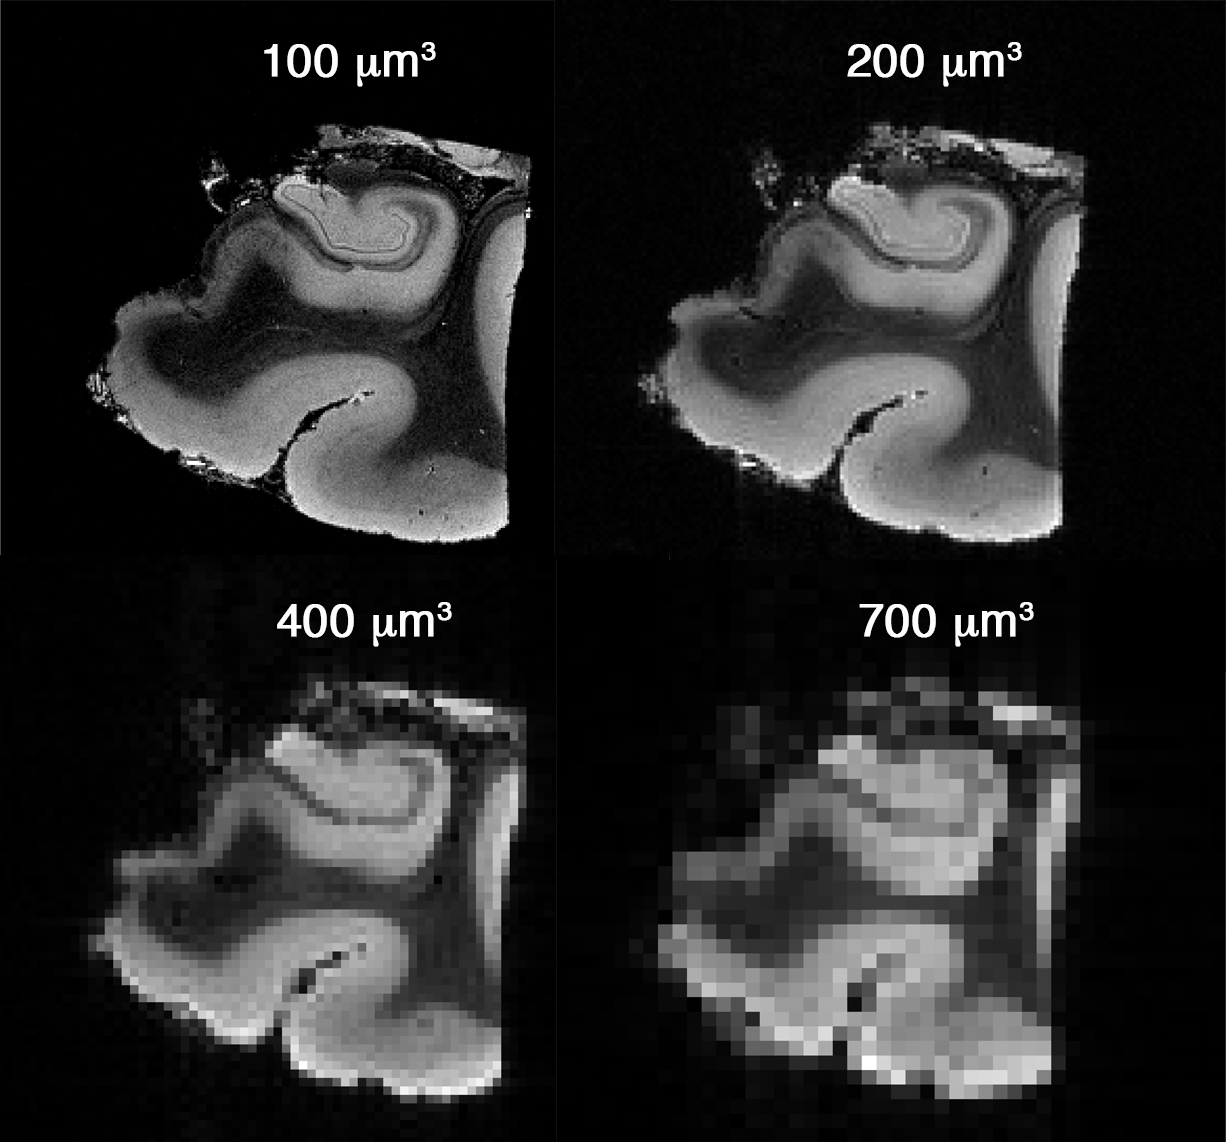
Data acquisition: Two postmortem human hippocampal tissue samples were scanned inside one tube with a 16.4 T Bruker scanner (Bruker Biospin, Germany) using a 15 mm SAW coil (M2M Imaging, USA). Prior to dMRI imaging, T2w images with different resolutions were acquired, to estimate the optimal resolution that enables hippocampal sub-field quantitative analysis. For dMRI we used a spin-echo sequence (to gain high SNR), with isotropic resolution of 200 μm, three diffusion shells with b-values 1000, 3000, 5000, with 20, 30 and 45 gradient encoding directions with distinct, spherically even distribution (with total of 6 unweighted measurements). Images were corrected for Gibbs ringing (using Trapezoid windowing) and N4 field bias (using ANTs software: http://stnava.github.io/ANTs/). dMRI data quality and signal values were visually inspected for quality control.
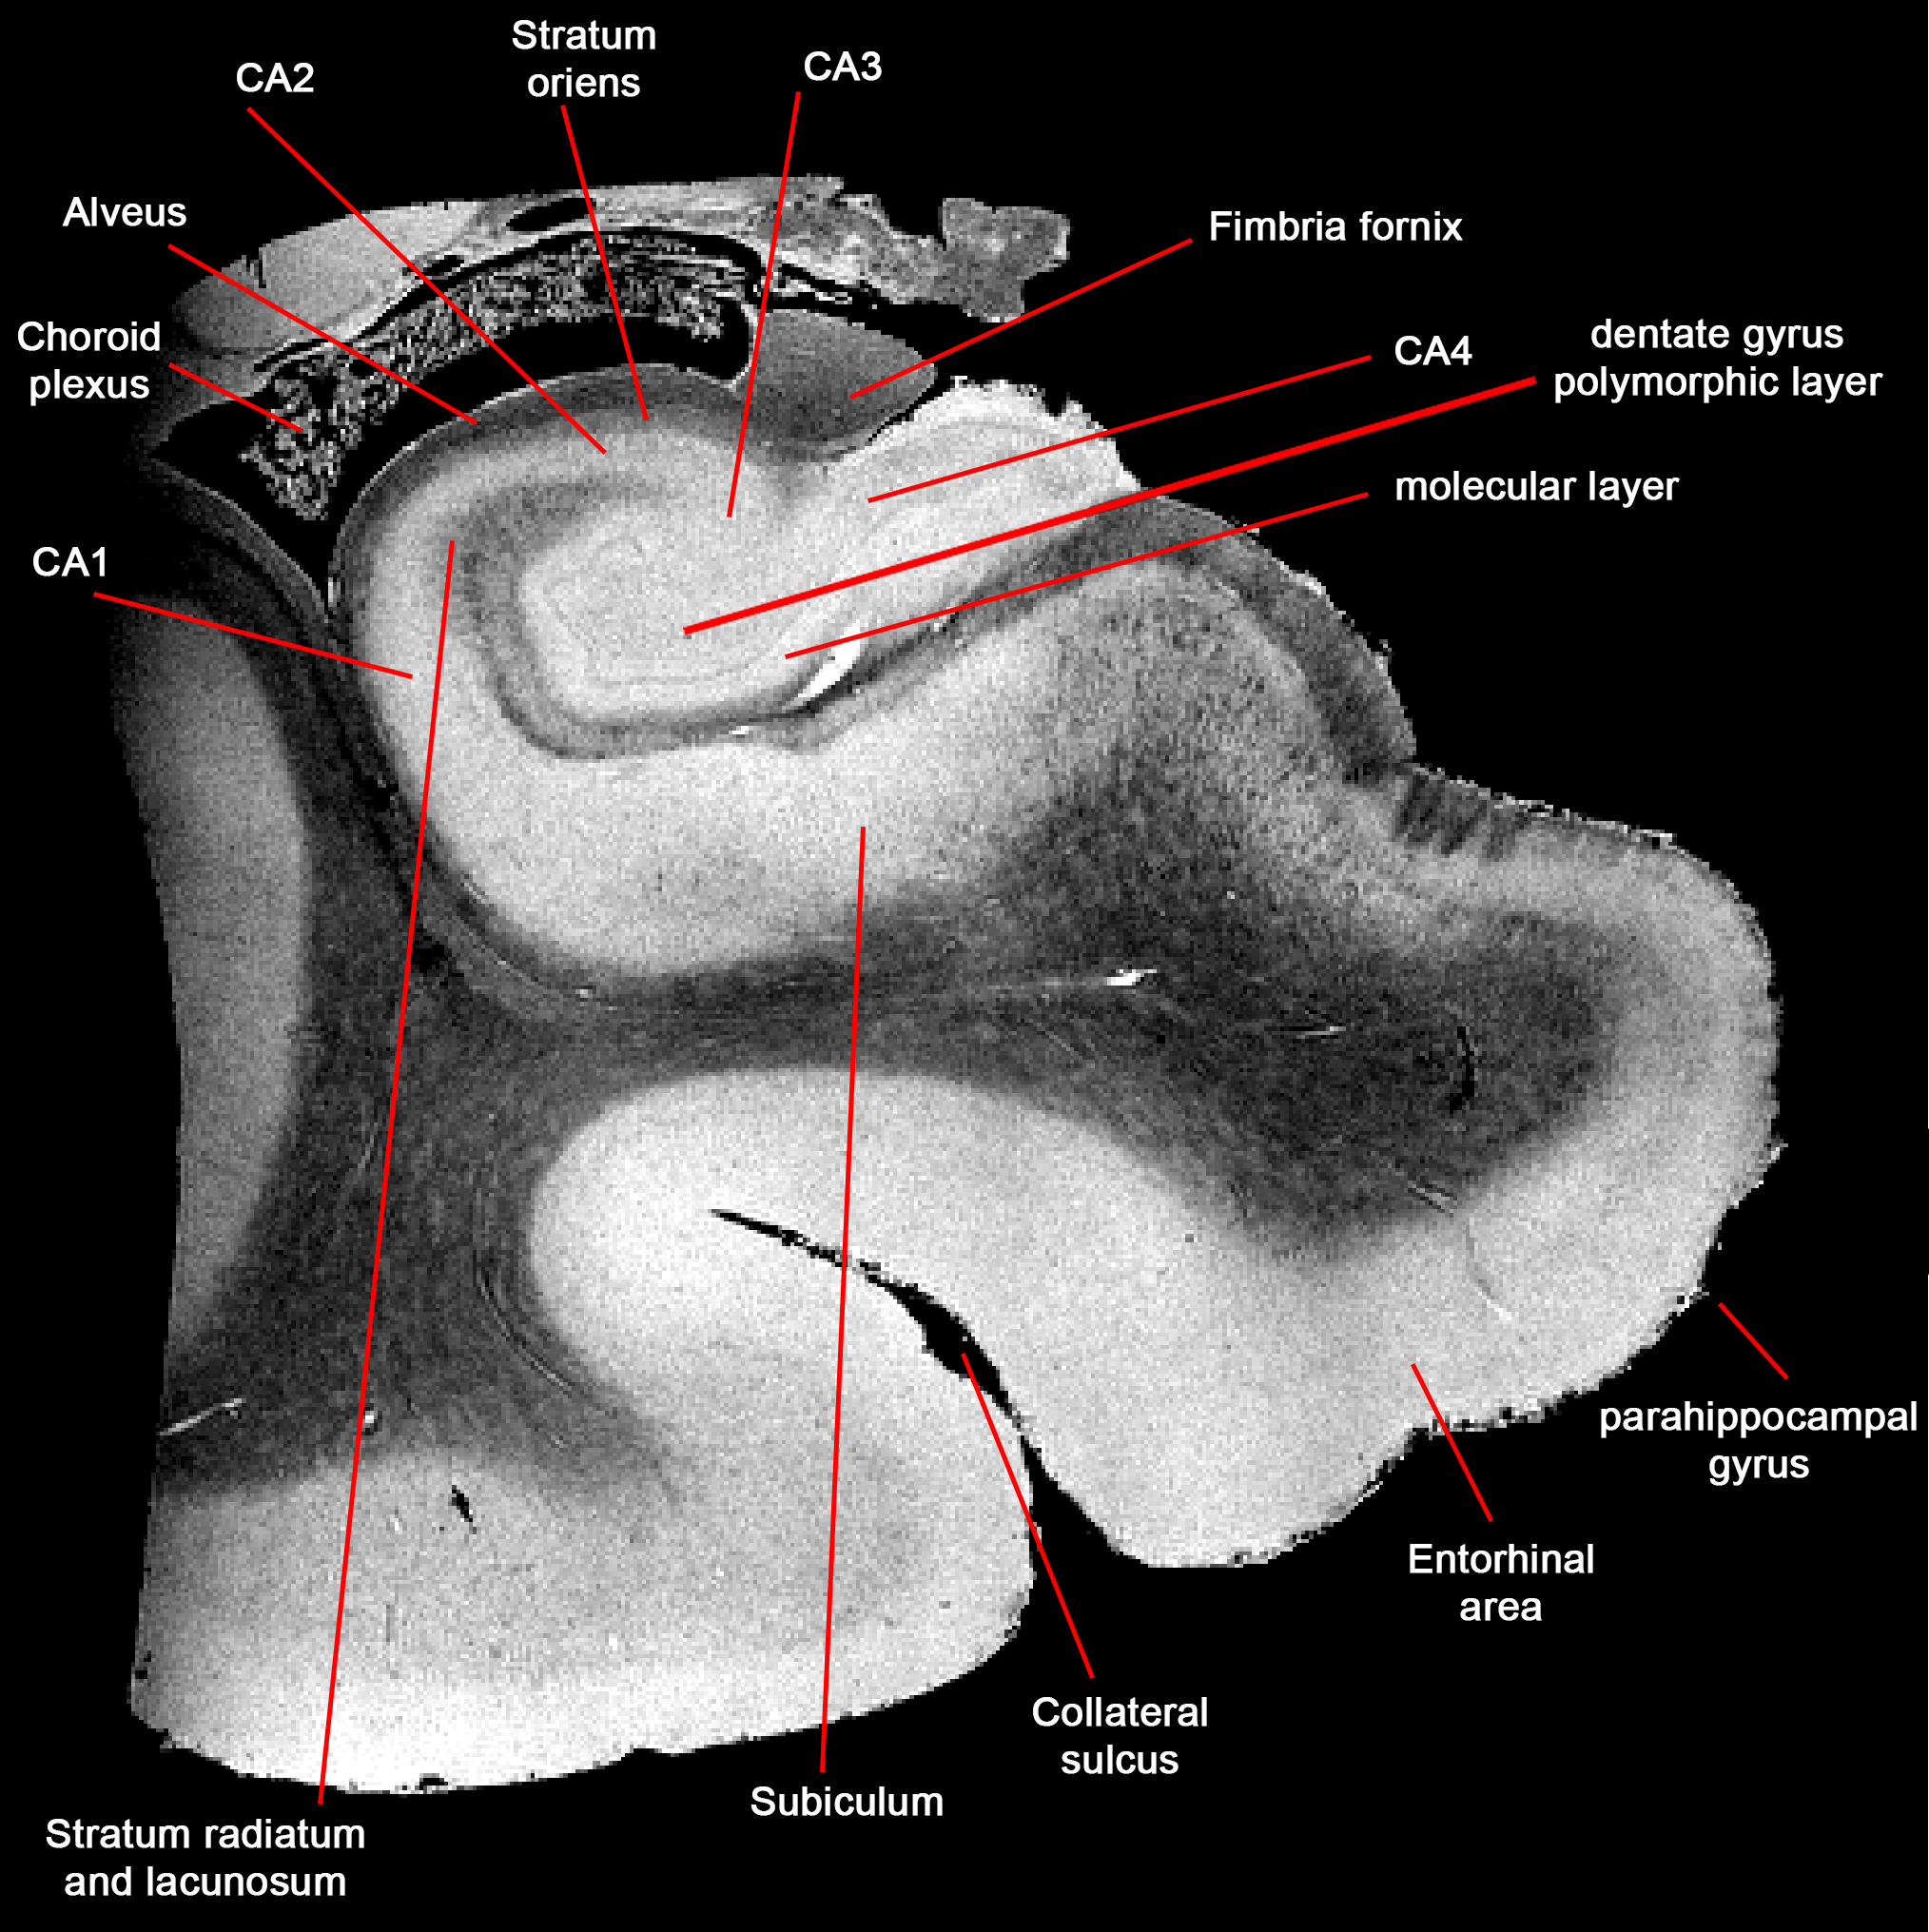
ROI and dMRI signature: We segmented different ROIs manually based on boundaries defined in Allen atlas (http://brain-map.org/). We plotted dMRI signal and explored the dMRI signature of different regions.
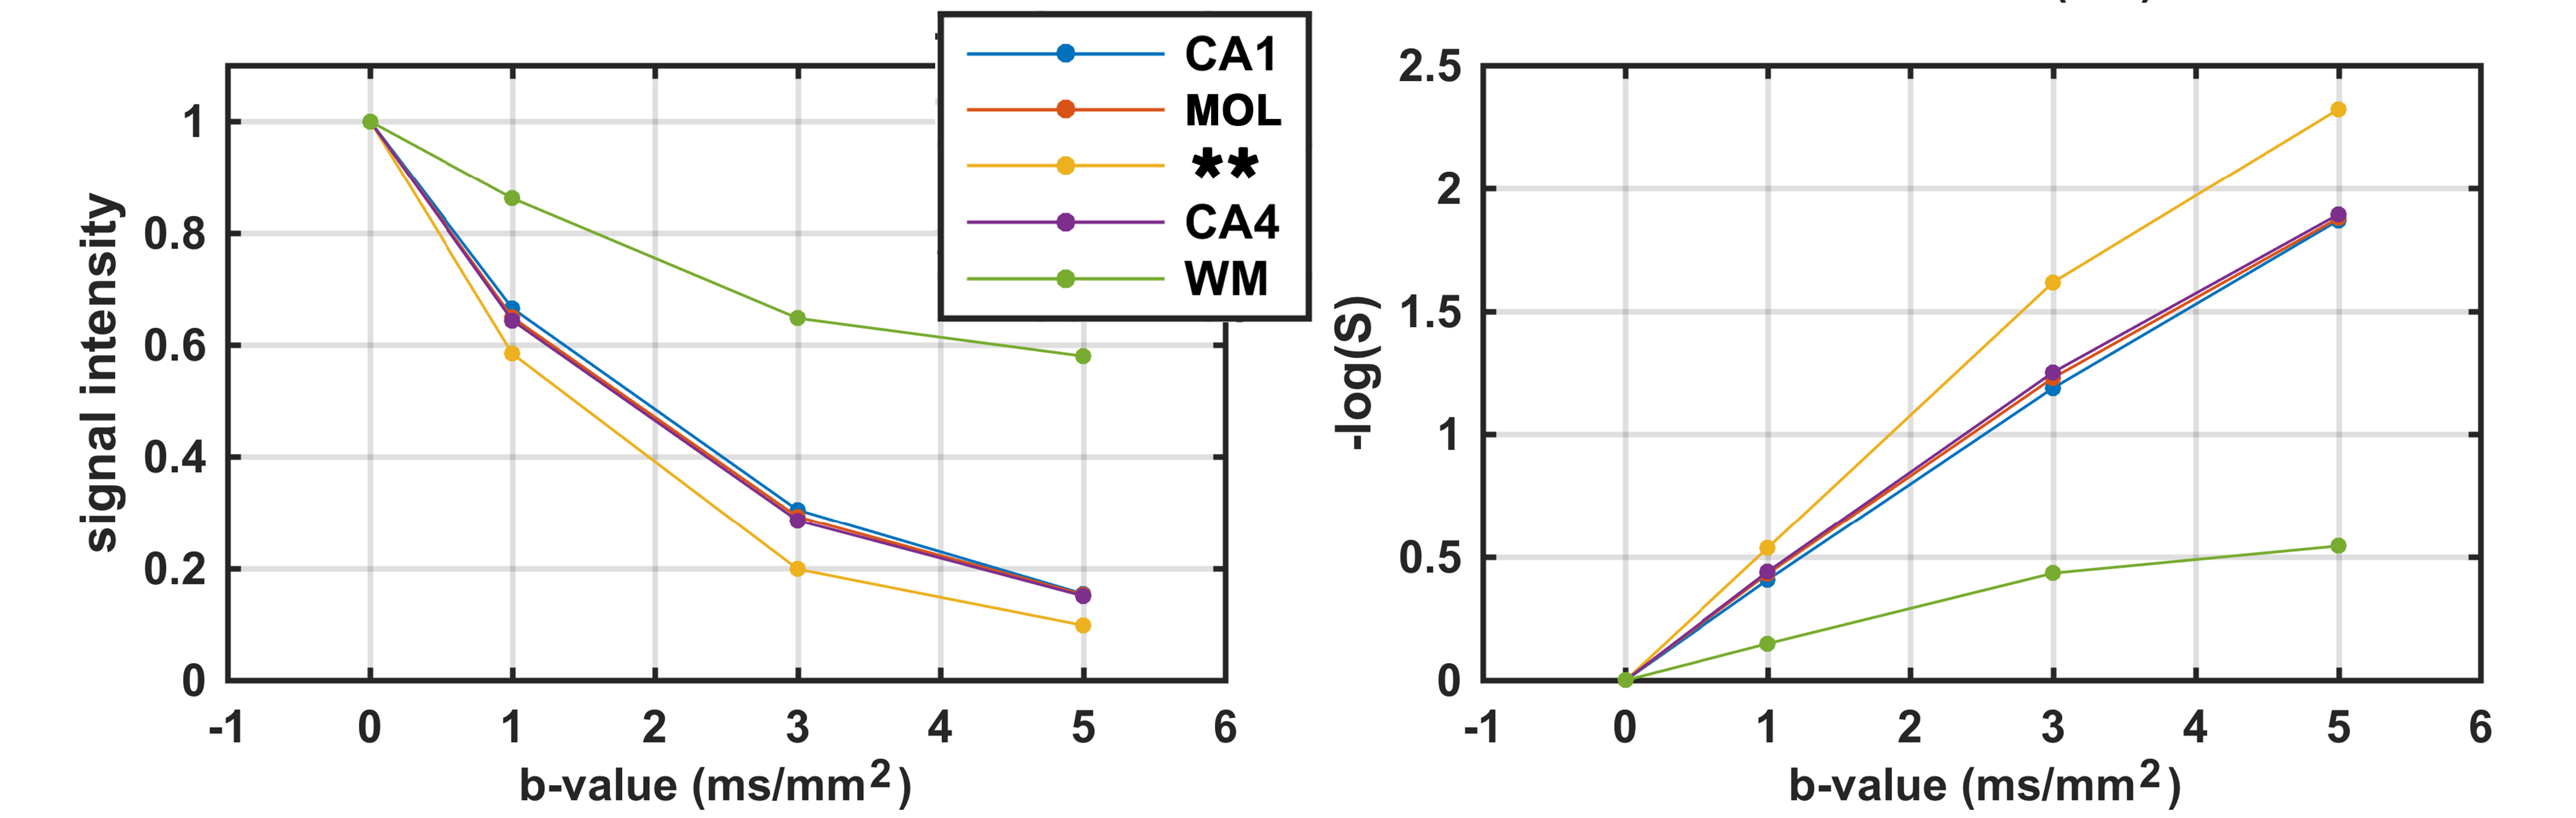
Gray matter cell volume fraction imaging: We observed a faster signal decay in regions with high cell content and therefore model tissue as a two compartment environment: 1) cellular content, with fast signal decay and 2) molecular compartment (extra-cellular) with slow signal decay (both with isotropic diffusion profile). We also included an asymptote for S(\inf). A multi-step fitting procedure was performed: first, we derived a decay rate of the molecular compartment from voxels of molecular layer of dentate gyrus. Then, we used a non-linear least square fitting routine to obtain other unknown parameters (the lower bound of decay rate for cellular compartment was set to be higher than molecular compartment).
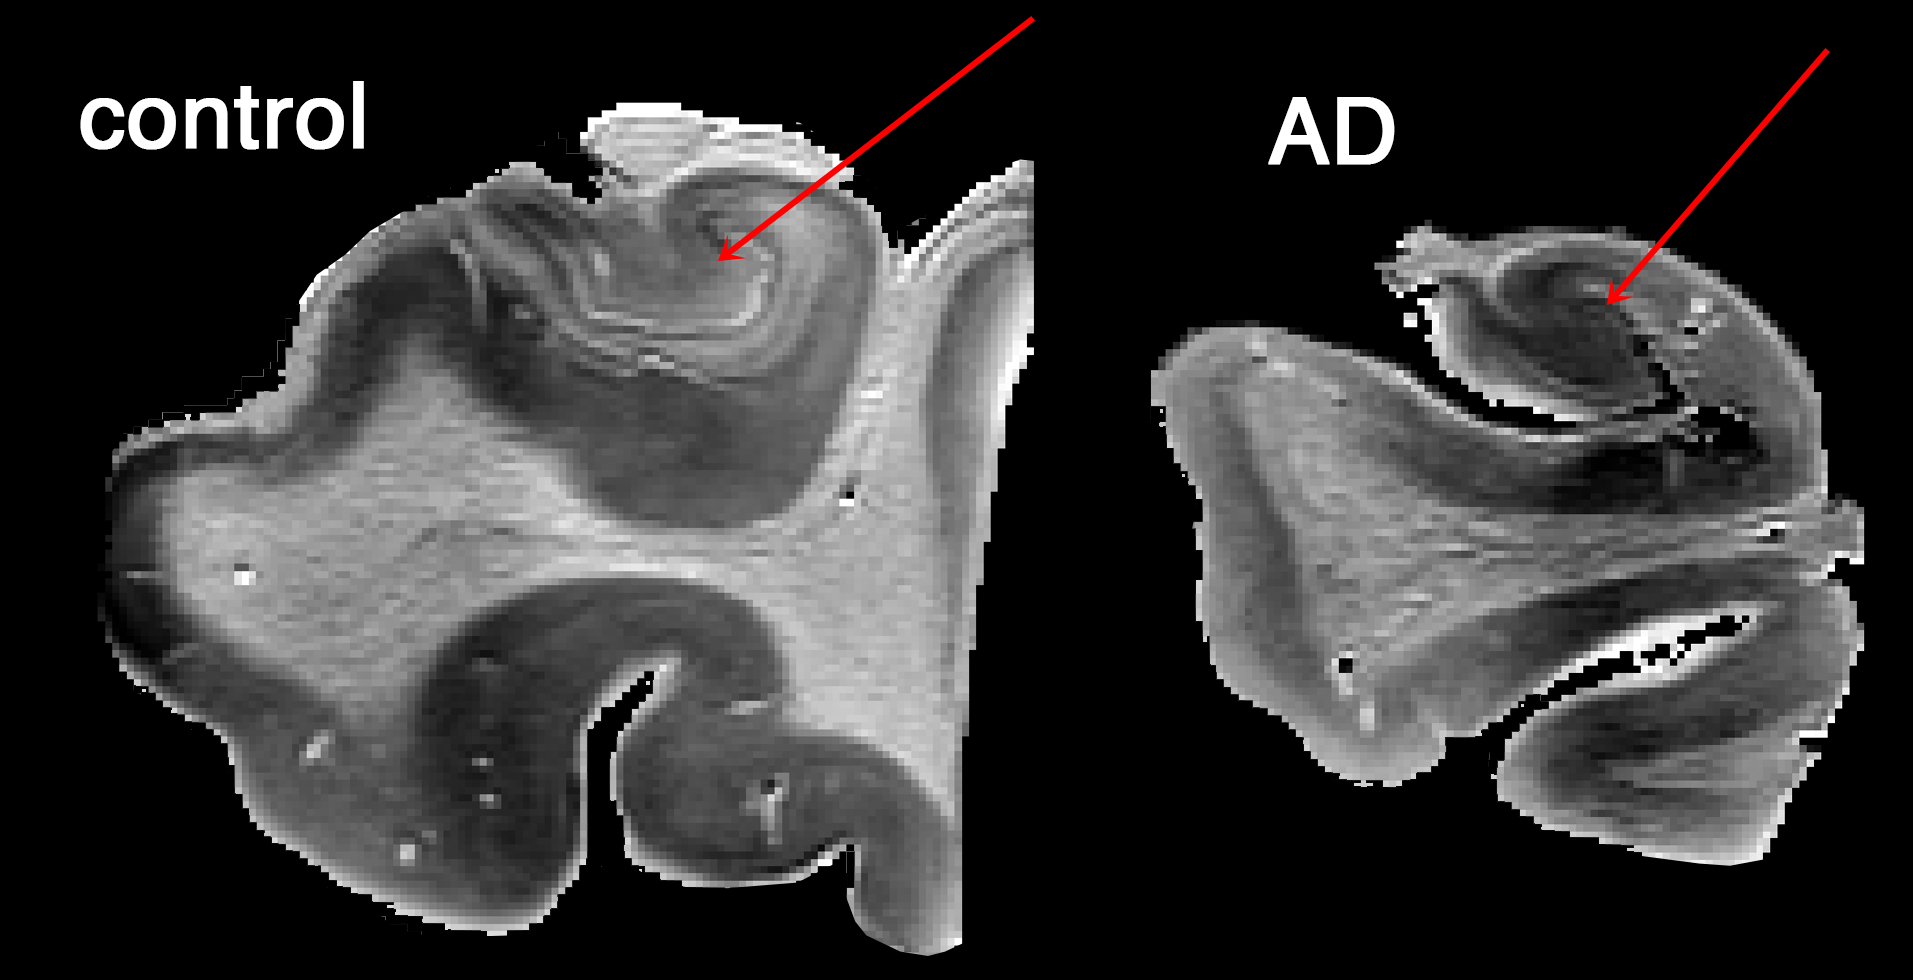
Comparing AD versus control: We compared derived cell volume fractions between AD and control across dentate gyrus/CA4, where main neuronal loss is expected in AD. All layers of dentate gyrus were included. Voxels containing boundary artifact or veins were carefully excluded.
Result and discussion
Exploring structural images (Fig.1) suggested that an acquisition with isotropic resolution of 200μm is high enough to separate sub-regions of hippocampus (Fig.2). It was important for this project to accurately separate these regions, as we aimed to draw dMRI signature across these regions. Diffusion-weighted signal showed a faster signal attenuation rate in granular cell layer of dentate gyrus, which has the highest cellular content compare to the rest of gray matter regions of hippocampus (Fig.3). Interestingly, this region is even separable from dMRI signature, while other gray matter regions appear similar.
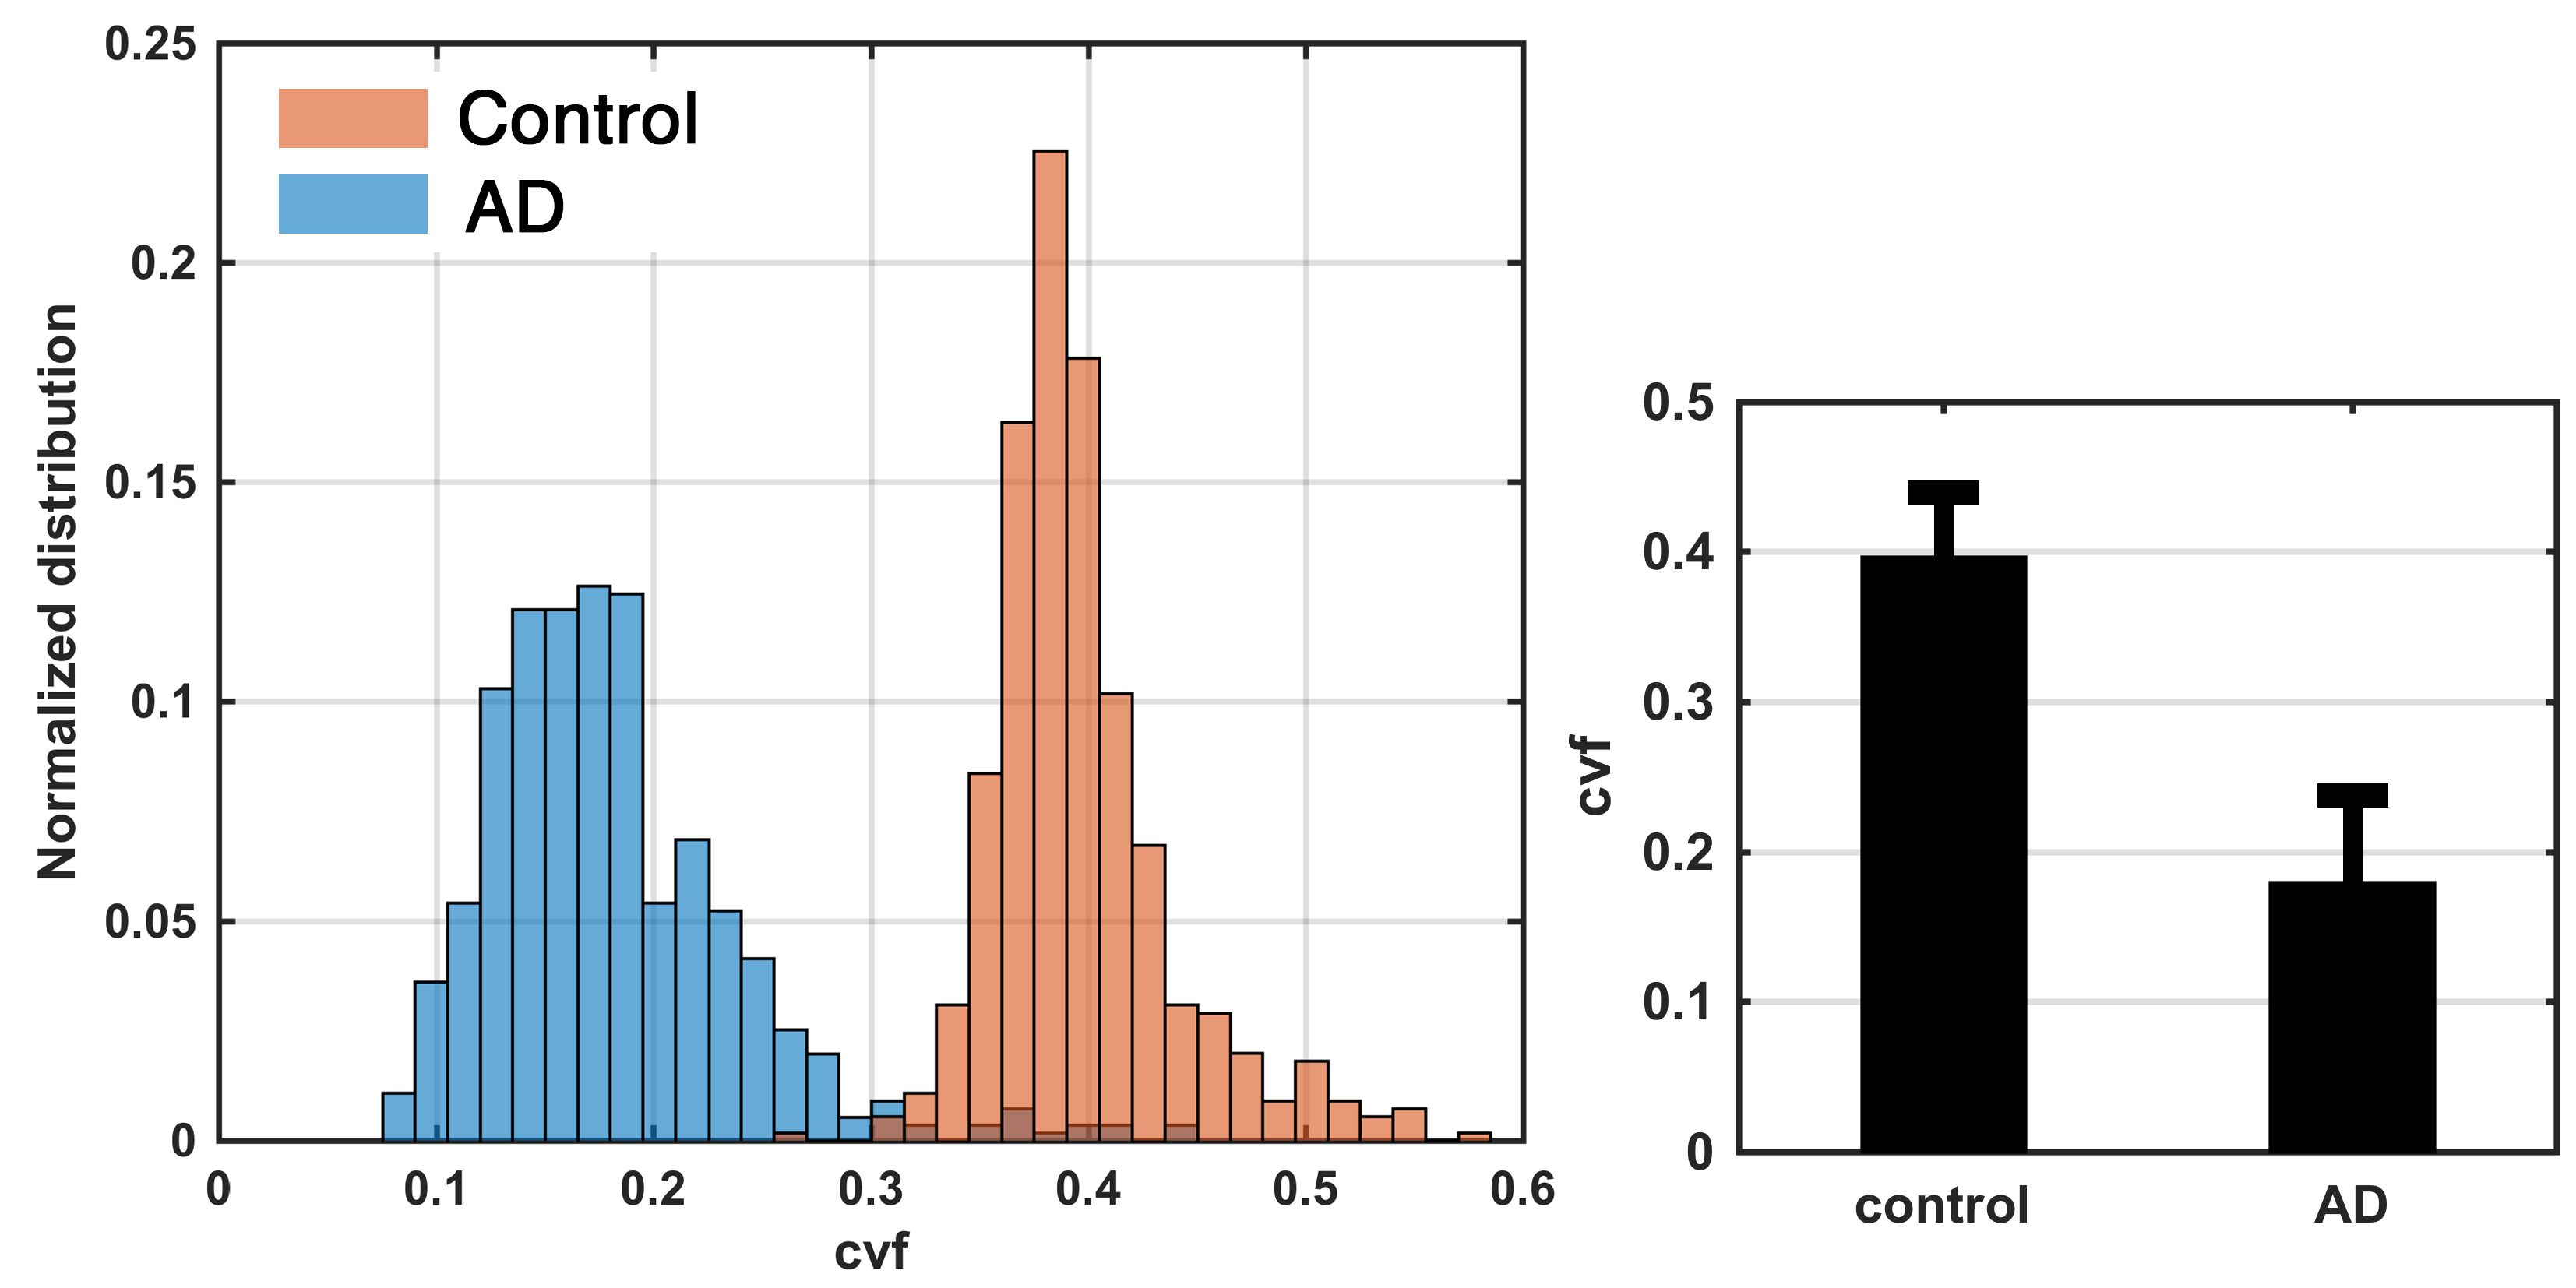
Estimated cell volume fraction corroborated the expect contrast of low-high-low in molecular-granular-polymorphic layers of dentate gyrus in healthy control (Fig.4). Estimated values were also significantly different across AD and control (Fig.5). This is also apparent in the AD map of cell volume fraction. It should be noted that values of cell volume fraction are only valid for voxels inside the gray matter (and less specific in the presence of anisotropy, unless anisotropy incorporated into the model).
Summary
Here by focusing only on gray matter and based on the evidence of fast attenuating cell-related signal, we obtained cell volume fraction. Derived values showed high sensitivity and specificity to tissue normal formation and its alteration in AD. Histological validation and transition to in vivo will be our future focus.Acknowledgements
Grant numbers: R21NS091586, R00HD065832, R01MH094343, P41EB015922, and U54EB020406References
1. Lewis, S., 2016. Neurodegenerative disease: Ever decreasing ripples. Nature Reviews Neuroscience.
2. De Strooper, B. and Karran, E., 2016. The cellular phase of Alzheimer’s disease. Cell, 164(4), pp.603-615.
3. Le Bihan, D. and Iima, M., 2015. Diffusion magnetic resonance imaging: what water tells us about biological tissues. PLoS Biol, 13(7), p.e1002203.
4. Sepehrband, F., Clark, K.A., Ullmann, J.F., Kurniawan, N.D., Leanage, G., Reutens, D.C. and Yang, Z., 2015. Brain tissue compartment density estimated using diffusion-weighted MRI yields tissue parameters consistent with histology. Human brain mapping, 36(9), pp.3687-3702.
Figures