Mami Iima1,2, Tomomi Nobashi3, Hirohiko Imai4, Sho Koyasu5, Akira Yamamoto1, Masako Kataoka1, Yuji Nakamoto1, Tetsuya Matsuda6, and Kaori Togashi1
1Department of Diagnostic Imaging and Nuclear Medicine, Graduate School of Medicine, Kyoto University, Kyoto, Japan, 2Hakubi Center for Advaned Research, Kyoto University, Kyoto, Japan, 3Graduate Schoolof Medicine, Kyoto University, Kyoto, Japan, 4Research and Educational Unit of Leaders for Integrated Medical System, Center for the Promotion of Interdisciplinary Education and Research, Kyoto University, Kyoto, Japan, 5Radiation Biology Center, Kyoto University, Kyoto, Japan, 6Department of Systems Sciece, Graduate School of Informatics, Kyoto University, Kyoto, Japan
Synopsis
The
relationship between diffusion time and diffusion parameters obtained from 7.0T
MRI using a human breast carcinoma xenograft model was investigated. There was
an increase in K values and decrease in ADCo as well as sADC values in 27.6ms
compared to 9.6 ms. Some tumor showed
heterogeneous sADC change derived from two different diffusion times.
Introduction
Diffusion
MRI is becoming an important diagnostic biomarker for the tumor
characterization as well as monitoring without the need for the contrast agents
(1), and several non-Gaussian DWI parameters can be explored which are useful
for the differentiation of malignant and benign breast lesions (2,3).
Furthermore, the different compartments of tissue molecules in the brain has
been observed with the scan using short diffusion times (4), and there was a change
of diffusion parameters noted in mice brain tumors (5,6). Diffusion hindrance
is supposed to increase with longer diffusion time, as more water molecules hit
obstacles, such as cell membranes, the density of which increases in cancer
tissues. Accordingly, our purpose was to investigate the association of
diffusion parameters obtained from 7T MRI using a Breast xenograft mouse model,
with the different diffusion times.Materials and Methods
Human Breast
cell line MDAMB231 cells (1x10⁶) were injected to the hind limbs of
10 ICR nu/nu mice. All of them developed tumors in 6 weeks, and they were
imaged on a 7T MRI scanner (Bruker, Germany) using a 1H quadrature
transmit/receive volume coil. The SE-EPI acquisition parameters were set as
follows; Resolution 250 x 250μm², matrix size 100 x 100,
field of view 25 x 25 mm² , slice thickness 1.5 mm, TE=46.9ms, TR=2500 ms, 8 averages, 4 segments.
DWI MRI images were acquired using 2 different diffusion times (diffusion
gradient duration(δ): 7.2ms, and diffusion
gradient separation(Δ): 12ms and 30ms, resulting in
the effective diffusion time: 9.6 and 27.6ms) and 19 b values (from 7 to 4105
sec/mm²). The acquisition time for each b value was 80 seconds, and the total
acquisition time was 50 min 40 sec. Data analysis was performed using a code
developed in Matlab
(Mathworks, Natick, MA). ROIs were drawn in tumors according to the contrast patterns observed on
anatomical and DWI images. Diffusion parameters were retrieved for each ROI.
Signals
acquired for each diffusion time at b>500 s/mm to remove IVIM effects was
fitted using the non-Gaussian diffusion kurtosis model (2):
S(b)=[S0²{ exp [-bADC0+(bADC0)²K/6]}²+NCF]1/2 [1]
where NCF (noise correction factor) a
parameter which characterizes the “intrinsic” non-Gaussian noise contribution within
the images (2).
A composite, synthetic ADC was also
calculated as: sADC = ln
[S(Lb)/S(Hb)]/(Hb-Lb) [2]
where Lb is a “low key b value”, Hb is a
“high key b value” optimized to get the highest overall sensitivity to ADCo and
K (7). For this study the Low and High key b values were 438 and 2584s/mm²,
respectively. The diffusion/IVIM parameters with the different diffusion times
were compared using Mann-Whitney
test.
Results
ADCo
value significantly decreased (p=0.008)
and K value significantly increased (p<0.001)
when the diffusion time increased from 9.6 ms to 27.6 ms (Figure 1). There was a
significant decrease of sADC value (p=0.016)
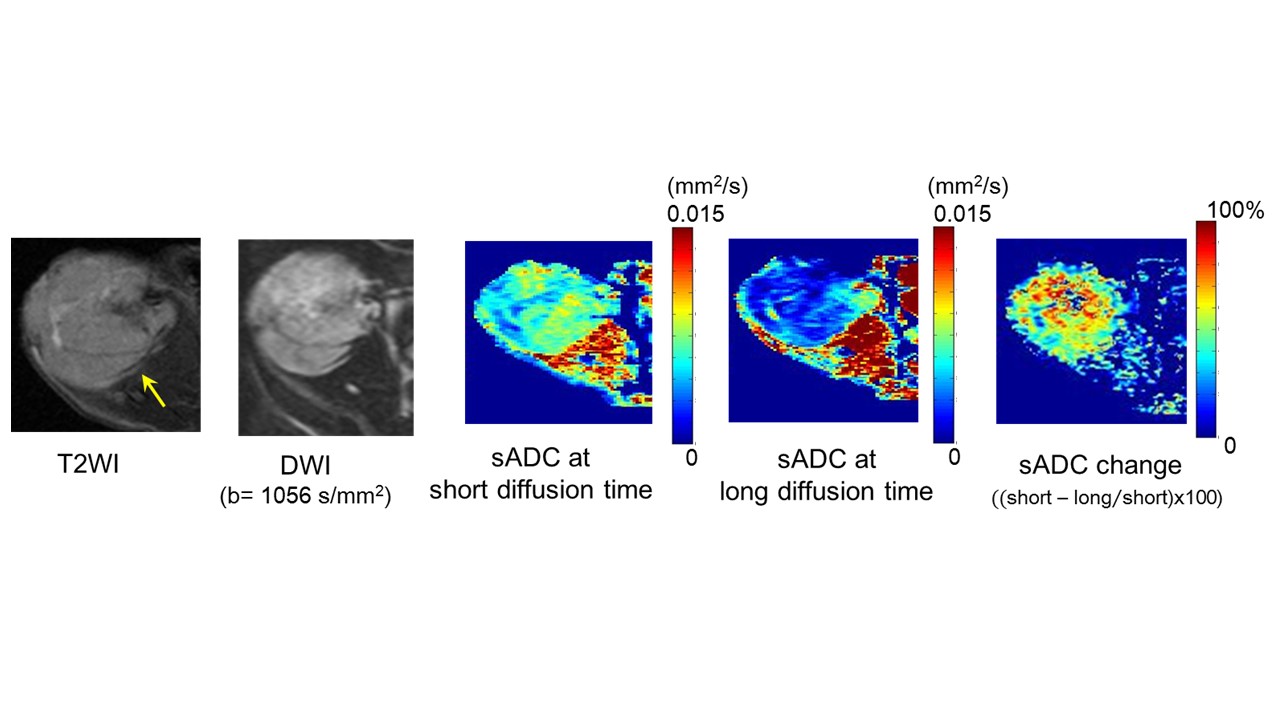
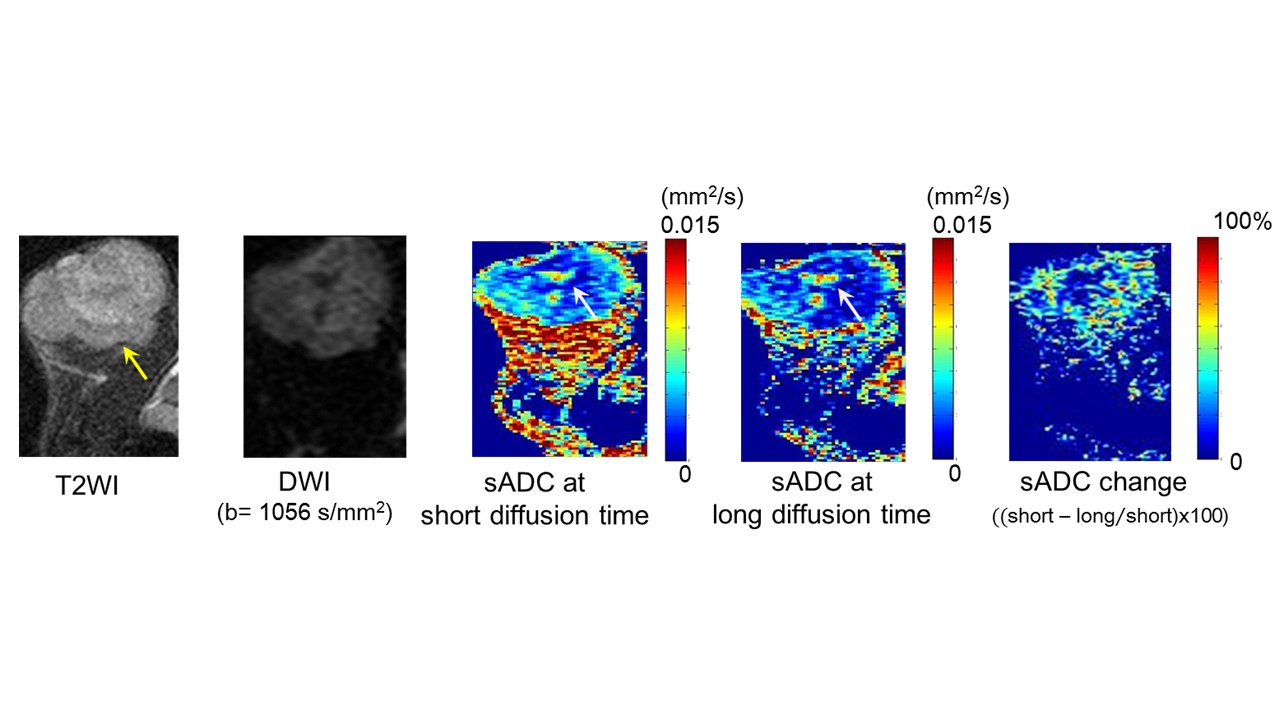
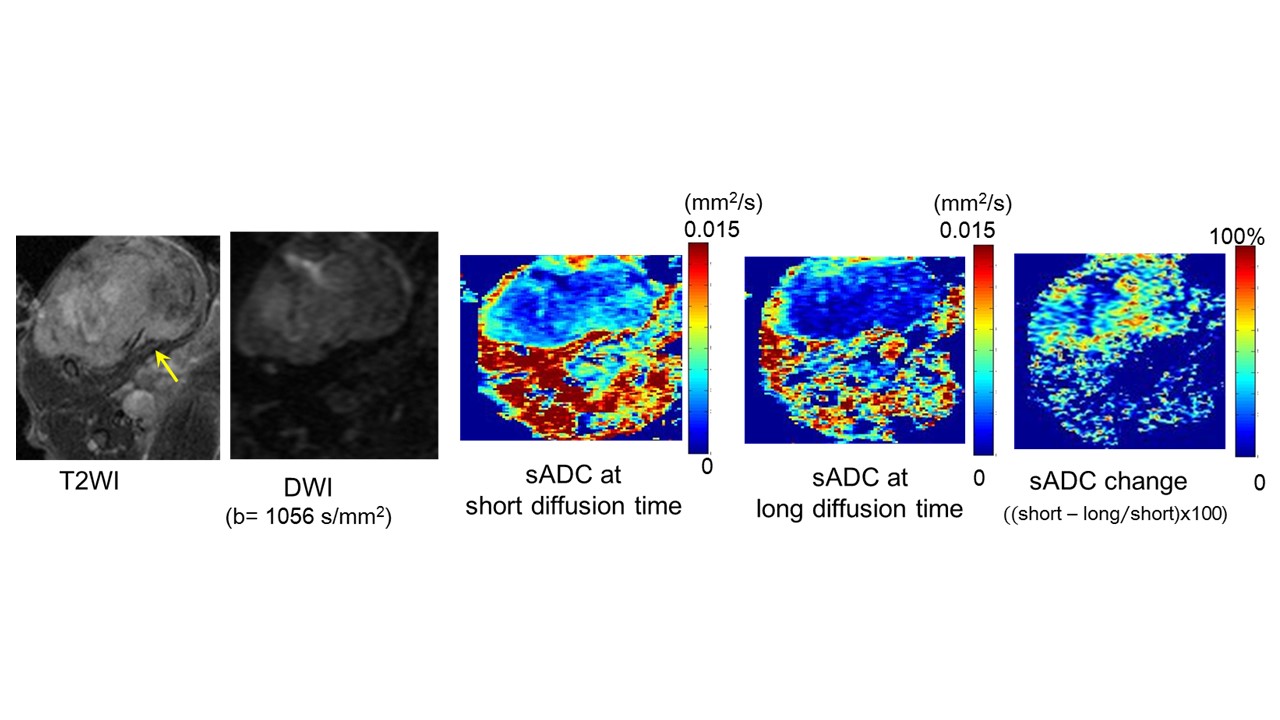
with the increase of diffusion time. Representative sADC maps at different
diffusion times as well as maps of their sADC change are shown in Figure 2,3
and 4. sADC change was heterogeneous in some tumors, which contrast was not
appreciated on other diffusion or anatomical images.Discussion
The
decrease of ADCo as well as sADC values and the increase of K values was in
agreement with our previous investigation using HCC xenograft model or other
studies (6,8). This result suggests the hypothesis that diffusion hindrance
increases with the diffusion time in the tumor, as more molecules hit many
boundaries, such as cell membranes. The area with the largest sADC change
corresponded to the area with low sADC value, suggesting the most proliferating
or active part of the tumor.
On
the other hand, no sADC change was observed in the center of some tumors
although sADC was low, and there were no findings on T2WI or DWI images (Figure
4), which excludes necrosis. This pattern might reflect that some evolution
undergoing in the tumor aggressive cells, perhaps a drastic change in membrane
permeability. Further investigation and correlation with histology are underway
to assess those sADC heterogeneous patterns.Conclusion
ADCo
and sADC values significantly decreased and K value significantly increased
with the increase of diffusion time in MDAMB231 xenograft model. Some tumor
showed heterogeneous sADC change derived from two different diffusion times.
Acknowledgements
This work was supported
by Hakubi Project of Kyoto University and MEXT KAKENHI Grant No. 15K19786.References
(1) Padhani AR et al. Neoplasia. Diffusion-weighted magnetic resonance imaging as a cancer biomarker:
consensus and recommendations. 2009;1:102–125
(2) Iima
M et al. Quantitative Non-Gaussian Diffusion and Intravoxel Incoherent Motion
Magnetic Resonance Imaging: Differentiation of Malignant and Benign Breast
Lesions. Investigative Radiology. 2015;50:205-11
(3) Le
Bihan D et al. Diffusion Magnetic Resonance Imaging: What Water Tells Us about
Biological Tissues. PLoS Biol. 2015 Jul; 13(7): e1002203
(4) Pyatigorskaya
N et al. Relationship between the diffusion time and the diffusion MRI signal
observed at 17.2 Tesla in the healthy rat brain cortex. Magn Reson Med.
2014;72:492-500
(5) Reynaud
O et al. Surface-to-volume ratio mapping
of tumor microstructure using oscillating gradient diffusion weighted imaging.
Magn Reson Med. 2016 Jul;76:237-47
(6) Hope
et al. Demonstration of Non-Gaussian Restricted Diffusion in Tumor Cells Using
Diffusion Time-Dependent Diffusion-Weighted Magnetic Resonance Imaging
Contrast. Front Oncol. 2016; 6:179
(7) Iima
M et al. Clinical Intravoxel Incoherent Motion and Diffusion MR Imaging: Past,
Present and Future. Radiology 2016;278:1
(8) Iima
M et al. Investigation of diffusion signal behavior at different diffusion
times in a human hepatocellular carcinoma xenograft model. Proceedings of the
24th Annual Meeting of ISMRM, Singapore, 2016, p.3418