1769
Diffusion kurtosis metrics as sensitive biomarkers of ageing1Institute of Neuroscience and Medicine 4, Research Centre Jülich, Jülich, Germany, 2Department of Neurology, Faculty of Medicine, RWTH Aachen University, Aachen, Germany, 3JARA - BRAIN - Translational Medicine, RWTH Aachen University, Germany
Synopsis
Diffusion tensor imaging is an established tool for the examination of WM connectivity and microstructural changes across the lifespan. More recently, advanced diffusion MRI techniques, such as diffusion kurtosis imaging (DKI), have been shown to provide richer information on tissue microstructure. Thus far, only a few works have been published related to DKI in healthy ageing. In this work, we examined, in a large cohort of subjects, the potential of DKI metrics to unravel microstructural changes due to ageing in different brain regions.
Purpose
WM plays a vital role in information transfer between various grey matter regions. DTI, an indispensible tool in brain research, has enabled the examination of WM connectivity and micro-structural changes across the lifespan, and improved our understanding of the link between structure and function in development and ageing. Numerous DTI studies helped to establish patterns of cerebral maturation and decline1-3. They showed that cerebral WM follows a quadratic trajectory, which peaks in early-to-middle adulthood, with age-of-peak being different for different tracts (between 23 and 40 years old). Methodically, the vast majority of the studies has been based on the tensor directionality and fractional anisotropy (FA), whereby the latter is considered as an overall neuroimaging index of WM coherence. Among others, FA is sensitive to axonal myelination and permeability levels. More recently, advanced non-Gaussian diffusion methods, such as DKI4, have gained increasing interest in the field. However, thus far, only a few works have used DKI to study maturation or healthy ageing5-8. In our recent work8, using Tract-Based Spatial Statistics (TBSS) and atlas-based analysis, we have shown that DKI metrics provide sensitive biomarkers to microstructural changes occurring between the late childhood and middle adulthood. In this work, we applied the same methodology to unravel the sensitivity of DKI metrics to age-related microstructural changes in a large cohort of adults in a broad age range.Materials and Methods
The subject population in this study represents a sample from the “1000BRAINS” study, a large epidemiological cohort study on brain ageing, whose rationale and design is described in more detail elsewhere9. A subgroup of 150 healthy subjects was selected for the analysis (range, 31-80 years, mean age, 55.6 years). DKI measurements were performed on a whole-body 3T Siemens MAGNETOM scanner. Four diffusion tensor (DT) metrics (mean (MD), axial (AD), and radial (RD) diffusivity, and fractional anisotropy (FA)), and four kurtosis tensor (KT) metrics (mean (MK), axial (AK), and radial (RK) kurtosis, and kurtosis anisotropy (KA)) were determined on the voxel-by-voxel basis. We used two methods for between-group analysis, i.e., whole brain Tract-Based Spatial Statistics (TBSS) and averaging over 20 anatomic regions defined by John-Hopkins-University (JHU) WM atlas. For each anatomic region, we analysed the age dependence of mean parameter values using both linear and quadratic fits. TBSS was performed with two subgroups, each consisting of 30 subjects: younger adults (range, 31-40 years, mean age 36 years) and older adults (range, 71-80 years, mean age 75,1 years).Results and Discussion
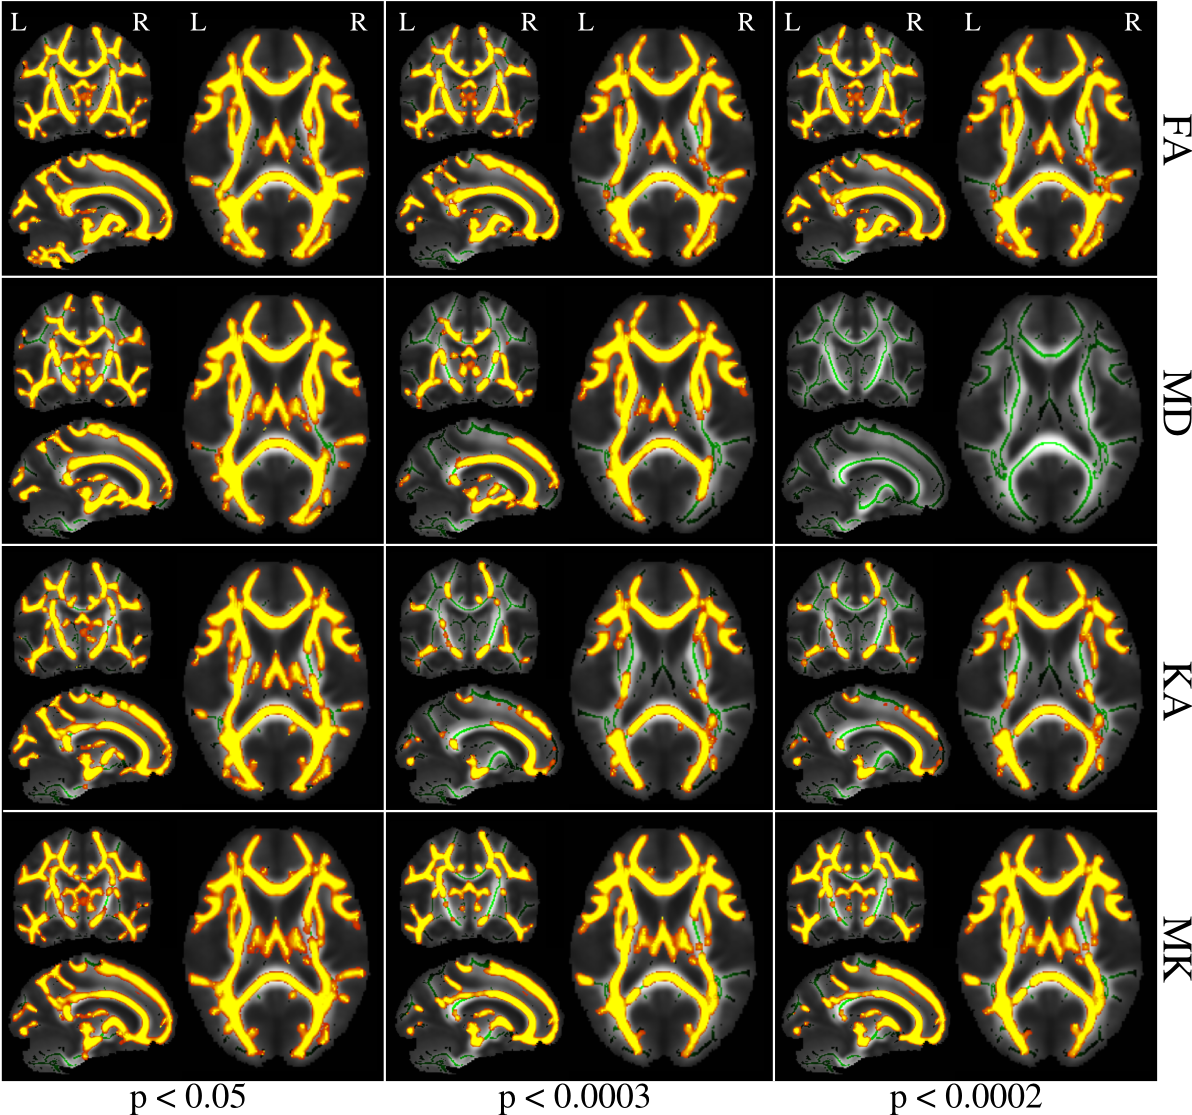
The strength of correlation with age was dependent on the anatomy, and varied for different metrics. Significantly large between-group changes were observed for all DT and KT metrics in both atlas-based and TBSS analyses. TBSS has demonstrated widespread between-group differences in all DT and KT metrics, however, significance levels at which the patterns of differences tended to vanish were strongly variable for different metrics and anatomic regions. In Figure 1, TBSS results of between-group comparisons are demonstrated for FA, MD, KA, and MK given 3 different threshold values of p (p<0.05, p<0.0003, p<0.0002) as an example. At the highest threshold (p<0.05), all 4 parameters showed widespread between-group differences over the whole skeleton. In all regions, FA and MK were higher in the younger group, but MD was higher in the older group. The patterns reflecting the differences became poorer and vanished completely at different threshold values for different parameters. In particular, the differences in MD vanished at p <0.0002, as shown in Figure 1, while they were still pronounced in the other metrics. In this context, KT tensor metrics revealed themselves as sensitive biomarkers of age-related changes, in agreement with our previous results8 comparing the group of children and the group of adults. It is important in the context of the minimum group size required for investigation based on different metrics. We shall discuss the differences in decline patterns for association, projection, and commissural fibres elucidated by DKI analysis.Conclusion
Our results suggest that KT metrics exhibit high sensitivity and provide promising biomarkers for microstructural changes due to ageing. They are particularly powerful for exploring specific brain regions that exhibit accelerated or protracted decline as assessed by DKI.Acknowledgements
No acknowledgement found.References
1. Kochunov, P., Williamson, D.E., Lancaster, J., et al., 2012. Fractional anisotropy of water diffusion in cerebral white matter across the lifespan. Neurobiol Aging 33, 9-20.
2. Lebel, C., Gee, M., Camicioli, R., et al., 2012. Diffusion tensor imaging of white matter tract evolution over the lifespan. Neuroimage 60, 340-352.
3. Yoshida, S., Oishi, K., Faria, A.V., et al., 2013. Diffusion tensor imaging of normal brain development. Pediatr Radiol 43, 15-27.
4. Jensen, J.H., Helpern, J.A., 2010. MRI quantification of non-Gaussian water diffusion by kurtosis analysis. NMR Biomed 23, 698-710.
5. Coutu, J.P., Chen, J.J., Rosas, H.D., etal., 2014. Non-Gaussian water diffusion in aging white matter. Neurobiol Aging 35, 1412-1421.
6. Gong, N.J., Wong, C.S., Chan, C.C., et al., 2014. Aging in deep gray matter and white matter revealed by diffusional kurtosis imaging. Neurobiol Aging 35, 2203-2216.
7. Paydar, A., Fieremans, E., Nwankwo, J.I., et al., 2014. Diffusional kurtosis imaging of the developing brain. AJNR Am J Neuroradiol 35, 808-814.
8. F. Grinberg et al., Maximov I.I., E. Farrher, et al., 2016. Diffusion kurtosis metrics as biomarkers of microstructural development: A comparative study of a group of children and a group of adults. Neuroimage, pii: S1053-8119(16)30418-9, doi: 10.1016/j.neuroimage.2016.08.033, epub ahead of print.
9. S. Caspers, S. Moebus, S. Lux, et al., 2014. Studying variability in human brain aging in a population-based German cohort—rationale and design of 1000BRAINS. Front Aging Neurosci 6, 149.
Figures