1765
Can we trust structural connectivity?1Computer Science, University of Verona, Verona, Italy, 2Neuroradiology, University Hospital Verona, Verona, Italy
Synopsis
Structural connectivity models result from a complex processing chain involving many different steps, each having an impact on the reliability of the final measures. One of the hottest questions in the state-of-the-art is thus “To which extent can we trust the structural connectome?”. In this work, we tackled this issue by focusing on the typical processing pipeline and investigating the impact of the main involved steps. MRTrix CSD-based probabilistic tractography provided the highest stability across subjects and MRTrix reached the largest distance with respect to other softwares in both individual subject and group analysis.
Introduction
The objective assessment of structural connectivity (SC) has become one of the hottest topics in diffusion research. Results depend on many factors including acquisition scheme, signal reconstruction model, tractography algorithm, cortical parcellation and the connectivity measure itself. Assessing the variability across processing steps and subjects is thus of paramount importance for the informed use of this powerful tool. This work addresses the issue focusing on the most typical steps in order to objectively assess the intrinsic variability in the measure in the considered simplified cases. To this end, a connectivity measure was chosen and used to derive the connectivity matrix relying on a predefined parcelation. Diffusion tensor imaging (DTI) [1], Constrained Spherical Deconvolution (CSD) [2] and 3D Simple Harmonic Oscillator based Reconstruction and Estimation (SHORE) [3] were used for recovering the main diffusion directions through Orientation Distribution Function (ODF) reconstruction. Tractography was performed following either the deterministic or the probabilistic approaches relying on different software implementations as described in the next Section. Experiments were performed on in-vivo data acquired following a realistic clinical setting.Methods
Nine volunteers (age = 36.4 ± 9.7) underwent a HARDI acquisition consisting of two shells (repetition time [TR]/ echo time [TE]=8500/91 ms, field of view [FOV]=230x230 mm, 120 slices, 2x2x2 mm3 resolution; b=700, 2000 s/mm2, 24 and 48 gradients, respectively). The ROIs were extracted from T1 images (TR/TE= 8.1/3.7 ms, 91 slices, 1x1x1 mm3 resolution) using Freesurfer Desikan-Killiany atlas (33 cortical, 8 subcortical regions per hemisphere plus Brain-stem and Corpus Callosum). Three different softwares were considered: Diffusion Toolkit (DTK) [4], MRTrix [5] and DIPY [6]. In detail:
- In DTK, DTI reconstruction was performed using only one shell (b=2000) and considering four different tractography algorithms (FACT, Kutta, Streamline, and Tensorline);
- In DIPY deterministic tractography (EuDX) was performed on the three reconstruction models (DTI, SHORE, and CSD).
- In MRTrix deterministic tractography was applied after DTI and CSD reconstruction from one shell (b=2000) samples, while probabilistic tractography using CSD.
SC matrices were derived for each subject and method. The simplest SC measure was chosen, that is the normalized number of fibers connecting region pairs calculated matrix-wise. A variation coefficient was estimated as the mean absolute difference between pairs of connectivity matrices, that is $$$d(X,Y)=\sum_{ij}{|X_{ij}-Y_{ij}|}/2$$$ [7], were X and Y are two SC matrices. The distance analysis was performed across subjects for each method, across methods for each subject and over the group of subjects. In this case, the mean SC matrices were calculated across subjects for each method.
Results and Discussion
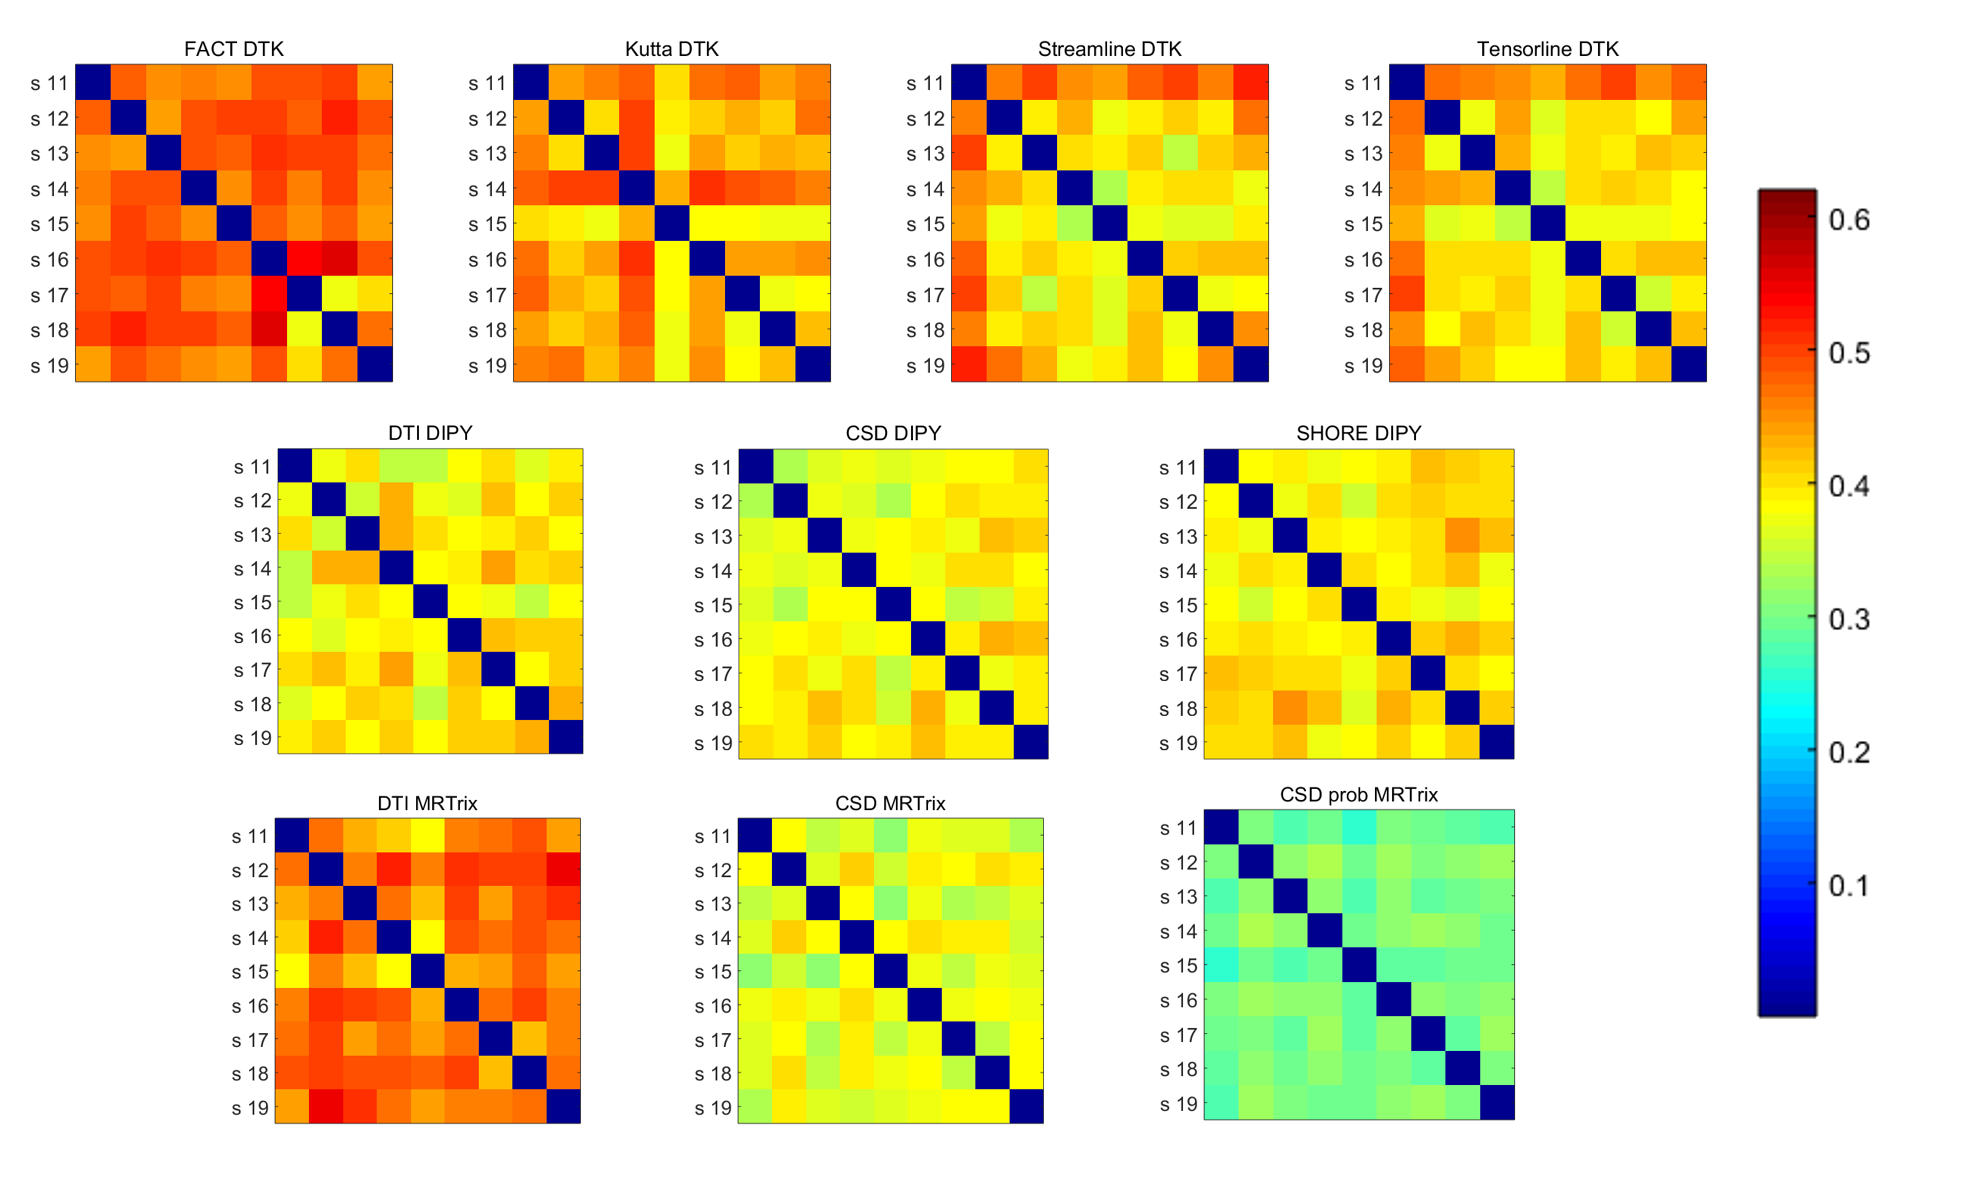
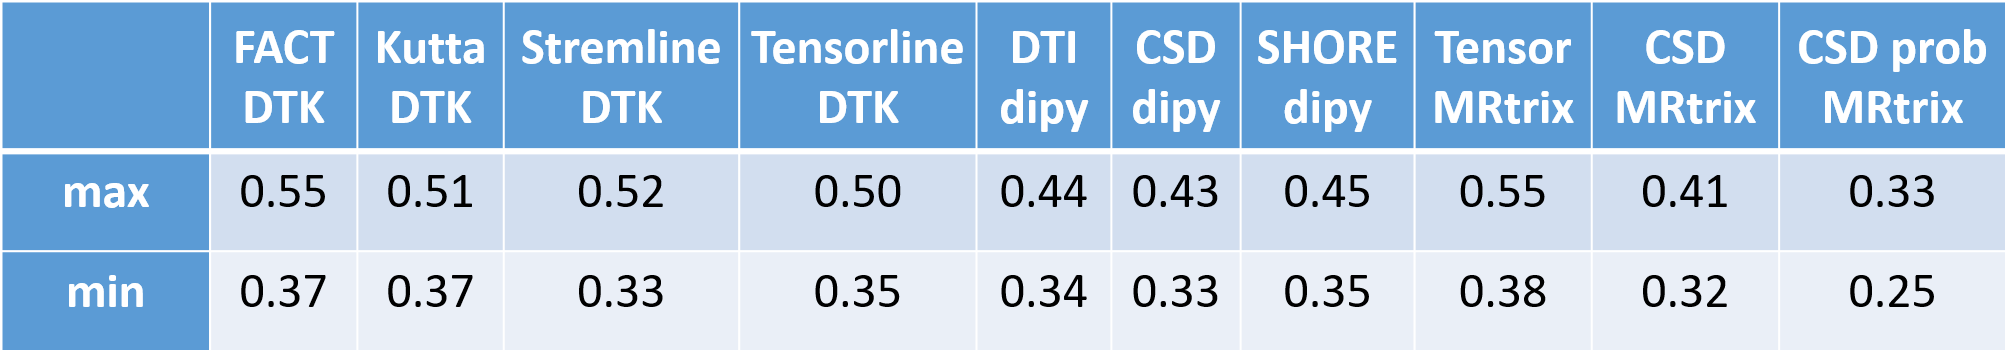
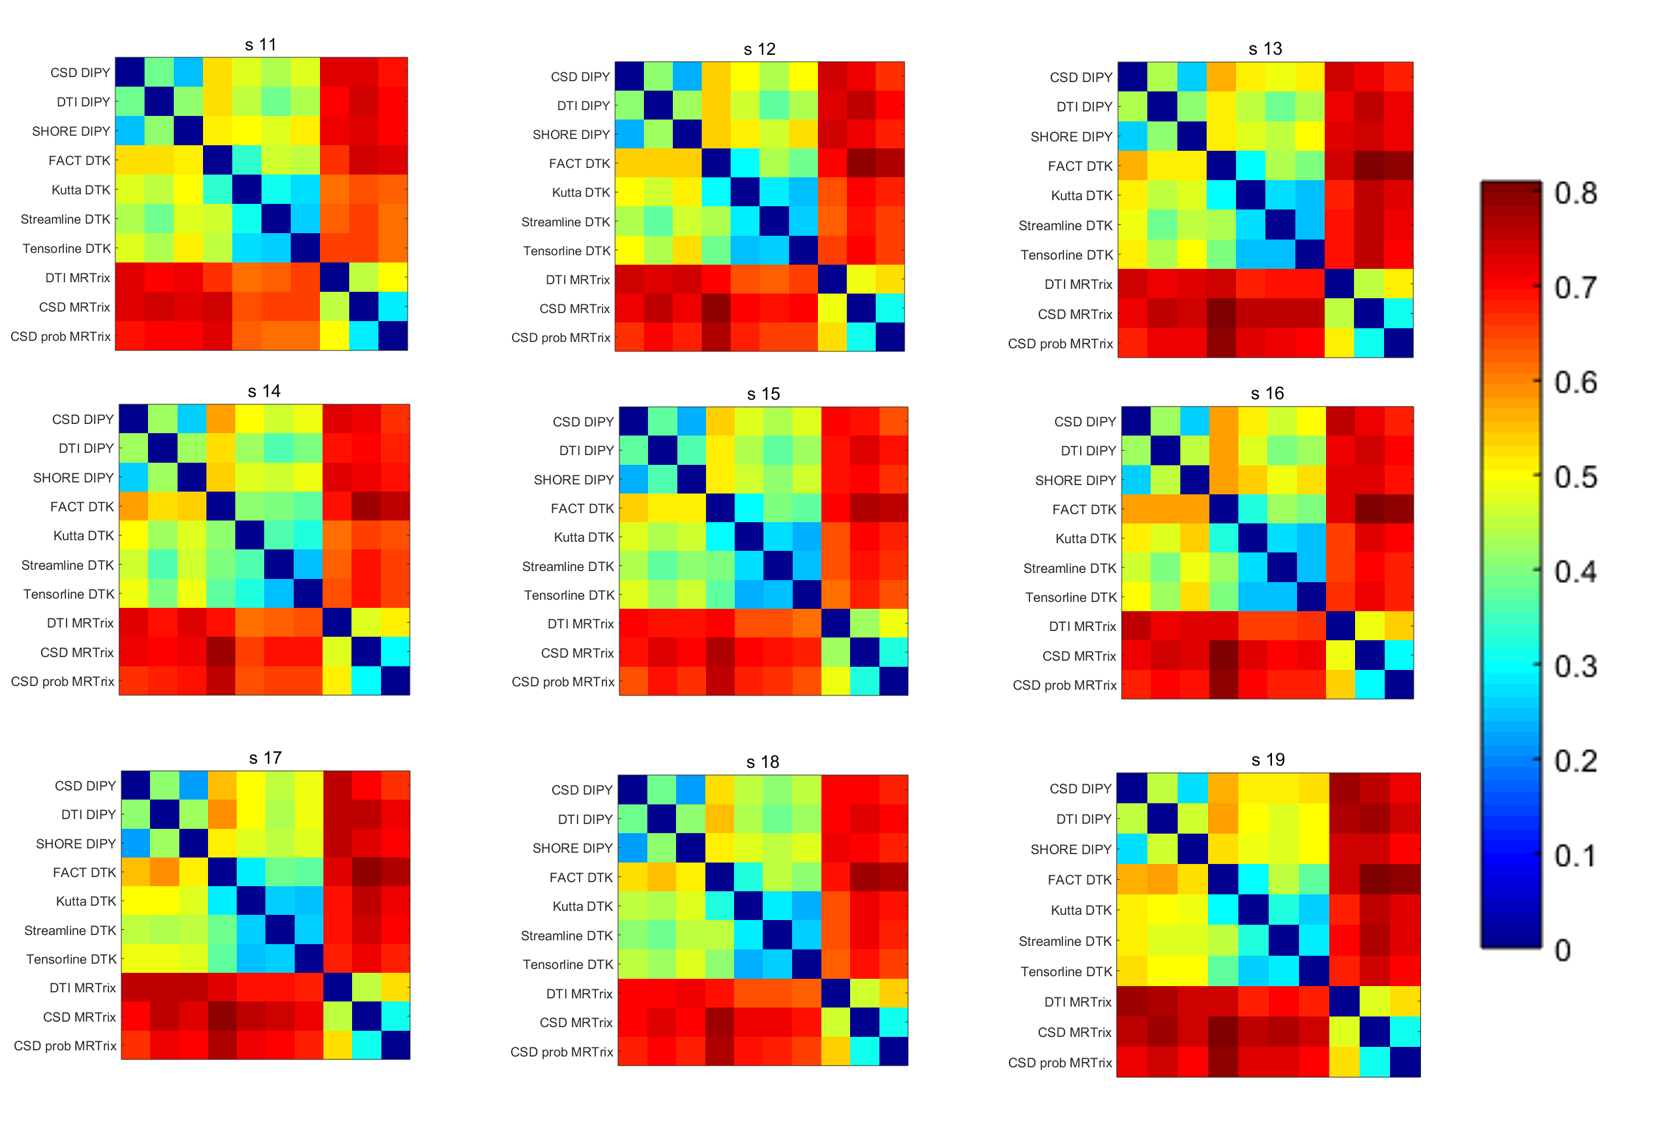
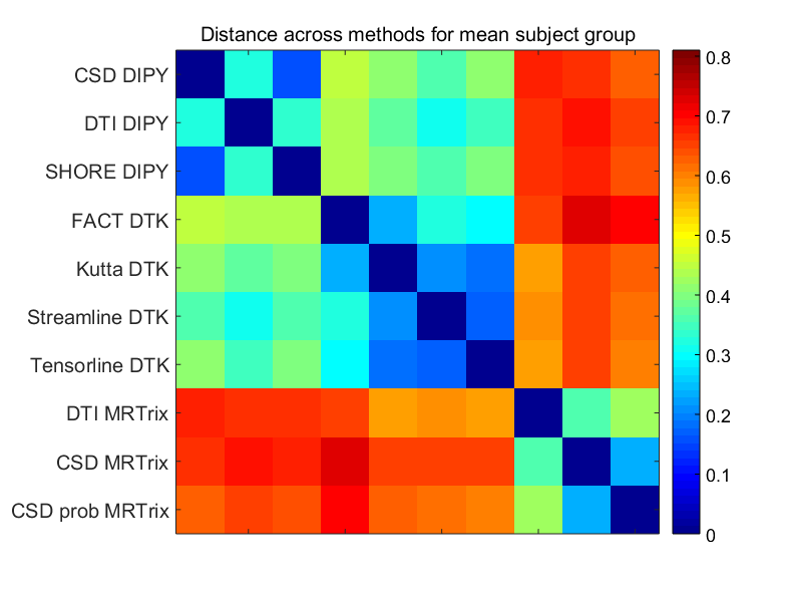
Figure 1 and Table 1 illustrate the variability of the distance between pairs of subjects for each method. MRTrix probabilistic tractography following CSD provides the best stability across subjects (0.25 <d < 0.35). The highest variability corresponds to FACT-DTK, followed by DTI-MRTrix and the other DTI-based DTK methods. The DYPY implementation of DTI follows. CSD (DYPY and MRTrix) and SHORE (DYPY) deterministic tractography lead to comparable results. The ability to disambiguate crossings provide to these methods an advantage over DTI, even though the DYPY implementation is quite close in performance. DIPY deterministic tractography showed the highest agreement across reconstruction models. The lowest distance is the one between CSD_dipy and SHORE_dipy (d<0.25). This result can be explained by the fact that the principal directions of diffusion extracted from SHORE and CSD ODFs are very similar. Figure 2 shows the variability of the SC distance measure for each subject across methods. MRTrix methods spot out with respect to the others, as also confirmed by the group analysis (Figure 3). Overall, results suggest that MRTrix provides SC measures that are different from those obtained by the other methods and leads to higher stability across subjects, especially following CSD.Conclusions
Our results highlight the variability of tractograms for the same subject, when different tractography algorithms and reconstruction models are taken into account. MRTrix probabilistic tractography provided the highest inter-subject stability, MRTrix presents also the higher distance with respect to other softwares in both individual subject and group analysis. Further investigation is needed for characterizing the implications of these results. For instance, how this relates to accuracy and precision remains to be established, as well as the impact of and interplay with other parameters including, among others, q-space sampling, noise level and ODF peak extraction.Acknowledgements
No acknowledgement found.References
[1] Basser, Peter J., James Mattiello, and Denis LeBihan. "MR diffusion tensor spectroscopy and imaging." Biophysical journal 66.1 (1994): 259.
[2] Tournier, J-Donald, Fernando Calamante, and Alan Connelly. "Robust determination of the fibre orientation distribution in diffusion MRI: non-negativity constrained super-resolved spherical deconvolution." NeuroImage 35.4 (2007): 1459-1472.
[3] Ozarslan, E., et al. "Simple harmonic oscillator based reconstruction and estimation for three-dimensional q-space MRI." (2009).
[4] Wang, R., et al. "Diffusion toolkit: a software package for diffusion imaging data processing and tractography." Proc Intl Soc Mag Reson Med. Vol. 15. No. 3720. 2007.
[5] Tournier, J., Fernando Calamante, and Alan Connelly. "MRtrix: diffusion tractography in crossing fiber regions." International Journal of Imaging Systems and Technology 22.1 (2012): 53-66.
[6] Garyfallidis, Eleftherios, et al. "Dipy, a library for the analysis of diffusion MRI data." Frontiers in neuroinformatics 8 (2014): 8.
[7] Girard, Gabriel, et al. "Structural connectivity reproducibility through multiple acquisitions." Organization for Human Brain Mapping. 2015.
Figures