1764
Can fast diffusion kurtosis imaging be quantitative in the brain?1Graduate Institute of Biomedical Electronics and Bioinformatics, National Taiwan University, Taipei, Taiwan, 2Radiology, Cathay General Hospital, Taipei, Taiwan, 3Medical Imaging, National Taiwan University Hospital, Taipei, Taiwan, 4Graduate Institute of Oncology, National Taiwan University, Taipei, Taiwan, 5Graduate Institute of Clinical Medicine, National Taiwan University, Taipei, Taiwan
Synopsis
This study was aimed to investigate the applicability of fast DK imaging for both cerebral gray matter and white matter as a quantitative method. Our experimental data reveal that the dependence of D and K on b-values predominantly exists in areas containing a noticeable amount of cerebrospinal fluid. D is more sensitive to b-value choice than K. With b-values carefully chosen to account for signal-to-noise ratio and model fidelity, fast DK imaging-derived indexes can be quantitative with negligible dependence on b-values in most gray matter and white matter.
Introduction
Diffusion kurtosis (DK) imaging 1 allows assessment of non-Gaussian diffusion by acquiring data at varied b-values, which leads to prolonged scan time. Fast DK imaging 2 has been proposed to expedite the procedure by decreasing both scan time (acquiring the minimally required number of b-values) and computation time (obviating least-square curve fitting). However, it is still under debate whether the indexes (diffusion coefficient D and diffusion kurtosis coefficient K) derived from fast DK imaging can be quantitative considering the observation that their values vary with the b-values used. In addition, the heterogeneous signal-to-noise ratio and b-values in literature may have caused inconsistent findings and difficulty in cross-reference. This study was aimed to investigate whether fast DK imaging is applicable in both cerebral gray matter and white matter as a quantitative method.Materials and Methods
1. Subjects
The Institutional Review Board approved
this study. Twelve healthy volunteers (6 women, 6 men, age = 25-72 years) were
recruited and each provided written informed consent before participation.
2. MR imaging
All MR imaging was performed on a 3-Tesla clinical system (Tim Trio, Siemens,
Erlangen, Germany) using the body coil transmitter and a 12-channel
phased-array head coil receiver. Diffusion-weighted imaging was based on a
twice-refocused spin-echo two-dimensional echo-planar sequence: TR = 4 s, TE =
124 ms, field-of-view = 20 cm,
25 slices, voxel size = 2x2x4 mm3, GRAPPA acceleration factor = 3, and 8
averages. Diffusion encoding was applied along three orthogonal directions in
separate series, each of which comprised 12 b-values (0, 400, 550, 700, 850,
1100, 1400, 1700, 2200, 2700, 3200, and 4000 s/mm2).
The smallest non-zero b-value was chosen to avoid the intravascular signal that
had been observed at b-values below 200 s/mm2 3.
3. Noise-level estimation
By using bootstrapping, signal threshold was created at a significance level of
0.005 and the voxels with signals above the threshold were deemed statistically
detectable and therefore eligible for index calculation and model assessment. The significance level was set lower than commonly adopted (0,05) to account for multiple comparisons and the deviation of noise from normal distribution after parallel image reconstruction. The maximum b-value (bmax)
was chosen such that at least 80% of the gray matter and white matter were
detectable.
4. Index calculation and model assessment
D and K were
calculated according to the closed-form equations previously described 2. For each b-value combination, the
effect size of the model (R2) was calculated to assess model fidelity.
Results and Discussion
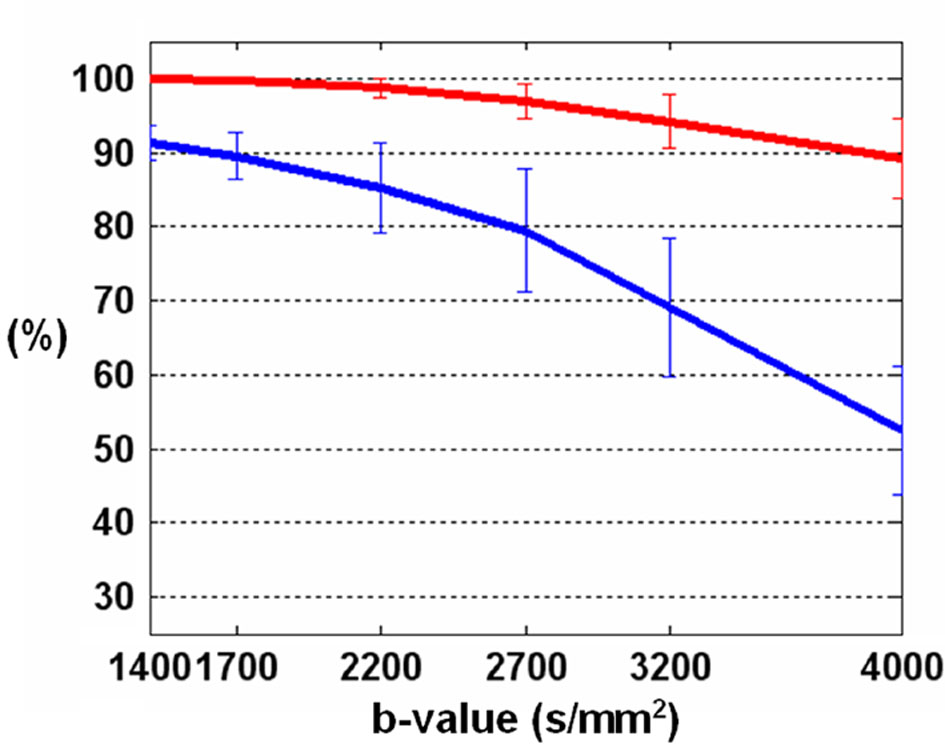
As shown in Figure 1, the percentage of detectable voxels decreases when b increases. The decrease is faster in gray matter than in white matter. While over 90% of white matter voxels are detectable with b-values up to 3200 s/mm2, the percentage of detectable gray matter voxels is barely 90% when b = 1400 s/mm2. As a trade-off between the percentage of detectable voxels (~80%) and sensitivity to non-Gaussian diffusion for both gray matter and white matter, bmax was chosen to be 2200 s/mm2.
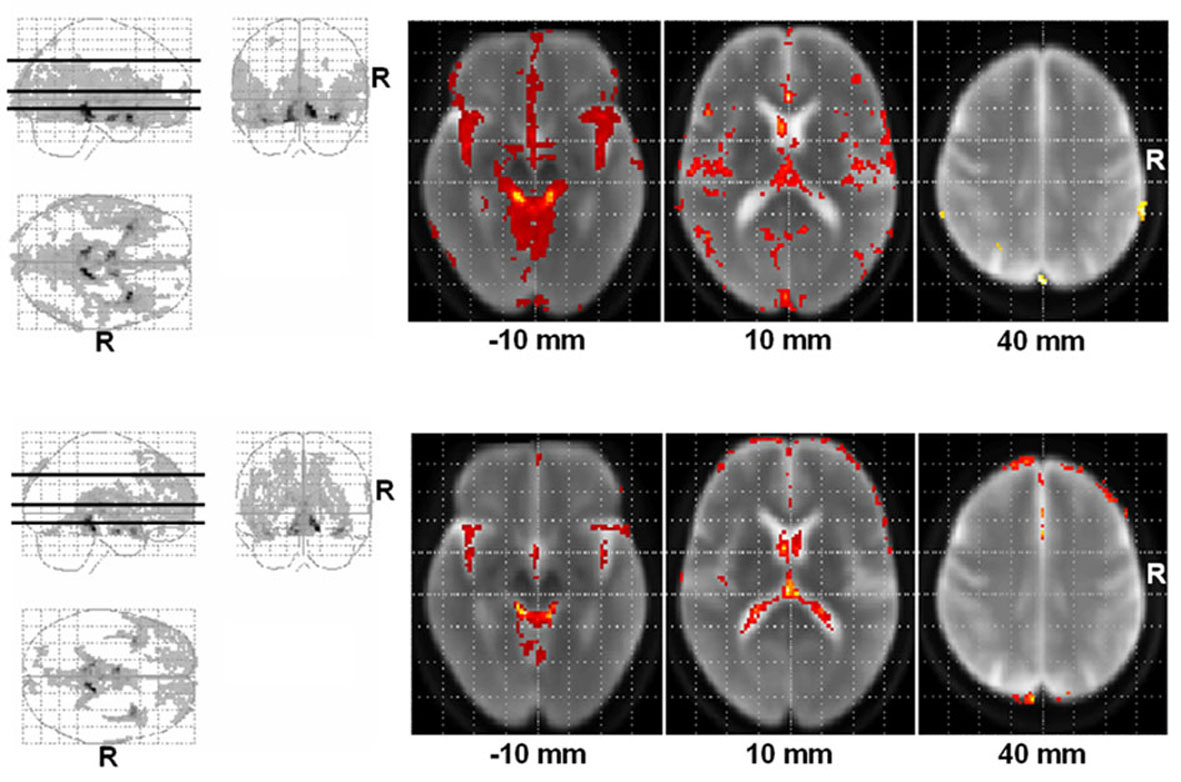
Six of the b-value combinations (550/2200, 700/1700, 700/2200, 850/1700, 850/2200, 1100/2200) generated models that statistically fit the data (at a significance level of 0.005) in over 90% of the voxels in both gray matter and white matter. Repeated-measured analysis of variance was performed in search of voxels where the indexes changed with the b-values used for calculation. As seen in Figure 2, the dependence of D and K on b-values is present predominantly in areas with a considerable amount of cerebrospinal fluid. In most gray matter and white matter, b-value combinations do not cause statistical difference in the calculated D and K. Overall, the dependence is smaller with K than with D, which qualitatively agrees with a recent conventional DK imaging study 4.
In summary, our data suggest that fast DK imaging is quantitatively applicable in both gray matter and white matter on the premise that b-values are chosen in consideration of signal-to-noise ratio and model fidelity.
Acknowledgements
This work was supported by Ministry of Science and Technology, Taiwan (grants: 102-2221-E-002-219, 103-2420-H-002-006-MY2, 104-2221-E-002-088, and 105-2314-B-002-094-MY3).References
1. Jensen JH, Helpern JA, Ramani A, et al. Diffusional kurtosis imaging: the quantification of non-gaussian water diffusion by means of magnetic resonance imaging. Magn Reson Med 2005;53(6):1432-1440.
2. Jensen JH, Hu C, Helpern JA. Rapid data acquisition and post-processing for diffusional kurtosis imaging. Proc Annual Meeting ISMRM, Honolulu, USA 2009:1403.
3. Le Bihan D, Breton E, Lallemand D, et al. Separation of diffusion and perfusion in intravoxel incoherent motion MR imaging. Radiology 1988;168(2):497-505.
4. Yang AW, Jensen JH, Hu CC, et al. Effect of cerebral spinal fluid suppression for diffusional kurtosis imaging. J Magn Reson Imaging 2013;37(2):365-371.
Figures