1762
Value of MR DWI with different mathmatical models in the differential diagnosis liver neoplasmsQu Zhaohui1, Gao Xuemei, Cheng Jingliang, and Wang Shaoyu
1The First Affiliated Hospital of Zhengzhou University, Zhengzhou, People's Republic of China
Synopsis
To investigate the utility value of monoexponential model,biexponential model and diffusion kurtosis model diffusion weighted imaging in diagnosis of liver neoplasms.
Purpose
Diffusion weighted imaging(DWI) is widely used to diagnosis the liver lesions,but the use of diffusion kurtosis imaging (DKI) to diagnosis the lesions and compared with other mathmatical models DWI is still rare.The study was to investigate the utility value of monoexponential model,biexponential model and diffusion kurtosis model diffusion weighted imaging in diagnosis of liver neoplasms.Methods
forty eight patients confirmed liver mass were included studies ,all the patients were confirmed by pathology or meet up with clinical diagnosis standard and confirmed by follow-up of treatment. All the patients categorized into malignant group (33 patients) and benign group (15 patients). The MR images were collected on a MAGNETOM Prisma 3T MR scanner (Siemens Healthcare, Erlangen, Germany) with a 18-channel torso phased-array coil. All patients underwent conventional MR examinations, monoexponential model DWI using two b values(50, 800sec/mm2)and TR/TE:4500ms/56ms, biexponential model DWI using twelve values (b=0、20、l00、150、200、300、400、500、600、800、1000、1200s/mm2)and TR/TE:4400ms/45ms, diffusion kurtosis model DWI using three values(b=0,1000,2000s/mm2)and TR/TE, 4300/56ms, to obtain ADC values, D values, D* values, f values, MD values, MK values, FA values. The above values were measured and analyzed by Mann-Whitney U Test. Diagnostic efficacy of these parameters were evaluated by ROC curve.Results
ADC values, D values,f values and MD values of malignant group were (1.01±0.33)×10-3mm2/s、(0.98±0.29)×10-3mm2/s,(21.21±10.74)%,(1.26±0.38)×10-3mm2/s respectively, the benign group were((1.97±1.04)×10-3mm2/s,(1.95±0.97)×10-3mm2/s,(39.96±14.89)%,(1.88±0.69)×10-3mm2/s, the above values of malignant group were obviously lower than benign group(P<0.05), MK values of malignant group were (0.78±0.16), while benign group were (0.62±0.17),malignant group were higher than benign group(P<0.05). D* values of malignant group and benign group were (28.40±27.65)×10-3mm2/s、(39.82±37.44)×10-3mm2/s, FA values of malignant group and benign group were (0.24±0.12)、(0.21±0.06),D* values and FA values had no significant difference. The areas under the ROC curve of ADC values, D values,D* values, f values and MD values,MK values,FA values were 0.796、0.853、0.567、0.834、0.810、0.756、0.492.The cutoff values of ADC values, D values,f values and MD values,MK values in discriminating malignant and benign liver neoplasms were 1.25×10⁻³mm2/s、1.11×10-3mm2/s、32.51%、1.71×10-3mm2/s、0.78, respectively.Discussion
Malignant lesions cells arranged closely lead to organization greater diffusion restricted than benign group which result in lower ADC values,D values and MD values.Malignant group have more new blood vessels, due to incomplete basement membrane, the new blood vessel blood stream is slow and the perfusion effect is weaker which leading to a lower f value. MK value reflect the organization dispersion kurtosis is proportional to the complexity of the structure.The malignant lesions atypia significantly,the structure not only contain tumor cell invasion but also accompanied by fibrous connective tissue hyperplasia and different proportions of tumor stroma, its organization structure complexity is higher than the benign group,therefore the MK value increase.Conclusion
ADC values abtained with monoexponential model,D values,f values,abtained with biexponential model, MD values,MK values abtained with diffusion kurtosis model are helpful in distinguishing liver neoplasms, biexponential model and diffusion kurtosis model can provided more reference for diagnosis.Acknowledgements
No acknowledgement found.References
[1]Goshima S,Kanematsu M,Noda,et al.Diffusion Kurtosis Imaging to Assess Response to Treatment in Hypervascular Hepatocellular Carcinoma.AJR Am J Roentgenol 2015;204:W543-549.
[2]Jiang R,Jiang J,Zhao L,et al.Diffusion kurtosis imaging can efficiently assess the glioma grade and cellular proliferation. Oncotarget 2015;6:42380-42393.
[3]Sugita R, Ito K, Fujita N,et al. Diffusion-weighted MRI in abdominal oncology: clinical applications. World journal of gastroenterology: WJG 2010;16:832–836.
Figures
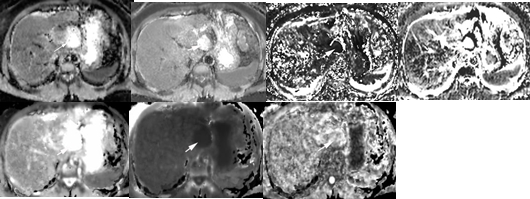
Figure 1.A 39-year-old women with hepatic hemangioma. From the left to right in turn is ADC map,D map,D* map,f map,MD map,MK map,FA map.
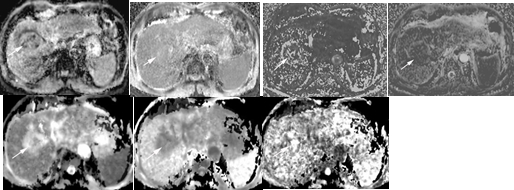
Figure 2.A 67-year-old men with hepatocellular carcinoma.From the left to right in turn is ADC map,D map,D* map,f map,MD map,MK map,FA map.