1760
Translating AxCaliber on a clinical system : 600mT/m versus optimized 80mT/m protocol1Polytechnique Montreal, Montreal, QC, Canada, 2Ecole Centrale de Nantes, Nantes, France, 3A.A. Martinos Center for Biomedical Imaging, Massachusetts General Hospital, Harvard Medical School, Boston, MA, United States, 4Montreal Heart Institute, Montreal, QC, Canada, 5Functional Neuroimaging Unit, CRIUGM, Universite de Montreal, Montreal, QC, Canada
Synopsis
Most model-based diffusion metrics (AxCaliber metrics) have been shown to be less stable and more biased on clinical systems due to the limited gradient strength (40-80mT/m versus >300mT/m on preclinical scanners). In this work we wanted to (i) find the best AxCaliber protocol at 80mT/m and (ii) quantify the bias in the estimated metrics. For these aims, we first optimized an 80mT/m AxCaliber protocol using simulations, then compared experimentally (on an ex vivo cat spinal cord) a 600mT/m protocol versus the optimized 80mT/m protocol. Using the 600mT/m maps as a ground truth, our results show that even though axon diameter cannot be estimated robustly, the fraction of restricted water can be measured accurately (<3% error) and precisely (r2 >0.76) on clinical systems. The short duration of the optimized protocol opens the way to the use of reliable model-based diffusion MRI metrics on a clinical system, metrics that would be particularly useful to measure the degree of myelination through the fiber g-ratio.
Rationale
Using only one diffusion encoding direction (perpendicular to neuronal fibers bundles), with a fine sampling of gradient strength |G| and diffusion time ∆, short and robust AxCaliber1 protocols can be acquired in vivo at 300mT/m in the human corpus callosum2 or in the spinal cord3. Unfortunately, the most powerful clinical systems offer only 40-80mT/m in each direction. Most model-based quantitative MRI metrics have been shown to be less stable and more biased on a clinical system, and this holds especially true for the axon diameter metric2,4. In this work we wanted to (i) find the best AxCaliber protocol at 80mT/m and (ii) quantify the bias in the estimated metric.Methods
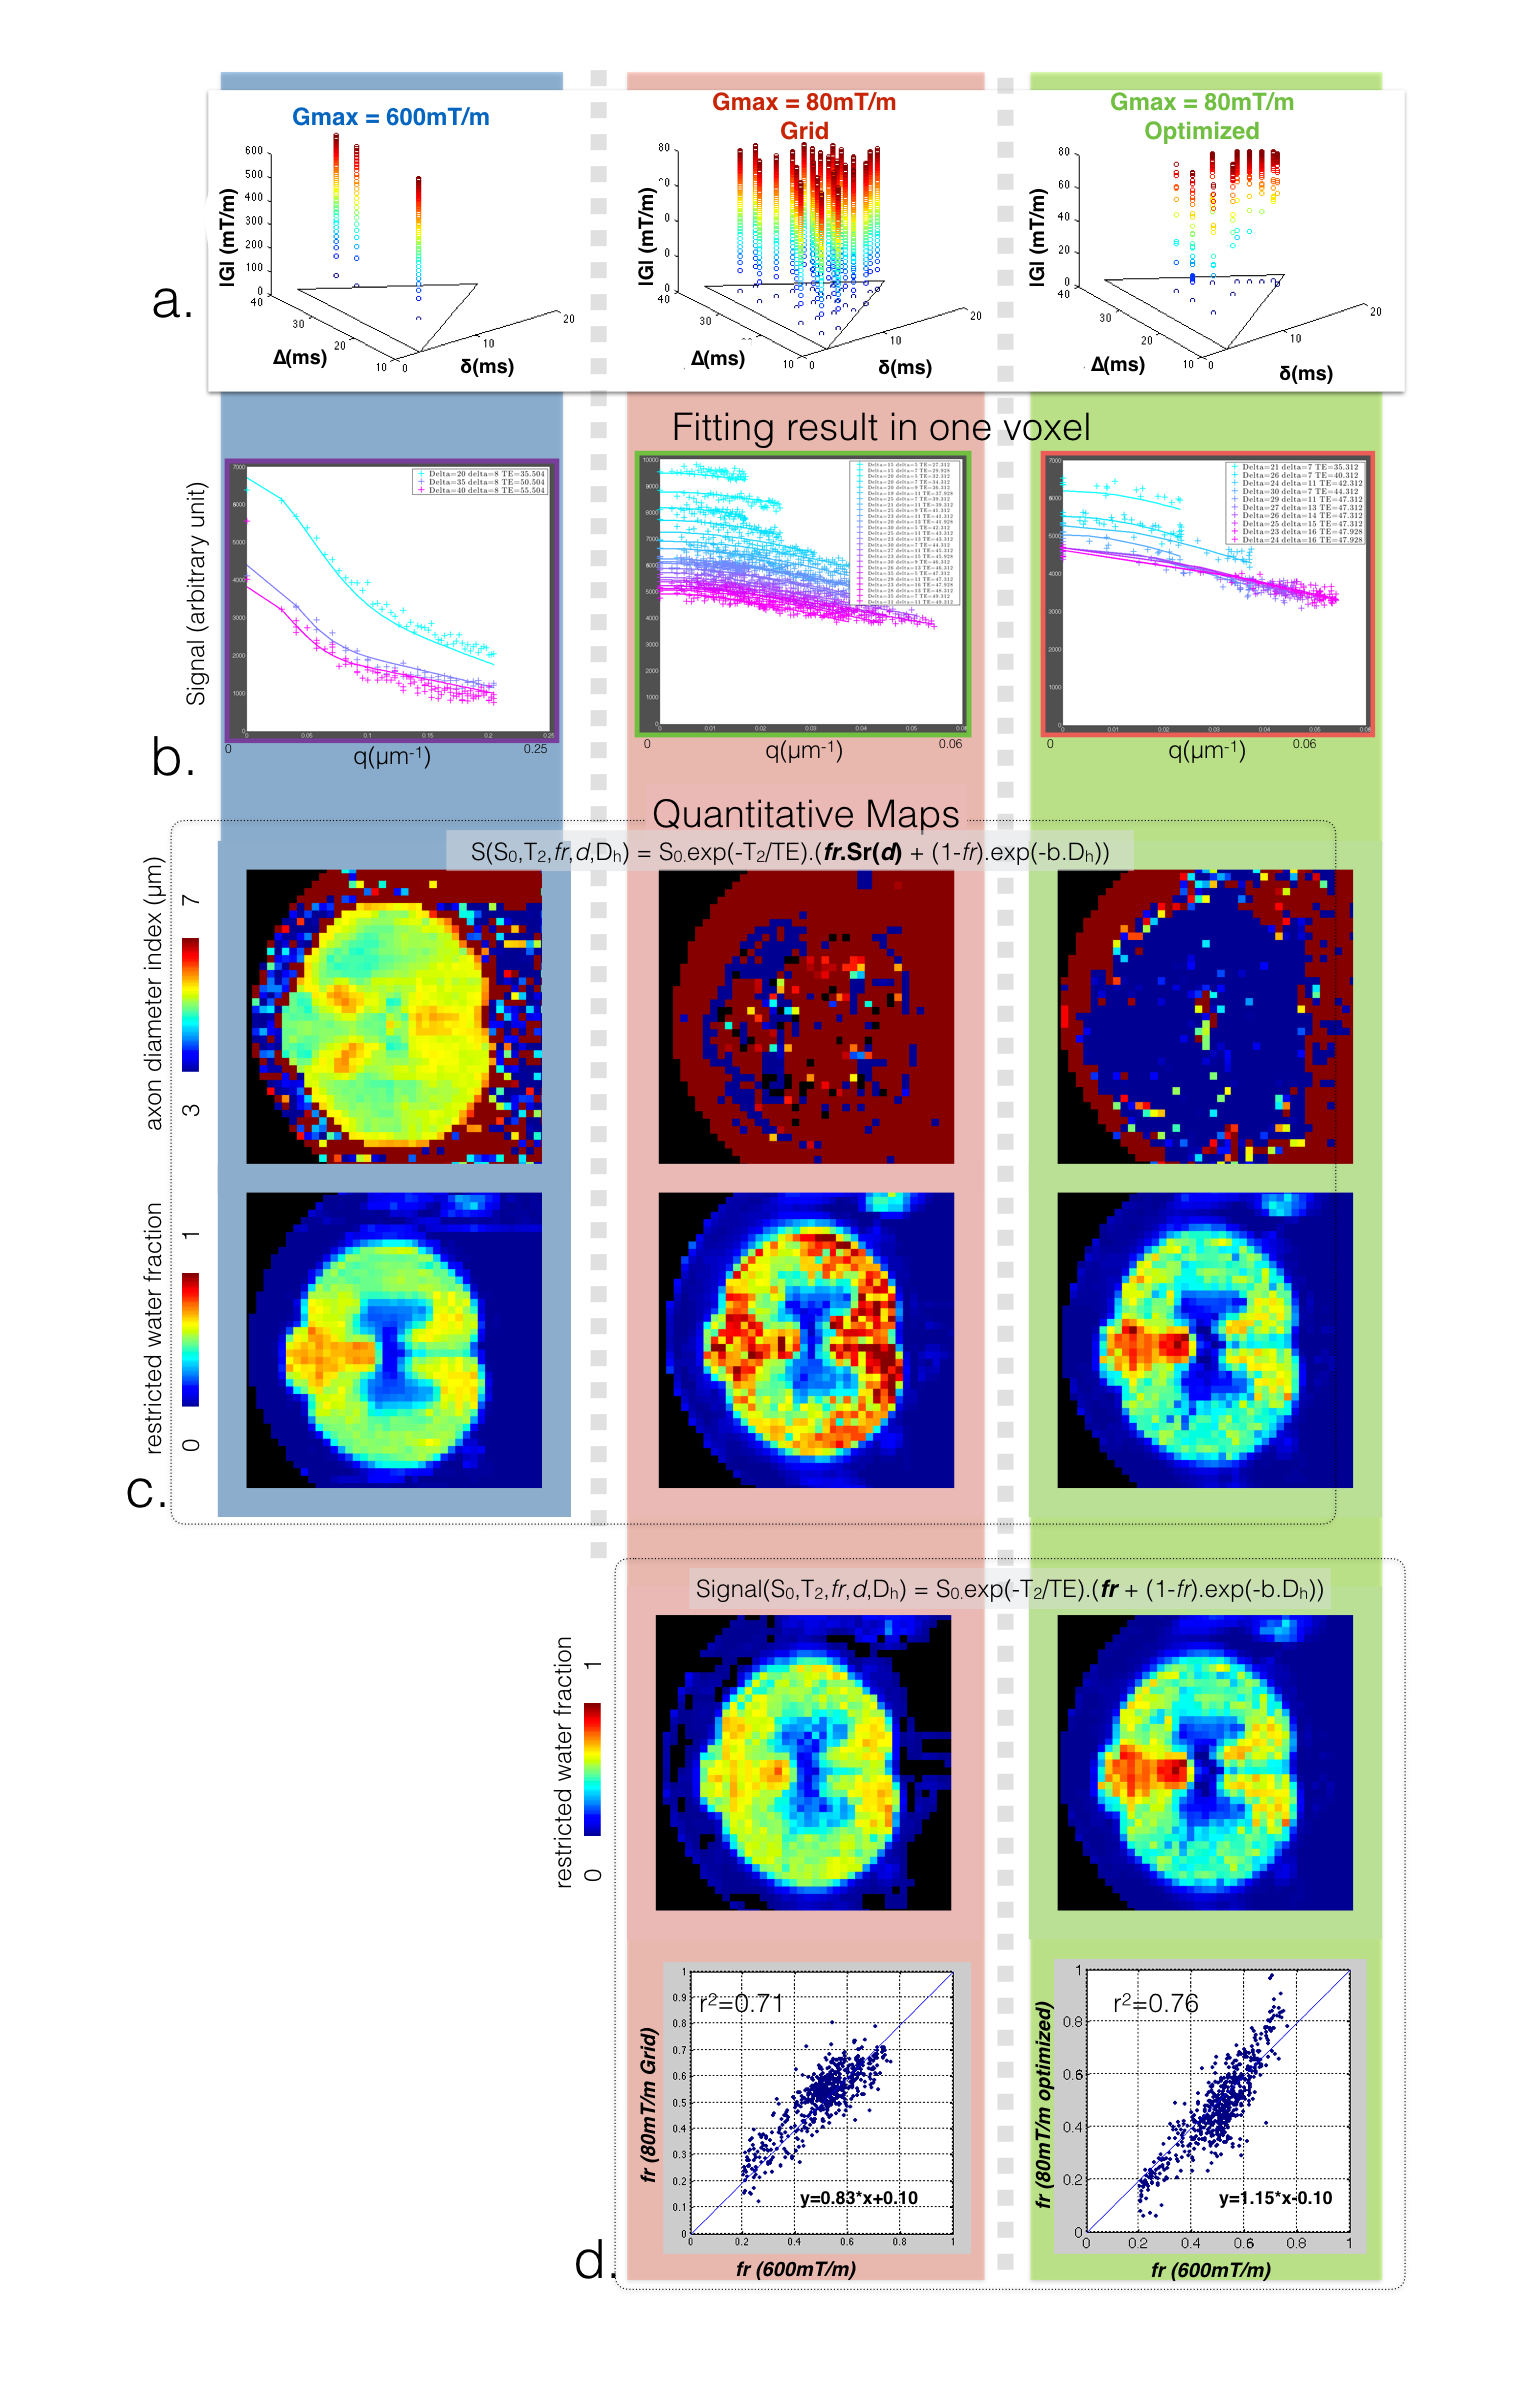
Model. Assuming diffusion encoding gradients perpendicular to the neuronal fibers, a five-parameter model with two compartments (hindered and restricted) and a unique T2 relaxation time4,5 was used : S(S0,T2,fr,d,Dh) = S0.exp(-T2/TE).[fr.Srestricted(d) + (1-fr).Shindered(Dh)]. Srestricted is the Gaussian-phase-distribution equation in a cylinder of diameter d [6], and Shindered = exp(-b.Dh). S0 and T2 are initialized using volumes acquired at b ≤ 1000 s/mm2 by solving the mono-exponential diffusion decay problem S(S0,T2,D) = S0.exp(-T2/TE).exp(-b.D) with the following boundaries (0<T2<200ms, 0<S0<Inf and 0<D<3µm2/ms).
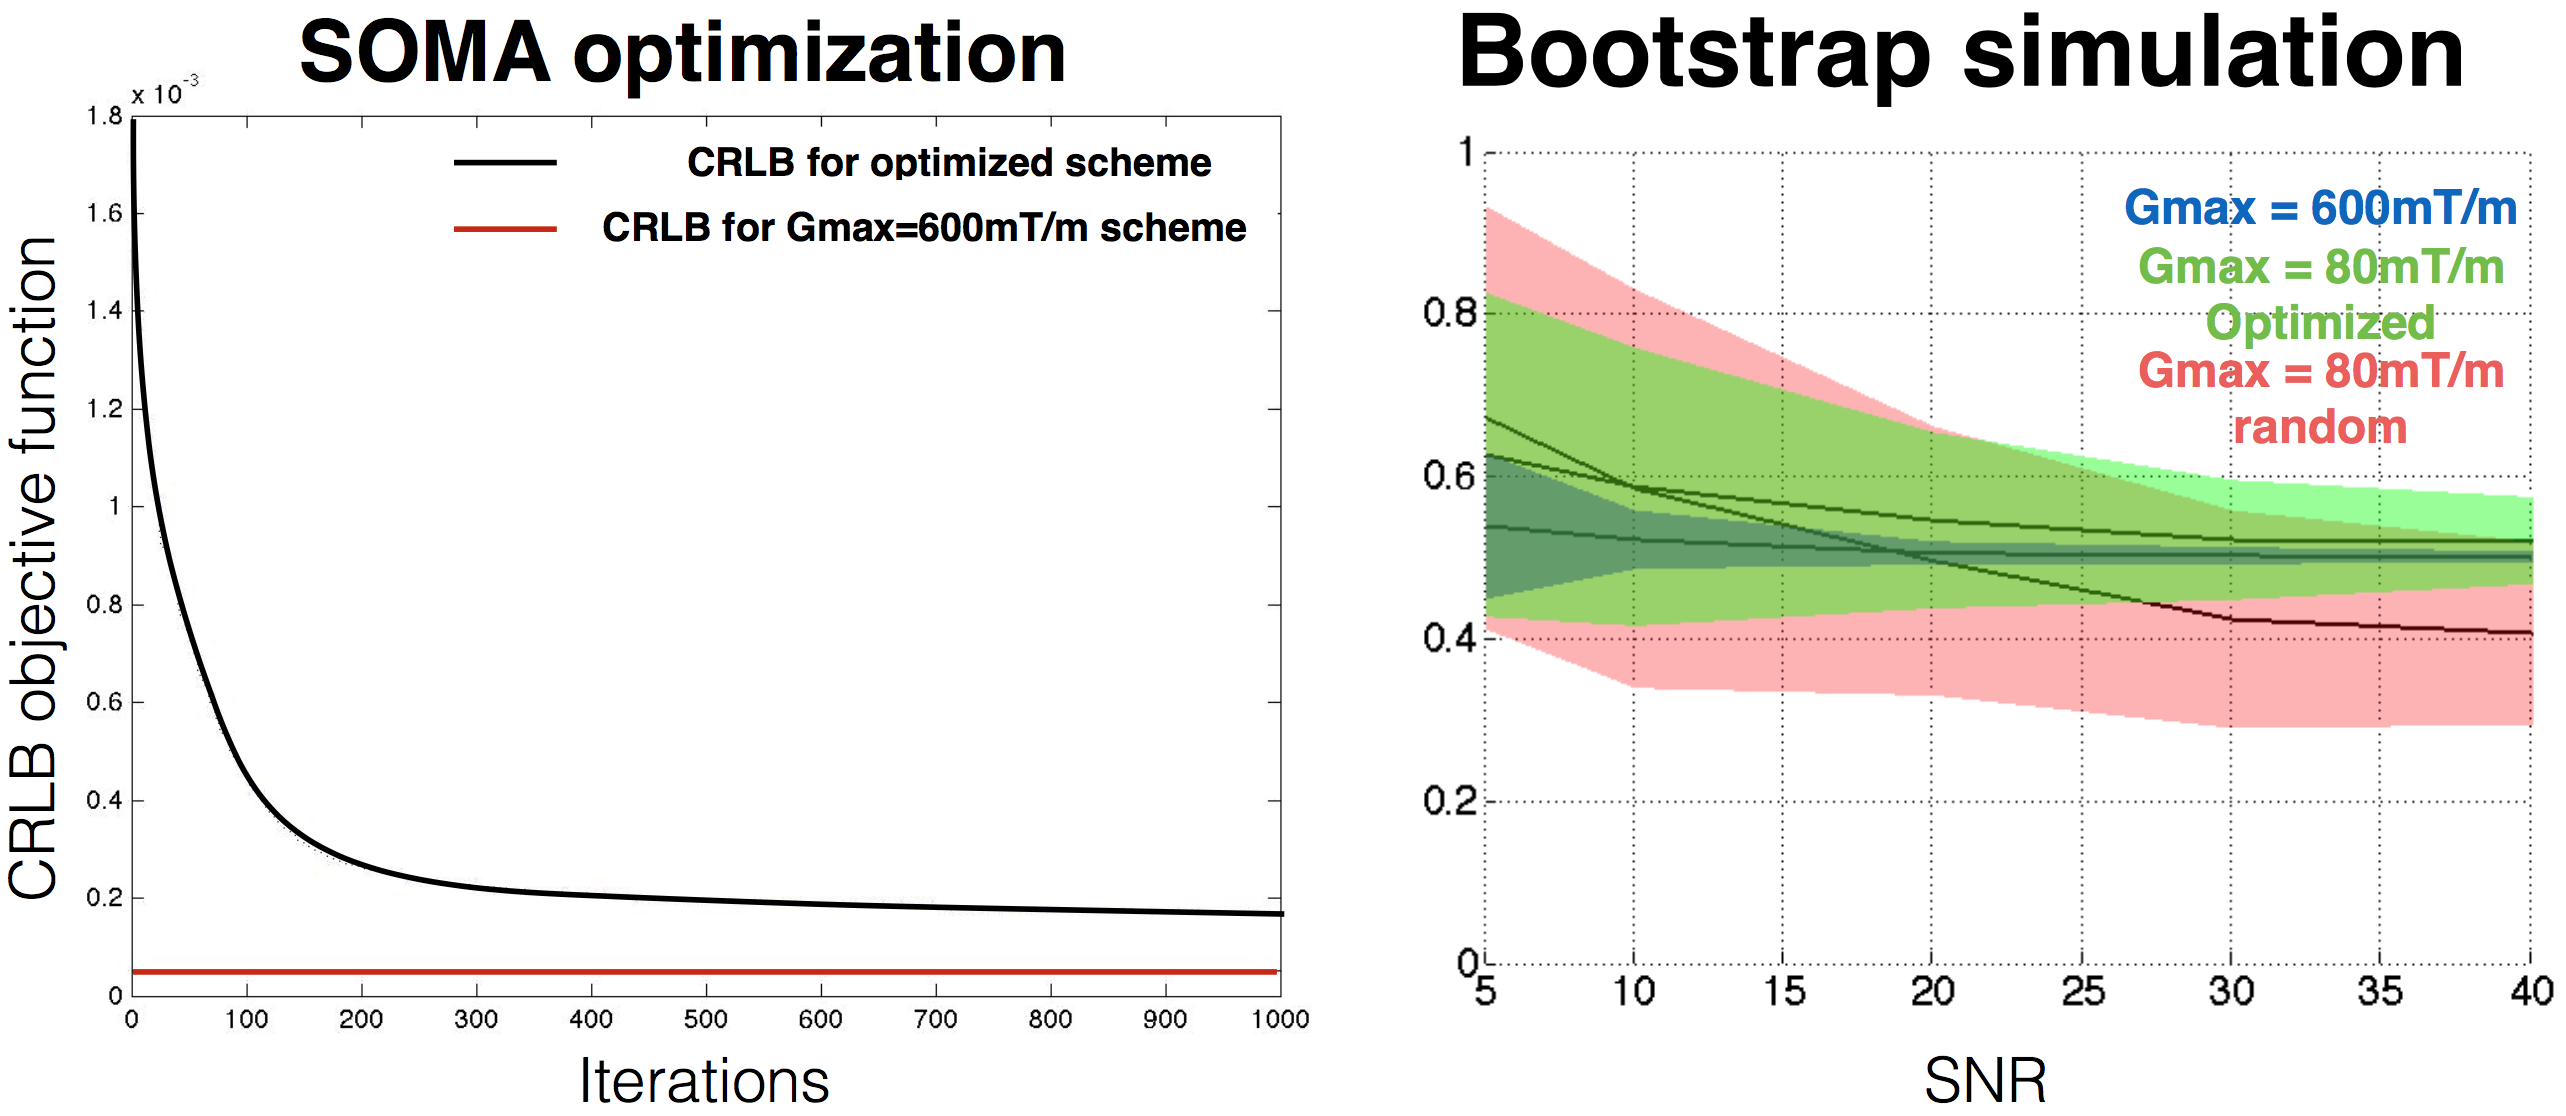
Experiment design. The protocol was optimized following the framework proposed by [7]: The SOMA algorithm (all-to-all adaptative, population of 100 schemes, 300 volumes per scheme, 1000 iterations) was used [8] to optimize the Gaussian Cramer-Rao Lower Bound (CRLB) objective function assuming S0=1, T2=70ms, fr=0.5, d=5µm, Dh=0.2µm2/ms, SNR=50 (at b=0 and TE=70ms) and the following boundaries Gmax=80mT/m, δ>3ms, ∆+δ+17ms=TE<80ms and ∆ > δ + 7ms. A k-means algorithm was then applied to the optimal scheme to extract only 10 combinations of ∆ and δ.
MRI. A cat spinal cord, perfused and post-fixed with 4% PFA was scanned on a 7T Agilent MRI scanner with a single-shot spin-echo EPI sequence. Diffusion gradients were applied perpendicular to the spinal cord (Matrix size 64x64x3, TE minimized, resolution 0.16x0.16x2mm3, SNR=35 in white matter at TE=55ms). The space (∆,δ,G) was sampled in three different ways (see Fig. 1a) : (1) Gmax=600mT/m, 204 volumes, ∆=20,35,40ms, δ=8ms; (2) Gmax=80mT/m, 1326 volumes, 25 combinations of ∆/δ sampled on a grid; (3) Solution of the SOMA optimization (Gmax=80mT/m, 300 volumes).
Fitting. Data were fitted using qDLab (https://github.com/neuropoly/qDLab) using (i) the full model or (ii) by fixing Srestricted=1 (assuming no detectable diffusion in the intra-axonal compartment).
Statistics. Simulation. A bootstrap analysis was done to validate the protocol design optimization and to study the precision of the metric fr for the three schemes at different SNR (5,10,20,30,40 at TE=70ms). 200 noisy datasets were simulated and then fitted for each SNR and scheme configuration. Data were generated using the model equation, Rician noise was then added 100 times. MRI Experiments. The protocol acquired with Gmax=600mT/m was used as a ground truth. The correlation coefficient and linear regression with this ground truth were computed for metric fr obtained using the (i) optimized scheme, (ii) the grid scheme and (iii) 10 random subsets (300 volumes over 1326) of the grid scheme.
Results
Simulation. Figure 1a shows the convergence of the CRLB using SOMA optimization. Figure 1b validates the protocol design by showing a better robustness to noise in term of precision and accuracy for metric fr for the optimized scheme, in particular at SNR=40 (STD(fr)=0.05, mean(fr-0.5)=0.02), compared to random schemes with 300 volumes (STD(fr)=0.12, mean(fr-0.5) = 0.06), but still much worse than the Gmax=600mT/m scheme (STD(fr)=0.007, mean(fr-0.5)=-3.10-5).
MRI experiments. Figure 2b shows, qualitatively, that all the datasets were correctly fitted by the model. Figure 2c shows the maps of metrics fr and d (axon diameter index) for the three different schemes. 600mT/m maps present a good contrast to noise ratio (CNR) suggesting good precision of the metrics. As expected, at lower gradient strength, axon diameter couldn’t be fitted precisely. Fixing Srestricted=1 (Fig 2d) qualitatively improves the consistency of metric fr in all three protocols. Good correlation coefficients (r2=0.76) and small deviation (-0.026) (see Fig 2c) were found when comparing the optimized metric fr to the ground truth (600mT/m protocol). The 10 random subsets all presented lower correlation (r2<0.7).
Conclusion
The fraction of restricted water (fr) can robustly be measured on systems equipped with 80mT/m gradients, with only small bias (<3%) compared to systems equipped with higher gradients. The CRLB correctly optimizes the protocol design by improving the sensitivity to microstructural differences (improved correlation). This study opens the way to the use of model-based diffusion MRI on clinical systems to measure microstructural features in the spinal cord in vivo.Acknowledgements
Study funded by MS Society of Canada, SMRRT (CIHR), Canada Research Chair, FRQS, FRQNT, QBIN and NSERC.References
[1] Y. Assaf et al., Magn. Reson. Med., 2008, 59, 1347.
[2] S.Y. Huang et al., Neuroimage, 2015, 106, 464.
[3] T. Duval et al., Neuroimage, 2015, 118, 494.
[4] U. Ferizi et al., Neuroimage, 2015, 118, 468.
[5] M. Nilsson et al., Magn. Reson. Mater. Phys. Biol. Med., 2013, 26, 345.
[6] L.Z. Wang, A. Caprihan, E. Fukushima, J. Magn. Reson. A, 1995, 117, 209.
[7] D.C. Alexander, Magn. Reson. Med., 2008, 60, 439.
[8] I. Zelinka, Springer Berlin Heidelberg, 2004, 167.
Figures