1759
Determining surface to volume ratios in capillary tube samples using oscillating gradient spin echo sequences1Physics and Astronomy, University of Manitoba, Winnipeg, MB, Canada, 2Radiology, University of Manitoba, 3Physics, University of Winnipeg, Winnipeg, MB, Canada
Synopsis
There is an increasing drive to use diffusion spectroscopy to infer the sizes of structures in samples. Most methods use pulsed gradient spin echo sequences which cannot provide short enough diffusion times to probe very small structures. Instead, we use oscillating gradient spin echo sequences (OGSE) to probe the short-time regime allowing for small structures to be measured. Here we use the apodised cosine OGSE to infer the surface to volume ratio of a collection of packed capillary tubes, and use it approximate the tube diameters.
Introduction
There is an increasing drive to use diffusion spectroscopy to infer the sizes of structures in samples1-4. Most methods use pulsed gradient spin echo sequences2,3 which cannot provide short enough diffusion times to probe very small structures. Using oscillating gradient spin echo sequences (OGSE)5-7 a diffusion spectrum can be obtained which probes the “short-time” or high frequency regime allowing for small structures to be measured. Here we use the apodised cosine OGSE7 to infer the surface to volume ratio of a collection of tubes, and thus the tube diameter.Methods
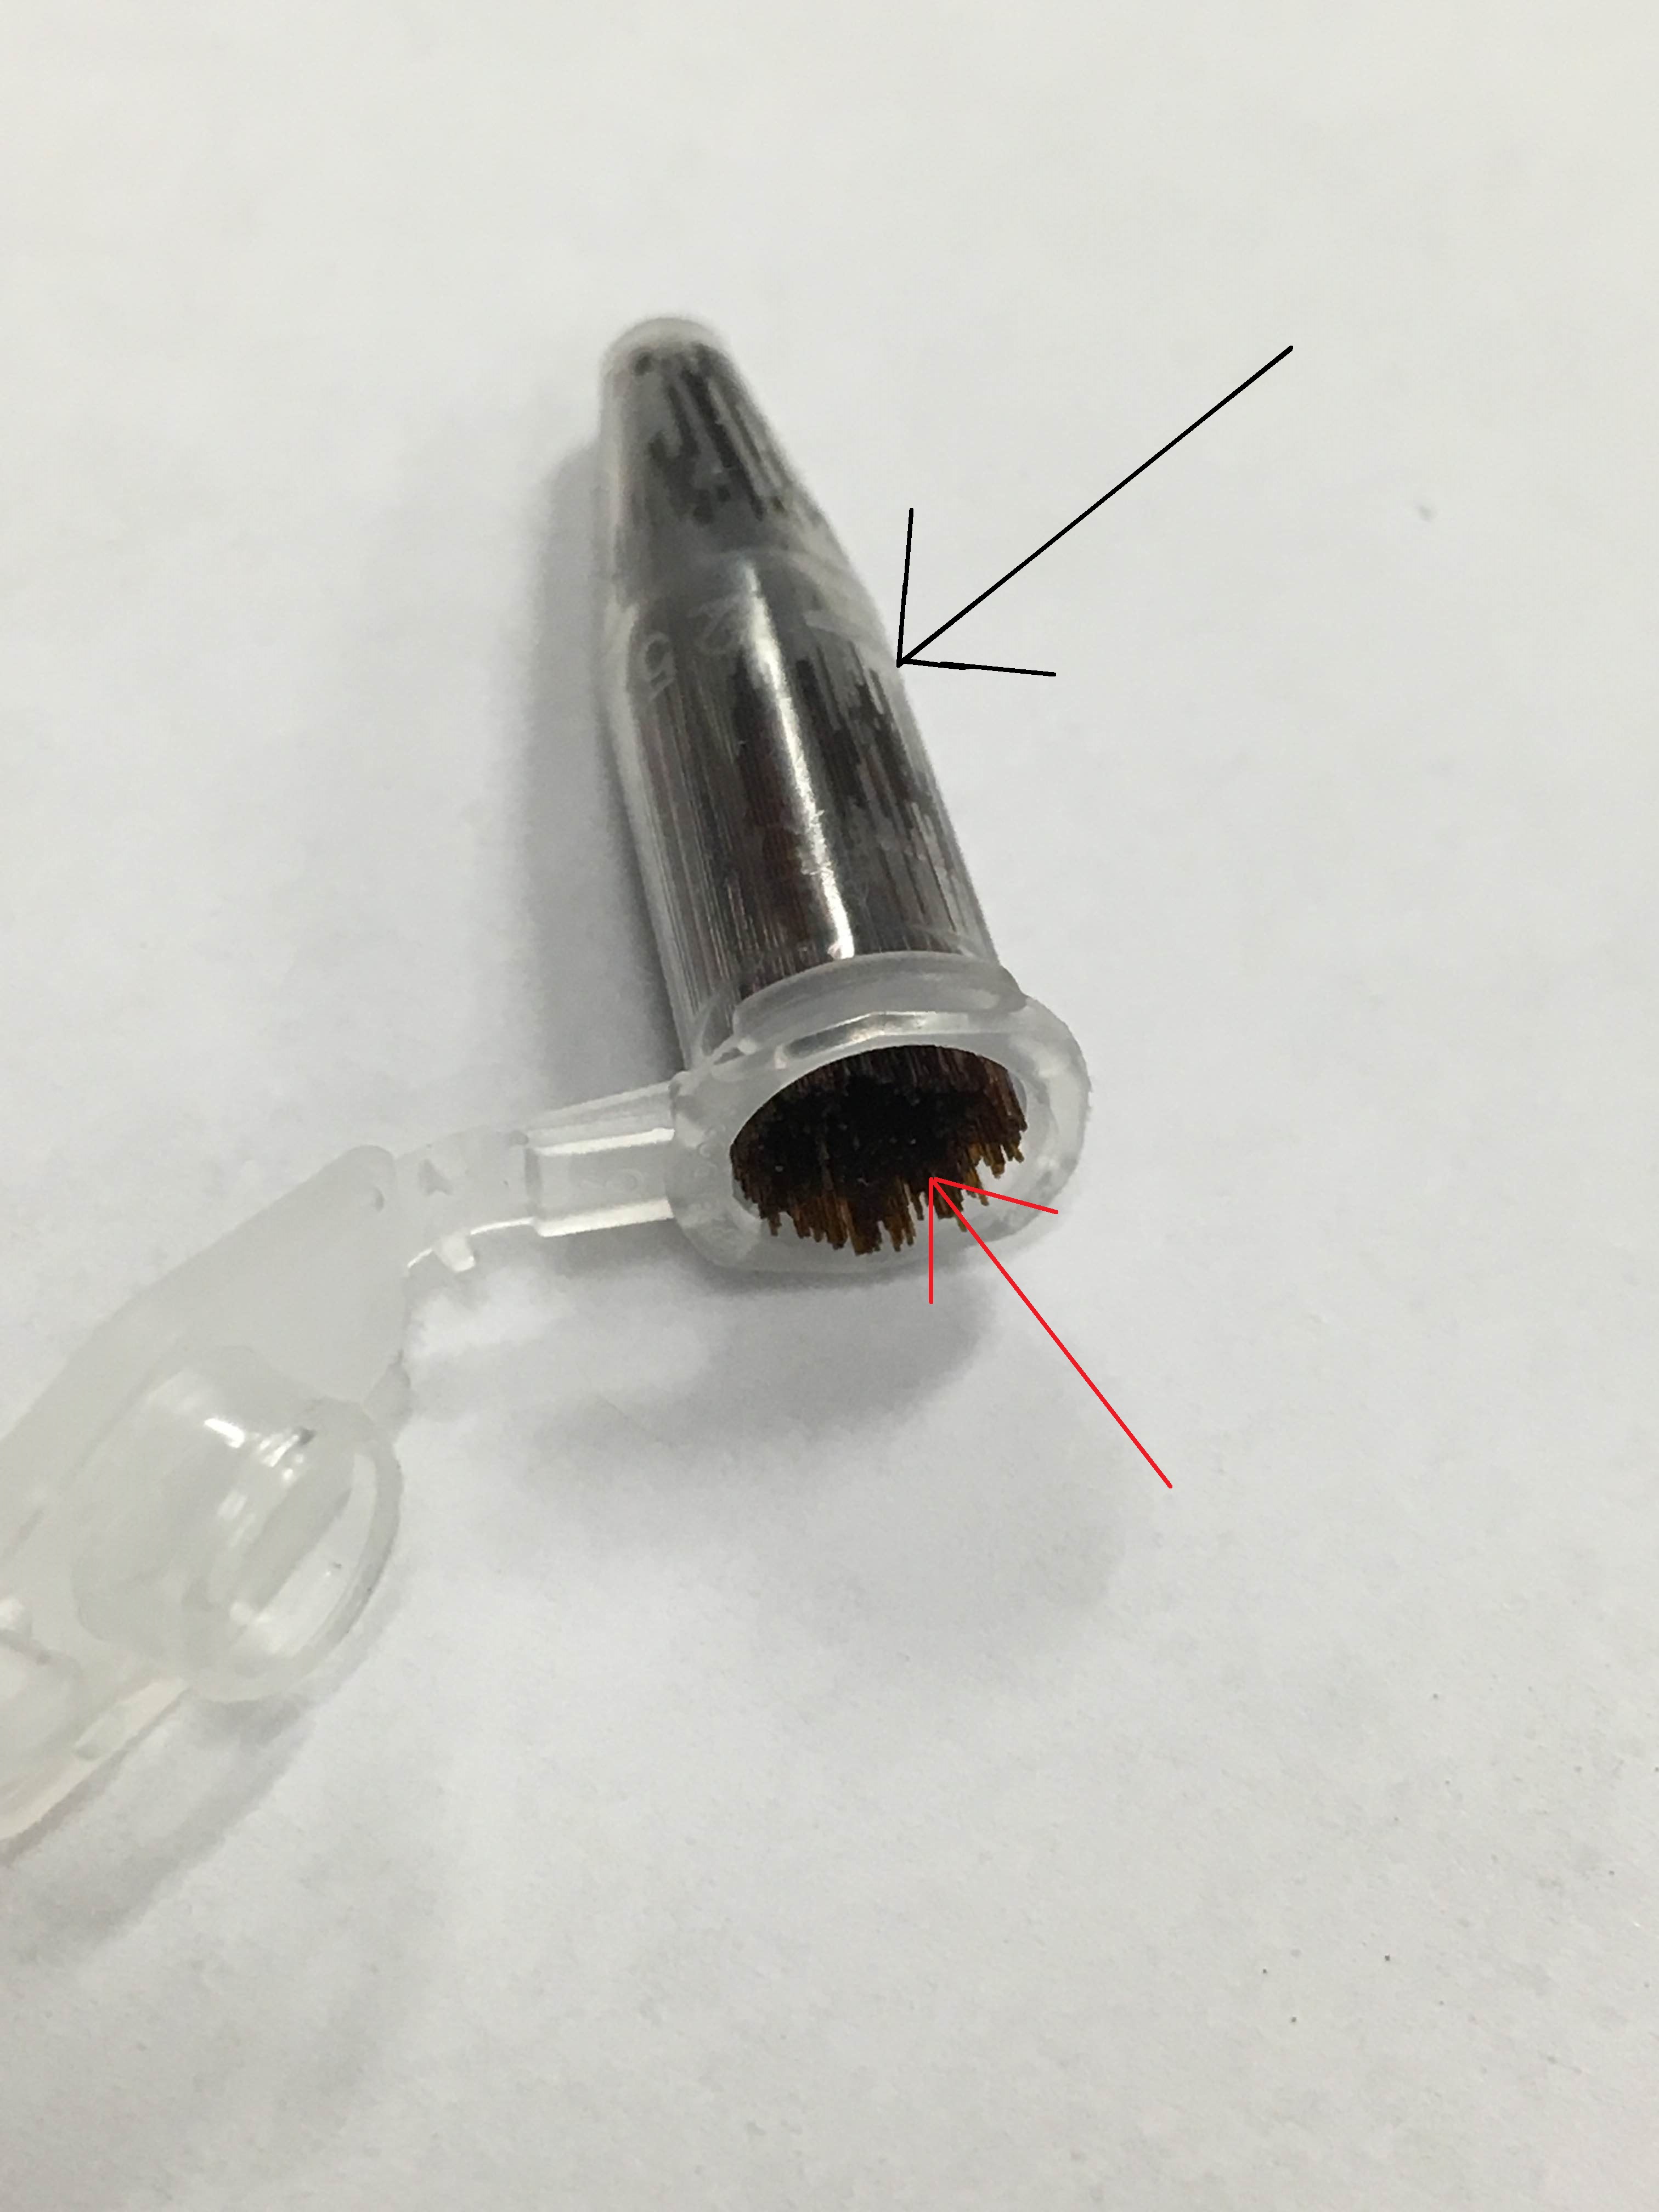
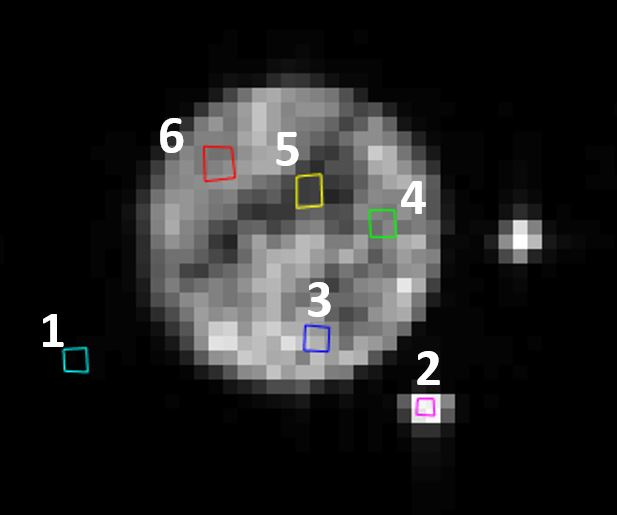
MRI The sample was imaged using a 7 T Bruker Avance III NMR system with Paravision 5.0 with a BGA6 gradient set with a maximum gradient strength of 1.01 T/m and a 3.5 cm diameter bird cage RF coil (Bruker Biospin). The number of sinusoidal waves in each 40 ms apodised cosine6 gradient pulse ranged from n = 1 to 20, in steps of 1. Five gradient strengths were used for each frequency and the gradient pulses were separated by 44.52 ms. The b-values were 0, 60, 120, 180, 240 s/mm2. Tubes Capillary tubing (Polymicro Technologies), were used with inner and outer diameters of 5 µm and 151 µm, respectively. Tubing was filled with filtered water, injected using a modified syringe8. Tubing was cut into 2 cm pieces (~ 500 in total), packed within a 1.5 mL plastic microcentrifuge tube (Cole Parmer), as shown in Figure 1. The volume of water within the tubes was not large enough to produce a measurable signal. Thus the tubes were soaked in filtered water, before being placed into a bird cage RF coil. Two 750 µm inner diameter tubes filled with filtered water were placed near the microcentrifuge tube and used as a control. A 10 mm thick (2.0 cm)2 slice perpendicular to the tubes was chosen. A 64 x 64 matrix was used for 312.5 μm in-plane resolution. Analysis Analysis ROIs were created in the water tubes (ROI #2), within the microcentrifuge tube (ROI #3-6), and in the noise (ROI #1) as shown in Figure 2. The mean $$$\pm$$$ standard deviation of the signal in the ROIs was calculated. The log of the signal versus b-value was fitted to a straight line and the negative of the slope was used as the ADC for each measurement. The mean $$$\pm$$$ standard deviation of the ADC for each frequency was calculated and used in the fit. Monte Carlo Simulation A Monte Carlo computer simulation (N = 57344) was conducted using a hexagonal array of 150 μm diameter cylinders (packing fraction = 0.8) to model the actual tube samples. The diffusion coefficient for water in the interstitial space was 2.0 μm2/ms with no water in the cylinders. All barriers had zero permeability and the time step was 1 μs. Simulations used the same pulse parameters as those in the experiment. 1% Gaussian noise was added to the data. Tube fit The diffusion spectrum D($$$\omega$$$) for the apodised cosine sequence data were fitted to the short-time surface to volume model described in Ref. [9]. The diffusion spectrum at short diffusion times ($$$\Delta$$$ ~ 1/$$$\omega$$$) is $$$D(\omega) = D_0(1 - c(n)c_d(S/V)\sqrt{D_0/\omega})$$$ where D0 is the free diffusion coefficient, and c(n) and cd are numerical factors. Both D0 and the surface to volume ratio were extracted from the fit. We assumed that the tubes were tightly packed in a hexagonal lattice. In a tightly packed hexagonal lattice of cylinders, the surface to volume ratio is related to the cylinder diameter d through the relation $$$d = 4f/[(1-f)(S/V)]$$$, where f is the packing fraction of the tubes. This relation was used to relate the surface to volume ratio to the tube diameter.Results
ADC vs frequency for both the simulation and a representative ROI (#4 in Figure 1) is plotted in Figure 3. The fits are shown with solid lines. For the simulation, the fitted surface to volume ratio was 0.10 ± 0.02 µm-1 corresponding to diameters of 160 ± 20 µm. For the real data, the surface to volume ratio was found to be 0.09 ± 0.01 µm-1. Assuming 80 percent hexagonal packing, this corresponds to tube diameters of 180 ± 30 µm.Discussion and Conclusion
This work provides experimental evidence for using apodised cosine OGSE to infer the size of small structures. This work lays the foundation for inferring the size of tissue structures, such as axon diameters, in samples using MRI. Future studies will assess optimizing the frequency ranges and gradient strengths for the expected compartment sizes.Acknowledgements
The authors would like to thank funding from NSERC, CFI and MRIF, and D. Goultz and D. Craig for assistance filling the tubes.References
1. Parsons EC, Does MD, Gore JC. Temporal diffusion spectroscopy: Theory and implementation in restricted systems using oscillating gradients. Magn Reson Med 2006;55:75-84
2. Assaf Y, Blumenfeld-Katzir T, Yovel Y, Basser PJ. AxCaliber: a method for measuring axon diameter distribution from diffusion MRI. Magn Reson Med 2008;59:1347-1354
3. Alexander DC, Hubbard PL, Hall MG, Moore EA, Ptito M, Parker GJ, Dyrby TB. Orientationally invariant indices of axon diameter and density from diffusion MRI. Neuroimage 2010;52:1374-89
4. Martin M. Measuring Restriction Sizes Using Diffusion Weighted Magnetic Resonance Imaging: A Review. Magn Reson Insights, 2013;6:59-64
5. Mercredi M, Vincent TJ, Bidinosti CP, Martin M. Assessing the accuracy of using oscillating gradient spin echo sequences with AxCaliber to infer micron-sized axon diameters. Magn Reson Mater Phy 2016; doi:10.1007/s10334-016-0575-y
6. Schachter M, Does MD, Anderson AW, Gore JC. Measurements of restricted diffusion using an oscillating gradient spin-echo sequence. J Magn Reson 2000;147:232–237
7. Does M, Parsons E, Gore J. Oscillating gradient measurements of water diffusion in normal and globally ischemic rat brain. Magn Reson Med 2003;49(2):206–215
8. Craig DB. A simple system for the measurement of the distribution of activities of individual molecules of E. coli beta-galactosidase. Anal Methods 2012;4(1):85-88
9. Reynaud O, Winters KV, Hoang DM, Wadghiri YZ, Novikov DS, Kim SG. Surface-to-volume ratio mapping of tumor microstructure using oscillating gradient diffusion weighted imaging. Magn Reson Med 2016;76:237-247
Figures