1758
Determining how varying the number of gradients measurements affects fitted surface to volume ratios in tube samples using oscillating spin echo gradients1Physics and Astronomy, University of Manitoba, Winnipeg, MB, Canada, 2Radiology, University of Manitoba, 3Physics, University of Winnipeg, Winnipeg, MB, Canada
Synopsis
There is an increasing drive to use diffusion spectroscopy to infer the sizes of structures in samples. Here, we use apodised cosine gradient spin echo sequences (OGSE) to infer the surface to volume ratio of a collection of packed capillary tubes. Aiming to reduce imaging times, this study examines how the number of gradients affects the accuracy and precision of the fitted parameters. We found that collecting OGSE data with two b-values may be sufficient to infer information about small structures, especially if higher gradients strengths are used.
Introduction
There
is an increasing drive to use diffusion spectroscopy to infer the sizes of
structures in samples1-4. Most methods use pulsed gradient spin echo
sequences2,3 which cannot provide short enough diffusion times to
probe very small structures. Using oscillating gradient spin echo sequences
(OGSE)5-7 a diffusion spectrum can be obtained which probes the
“short-time” or high frequency regime allowing for small structures to be
measured. Previous OGSE measurements used long imaging times with multiple
gradient strengths in fit models to infer sample dimensions8. In an
effort to shorten imaging times, this study examines the effects the number of
gradients used to infer the surface to volume ratio of a collection of tubes.
We found that imaging time can be reduced by a factor of 2.5 in exchange for a
decrease in precision of 18 percent.Methods
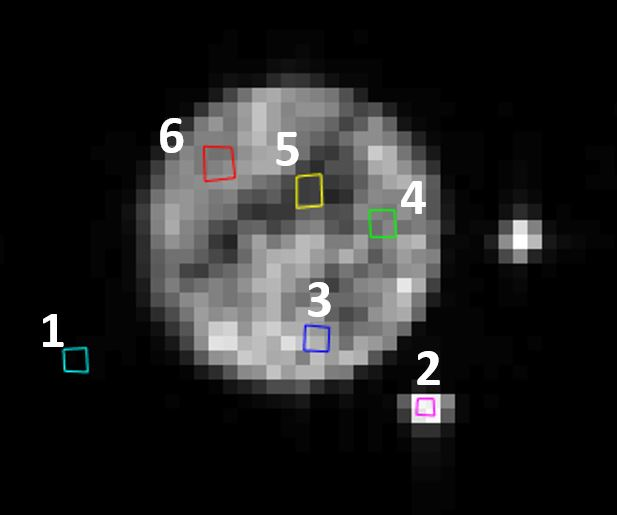
MRI Each sample was imaged using a 7 T Bruker Avance III NMR system with Paravision 5.0 with a BGA6 gradient set with a maximum gradient strength of 1.01 T/m and a 3.5 cm diameter bird cage RF coil (Bruker Biospin). The number of sinusoidal waves in each 40 ms apodised cosine6 gradient pulse ranged from n = 1 to 20, in steps of 1. Five gradient strengths were used for each frequency and the gradient pulses were separated by 44.52 ms. The b-values were 0, 60, 120, 180, 240 s/mm2. Tubes: Capillary tubing (Polymicro Technologies), were used with inner and outer diameters of 5 µm and 151 µm, respectively. Tubing was filled with filtered water, injected using a modified syringe9. Tubing was cut into 2 cm pieces (~ 500 in total), packed within a 1.5 mL plastic microcentrifuge tube (Cole Parmer). The volume of water within the tubes was not large enough to produce a measurable signal. Thus the tubes were soaked in filtered water, before being placed into a bird cage RF coil. Two 750 µm inner diameter tubes filled with filtered water were placed near the microcentrifuge tube and used as a control. A 10 mm thick (2.0 cm)2 slice perpendicular to the tubes was chosen. A 64 x 64 matrix was used for 312.5 μm in-plane resolution. Analysis ROIs were created in the water tubes (ROI #2), within the microcentrifuge tube (ROI #3-6), and in the noise (ROI #1) as shown in Figure 1. The mean ± standard deviation of the signal in the ROIs was calculated. The log of the signal versus b-value was fitted to a straight line and the negative of the slope was used as the ADC for each measurement. The mean ± standard deviation of the ADC for each frequency was calculated and used in the fit. Calculation of ADCs and subsequent model fitting was repeated using all possible combinations of the five b-values. Tube fit The diffusion spectrum D($$$\omega$$$) for the apodised cosine sequence data were fitted to the short-time surface to volume model described in Ref. [10] and the surface to volume ratio (S/V) was extracted from the fit. Assuming a hexagonal array of cylinders, the surface to volume ratio is related to the cylinder diameter d through the relation $$$d = 4f/[(1-f)(S/V)]$$$, where f is the packing fraction of the tubes. This relation was used to relate the surface to volume ratio to the tube diameter.Results
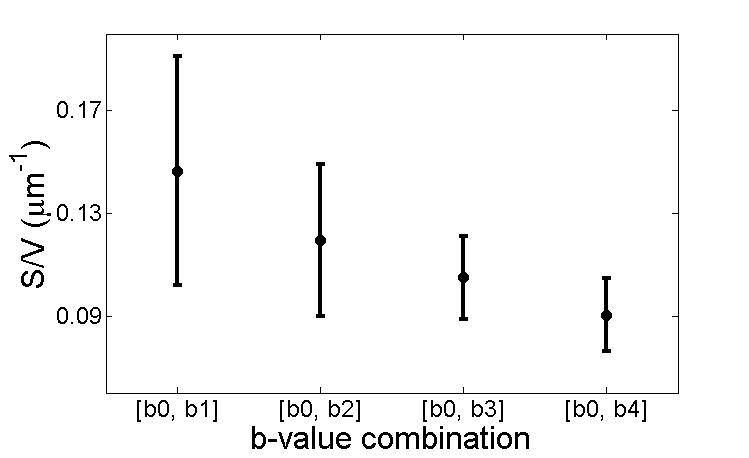
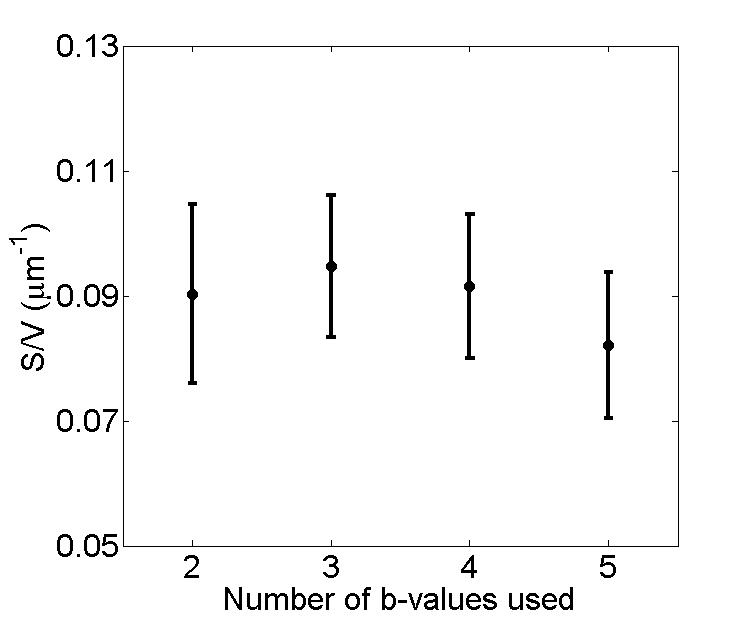
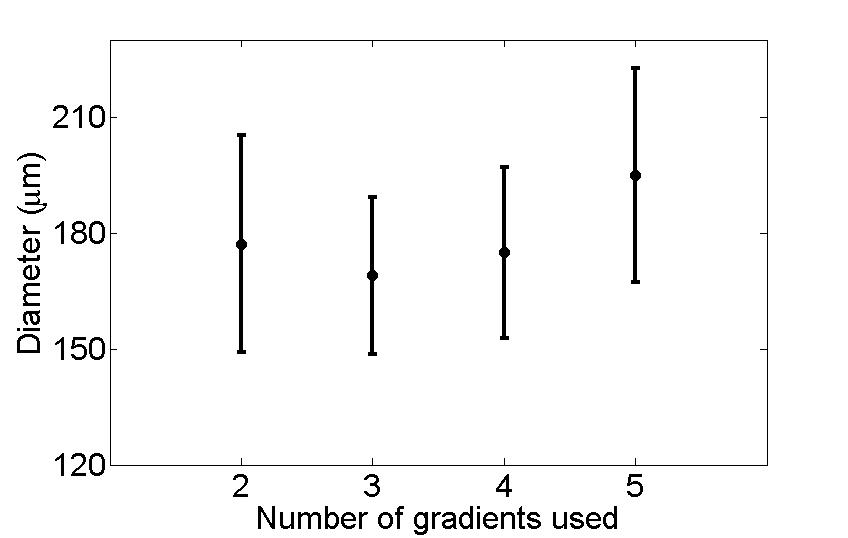
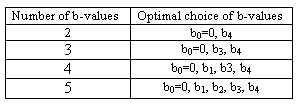
Figure 2 shows variation in fitted S/V ± fitted error when using only two b-values. Note that uncertainty decreases when larger gradients are used, with fitted S/V values ranging from .09 ± .01 µm-1 with the highest b-value to .15 ± .04 µm-1 with the smallest b-value. Figure 3 shows fitted S/V ± fitted error for the best combinations for each number of gradients (these combinations are shown in Table 1). The fitted values in Figure 3 are all within 13% of each other, while error when using two gradients is only 18% larger than when using all five gradients. Shown in Figure 4 are the corresponding tube diameters found from each combination of gradients from Figure 3 (assuming 80 percent packing). The estimated diameters are all within 13% of each other, while their estimated errors are within 30% of each other.Discussion and Conclusion
This work provides experimental evidence that collecting OGSE data with two b-values may be sufficient to infer information about small structures, such as axon diameters, especially if higher gradients strengths are used. This would allow for shorter imaging times. Future studies will determine the optimal frequency ranges and gradient strengths for the expected restriction sizes.Acknowledgements
The authors would like to thank funding from NSERC, CFI and MRIF, and D. Goultz and D. Craig for assistance filling the tubes.References
1. Parsons EC, Does MD, Gore JC. Temporal diffusion spectroscopy: Theory and implementation in restricted systems using oscillating gradients. Magn Reson Med 2006;55:75-84
2. Assaf Y, Blumenfeld-Katzir T, Yovel Y, Basser PJ. AxCaliber: a method for measuring axon diameter distribution from diffusion MRI. Magn Reson Med 2008;59:1347-1354
3. Alexander DC, Hubbard PL, Hall MG, Moore EA, Ptito M, Parker GJ, Dyrby TB. Orientationally invariant indices of axon diameter and density from diffusion MRI. Neuroimage 2010;52:1374-89
4. Martin M. Measuring Restriction Sizes Using Diffusion Weighted Magnetic Resonance Imaging: A Review. Magn Reson Insights 2013;6:59-64
5. Mercredi M, Vincent TJ, Bidinosti CP, Martin M. Assessing the accuracy of using oscillating gradient spin echo sequences with AxCaliber to infer micron-sized axon diameters. Magn Reson Mater Phy 2016; doi:10.1007/s10334-016-0575-y
6. Schachter M, Does MD, Anderson AW, Gore JC. Measurements of restricted diffusion using an oscillating gradient spin-echo sequence. J Magn Reson 2000;147:232–237
7. Does M, Parsons E, Gore J. Oscillating gradient measurements of water diffusion in normal and globally ischemic rat brain. Magn Reson Med 2003;49(2):206–215
8. Herrera SL, Mercredi ME, Vincent TJ, Buist R, Martin M, Using oscillating gradient spin-echo sequences to infer micron-sized bead and pore radii. ISMRM 2015, 3027
9. Craig DB. A simple system for the measurement of the distribution of activities of individual molecules of E. coli beta-galactosidase. Anal Methods 2012;4(1):85-88
10. Reynaud O, Winters KV, Hoang DM, Wadghiri YZ, Novikov DS, Kim SG. Surface-to-volume ratio mapping of tumor microstructure using oscillating gradient diffusion weighted imaging. Magn Reson Med 2016;76:237-247
Figures