1757
T2 relaxation rates of the fast and slow bi-exponential diffusion components in the in vivo corpus callosum1Massachusetts General Hospital, Charlestown, MA, United States, 2Harvard-MIT Division of Health Sciences and Technology, MIT, Cambridge, MA, United States
Synopsis
Bi-exponential diffusion model is widely used to fit for non-Gaussian diffusion. T2 relaxation rates differ between structural compartments, which may bias the results of fits to microstructure models. We incorporate T2 relaxation into the bi-exponential model and leveraged the Gmax = 300mT/m gradient strength of the Connectome scanner to study the apparent T2 times of the two diffusion components. A longer T2 was found for the fast diffusion component when the model allows for different T2 times, but both multiple T2s and single T2 models seem to fit to the data fairly well. The added T2 parameter affects volume fraction more than diffusivity estimates.
Introduction
Bi-exponential diffusion models are widely used to fit for non-Gaussian diffusion, although the physical meaning of the fast and slow components remains unclear. The results are hard to interpret also partly because of the confounds from T2-weighting. T2 relaxation rates differ between different structural compartments (myelin, intracellular, extracellular), which may bias the results of fits to microstructure models. But they can also provide an additional dimension to complement diffusion measurement1-3. However, diffusion weighted T2 measurements in high b-value regime (i.e., >5000s/mm2) are challenging for in vivo human imaging, because the minimum TE on conventional scanners is usually high. In this work, we leveraged the Gmax = 300 mT/m gradient strength of the Connectome scanner to measure the apparant T2 values of the fast and slow diffusion compartments seen with a diffusion gradient transverse to the fibers in the corpus callosum.Method
Data Acquisition and Preprocessing
Data were acquired with a spin-echo EPI sequence with unipolar diffusion-sensitizing gradients in two healthy subjects on the 3T Connectome Scanner. Sagittal slices were acquired with 2 mm in-plane resolution and slice thickness of 3 mm. The diffusion-sensitizing gradients were applied perpendicular to the fibers in the corpus callosum (along A-P direction). Each run starts with two b=0 images, followed by 8 repetitions of DW images (TR = 3s). Five b-values (1000, 2000, 4000, 7000, 10000 s/mm2, with fixed δ/Δ = 12/24ms) and 8 TEs (55, 65, 75, 85, 100, 120, 150, 190ms) were sampled. Head motion and eddy current distortions were corrected using linear registration tools4-6.
Data Analysis
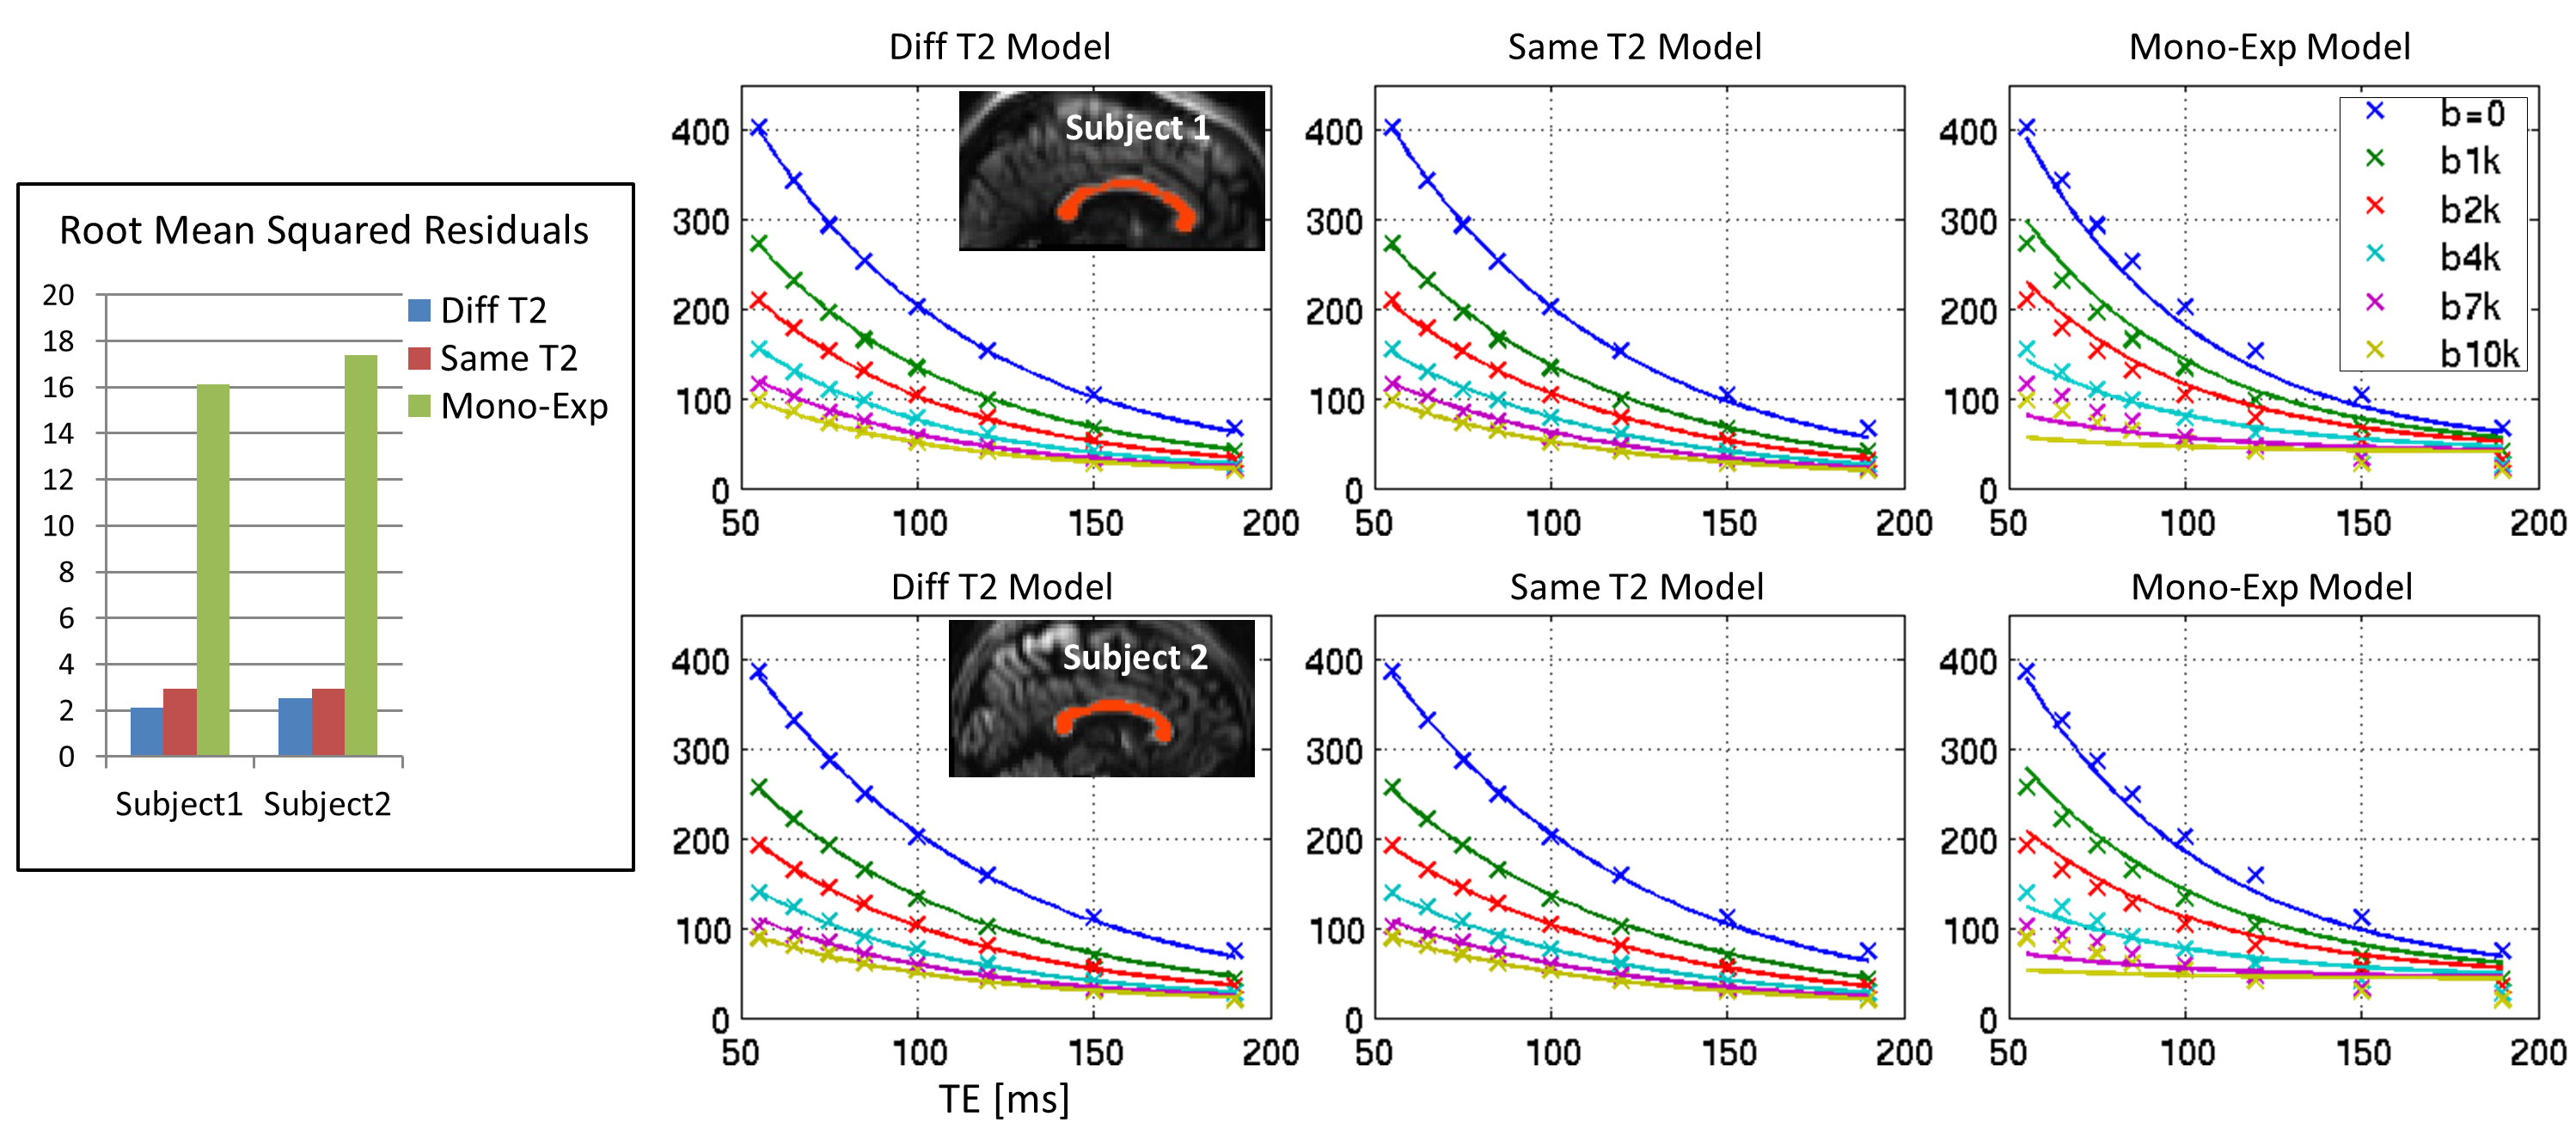
We focus on a sagittal slice through the center of the corpus callosum. A mask was manually drawn (Figure 1). The ROI-averaged signal was fit to a bi-exponential model with each of the two components having differing T2 values (Diff-T2 model):
$$S(b,TE)=M_{0} (f_{A}\cdot e^{-bD_{A}}\cdot e^{-\frac{TE}{T2_{A}}}+(1-f_{A})\cdot e^{-bD_{B}}\cdot e^{-\frac{TE}{T2_{B}}})$$
We also considered the bi-exponential model with two components sharing the same T2 value (Same-T2 model):
$$S(b,TE)=M_{0} (f_{A}\cdot e^{-bD_{A}}+(1-f_{A})\cdot e^{-bD_{B}})\cdot e^{-\frac{TE}{T2}}$$
Finally a mono-exponential (Mono-Exp) model was also studied for reference:
$$S(b,TE) = M_{0} e^{-bD}\cdot e^{-\frac{TE}{T2}}$$
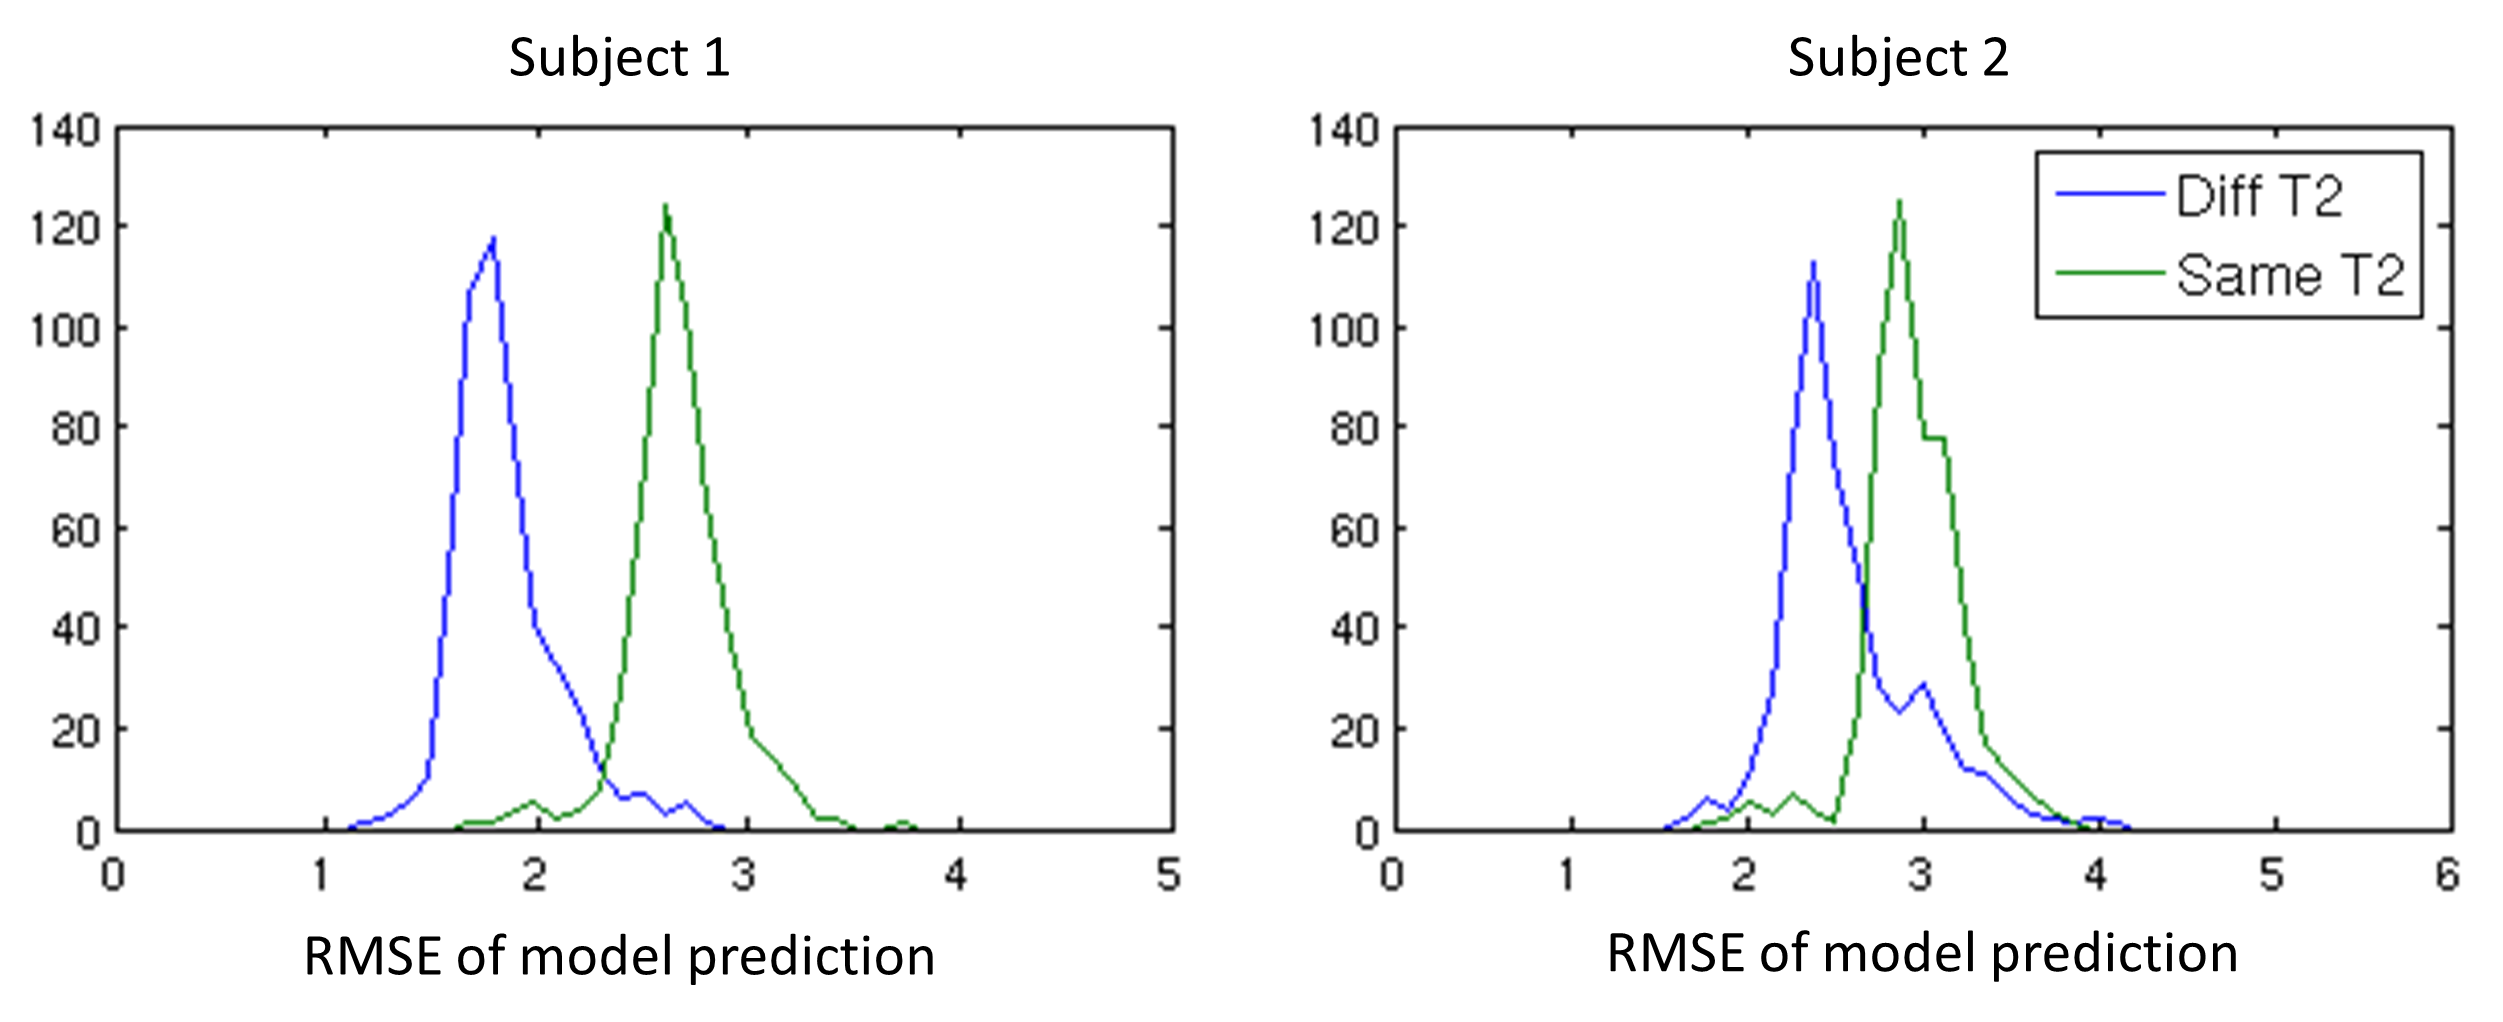
The fitting was performed in MATLAB, minimizing the sum-of-squared difference between model prediction and measured data. The search was initialized from a number of points equally spaced in the {fA, DA, DB, T2A, T2B} dimensions to avoid local minima. The RMSE of fitting residuals were compared between the 3 models. For the Diff-T2 model and the Same-T2 model, a four-fold cross-validation was performed where the root-mean-squared model prediction errors were compared.
Results
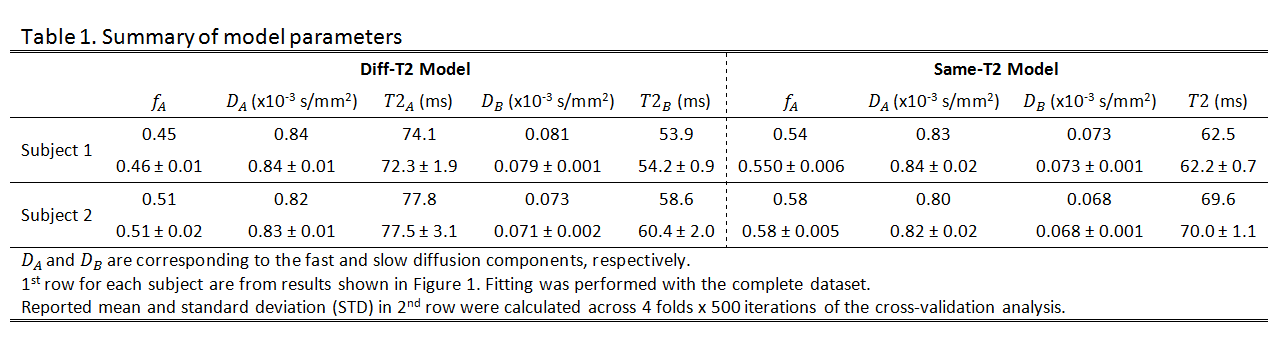
Both the Diff-T2 and Same-T2 models fit to the data fairly well (Figure 1). The Mono-Exp model does not fit to the data well, and was dropped for the rest of the analyses. The results of the parameter fit for the Diff-T2 and Same-T2 models are summarized in Table 1.
The cross-validation results show that the Diff-T2 model yields smaller model prediction errors than the Same-T2 model (Figure 2), but the histograms are not completely separate, suggesting the Diff-T2 model is only moderately preferred against the Same-T2 model.
The fitted parameters show good reliability across 4 folds x 500 iterations for both models (Table 1). For the Diff-T2 model, the fast component has a longer T2 than the slow component. Both T2 values are within a meaningful range reported in brain white matter7. The shared T2 value obtained from the Same-T2 model seems to be a weighted average of the two T2 values obtained from the Diff-T2 Model. This T2-weighting is mainly reflected in the fitted apparent volume fractions, while the fitted fast and slow diffusivity values are not remarkably different between the two models.
Discussions
We incorporate the T2 relaxation into the bi-exponential model to study the apparent T2 times of the two diffusion components. When the model is allowed for different T2 parameters for each diffusion compartment, both subjects showed a longer T2 for the fast diffusion component. Data show that two diffusion constants are needed to explain the data, but the preference for multiple T2s in the model (Diff-T2) compared to a single T2 parameter (Same-T2) is less prominent. The two diffusivity values obtained from the two models are very similar. This suggests that extending models to include different R2 rates may not be consequential for the diffusivity estimates. But, when a second T2 is included in the model, the estimated volume fractions are changed. Thus, in microstructure models where volume fraction is an important output, it may be important to allow for T2 differences in the compartments. This may have implications for advanced microstructure modeling efforts of disease states.Acknowledgements
The work is supported by funding from the National Institutes of Health Blueprint Initiative for Neuroscience Research Grant U01-MH093765, NIBIB grant P41-EB015896 and the Instrumentation Grants S10-RR023401, S10-RR023043, and S10-RR019307.References
1. Kim, D., Kim, J.H. & Haldar, J.P. Diffusion-Relaxation Correlation Spectroscopic Imaging (DR-CSI): An Enhanced Approach to Imaging Microstructure. Proc. ISMRM (2016).
2. Peled, S. Water diffusion, T(2) and compartmentation in frog sciatic nerve. Magn Reson Med 43, 620 (2000).
3. Stanisz, G.J. & Henkelman, R.M. Diffusional anisotropy of T2 components in bovine optic nerve. Magn Reson Med 40, 405-410 (1998).
4. Jenkinson, M., Bannister, P., Brady, M. & Smith, S. Improved optimization for the robust and accurate linear registration and motion correction of brain images. Neuroimage 17, 825-841 (2002).
5. Jenkinson, M. & Smith, S. A global optimisation method for robust affine registration of brain images. Med Image Anal 5, 143-156 (2001).
6. Reuter, M., Rosas, H.D. & Fischl, B. Highly accurate inverse consistent registration: a robust approach. Neuroimage 53, 1181-1196 (2010).
7. Stanisz, G.J., et al. T1, T2 relaxation and magnetization transfer in tissue at 3T. Magn Reson Med 54, 507-512 (2005).
Figures