1756
MR imaging of the cervical spinal cord in patients with spinal muscular atrophy and healthy controls1Department of Radiology, University Medical Center Utrecht, Utrecht, Netherlands, 2Department of Forensic Medicine and Comparative Medicine Lab, Aarhus University, Aarhus, Denmark, 3Department of Neurology, University Medical Center Utrecht, Utrecht, Netherlands, 4Department of Radiotherapy, Cancer Center, University Medical Center Utrecht, Utrecht, Netherlands, 5Image Sciences Institute, University Medical Center Utrecht, Utrecht, Netherlands
Synopsis
We studied the architecture and diffusion characteristics in the cervical spine and nerves in spinal muscular atrophic (SMA) patients and healthy controls. We showed the asymmetrical architectural configuration of the cervical nerves in SMA patients. We computed diffusion values of which the mean, axial, and radial diffusivity were lower in the SMA patients than in healthy controls which are in accordance with the clinical symptoms of these patients. Diffusion values of the cervical spine (grey, white and the whole myelum) showed no differences.
Purpose
The pathophysiological hallmark of spinal muscular atrophy (SMA) is the degeneration of alpha motor neurons in the grey matter of the spinal cord, which leads to muscle weakness and atrophy1. Current knowledge about this spinal cord pathology is mostly based on animal2 or post-mortem studies3. The structural changes in SMA progression remain to be elucidated. Diffusion tensor imaging (DTI) offers the possibility to evaluate microstructural properties of nervous structures and has been successfully used in the cervical spine in vivo4,5 and ex vivo6. It is therefore an excellent candidate to study SMA patients. The aim of this work is to show the feasibility of fiber tractography (FT) in the cervical spine and peripheral nerves and to quantify their diffusion properties in SMA patients and healthy controls (HC), which we expect to be altered in nerves innervating affected muscles.Methods
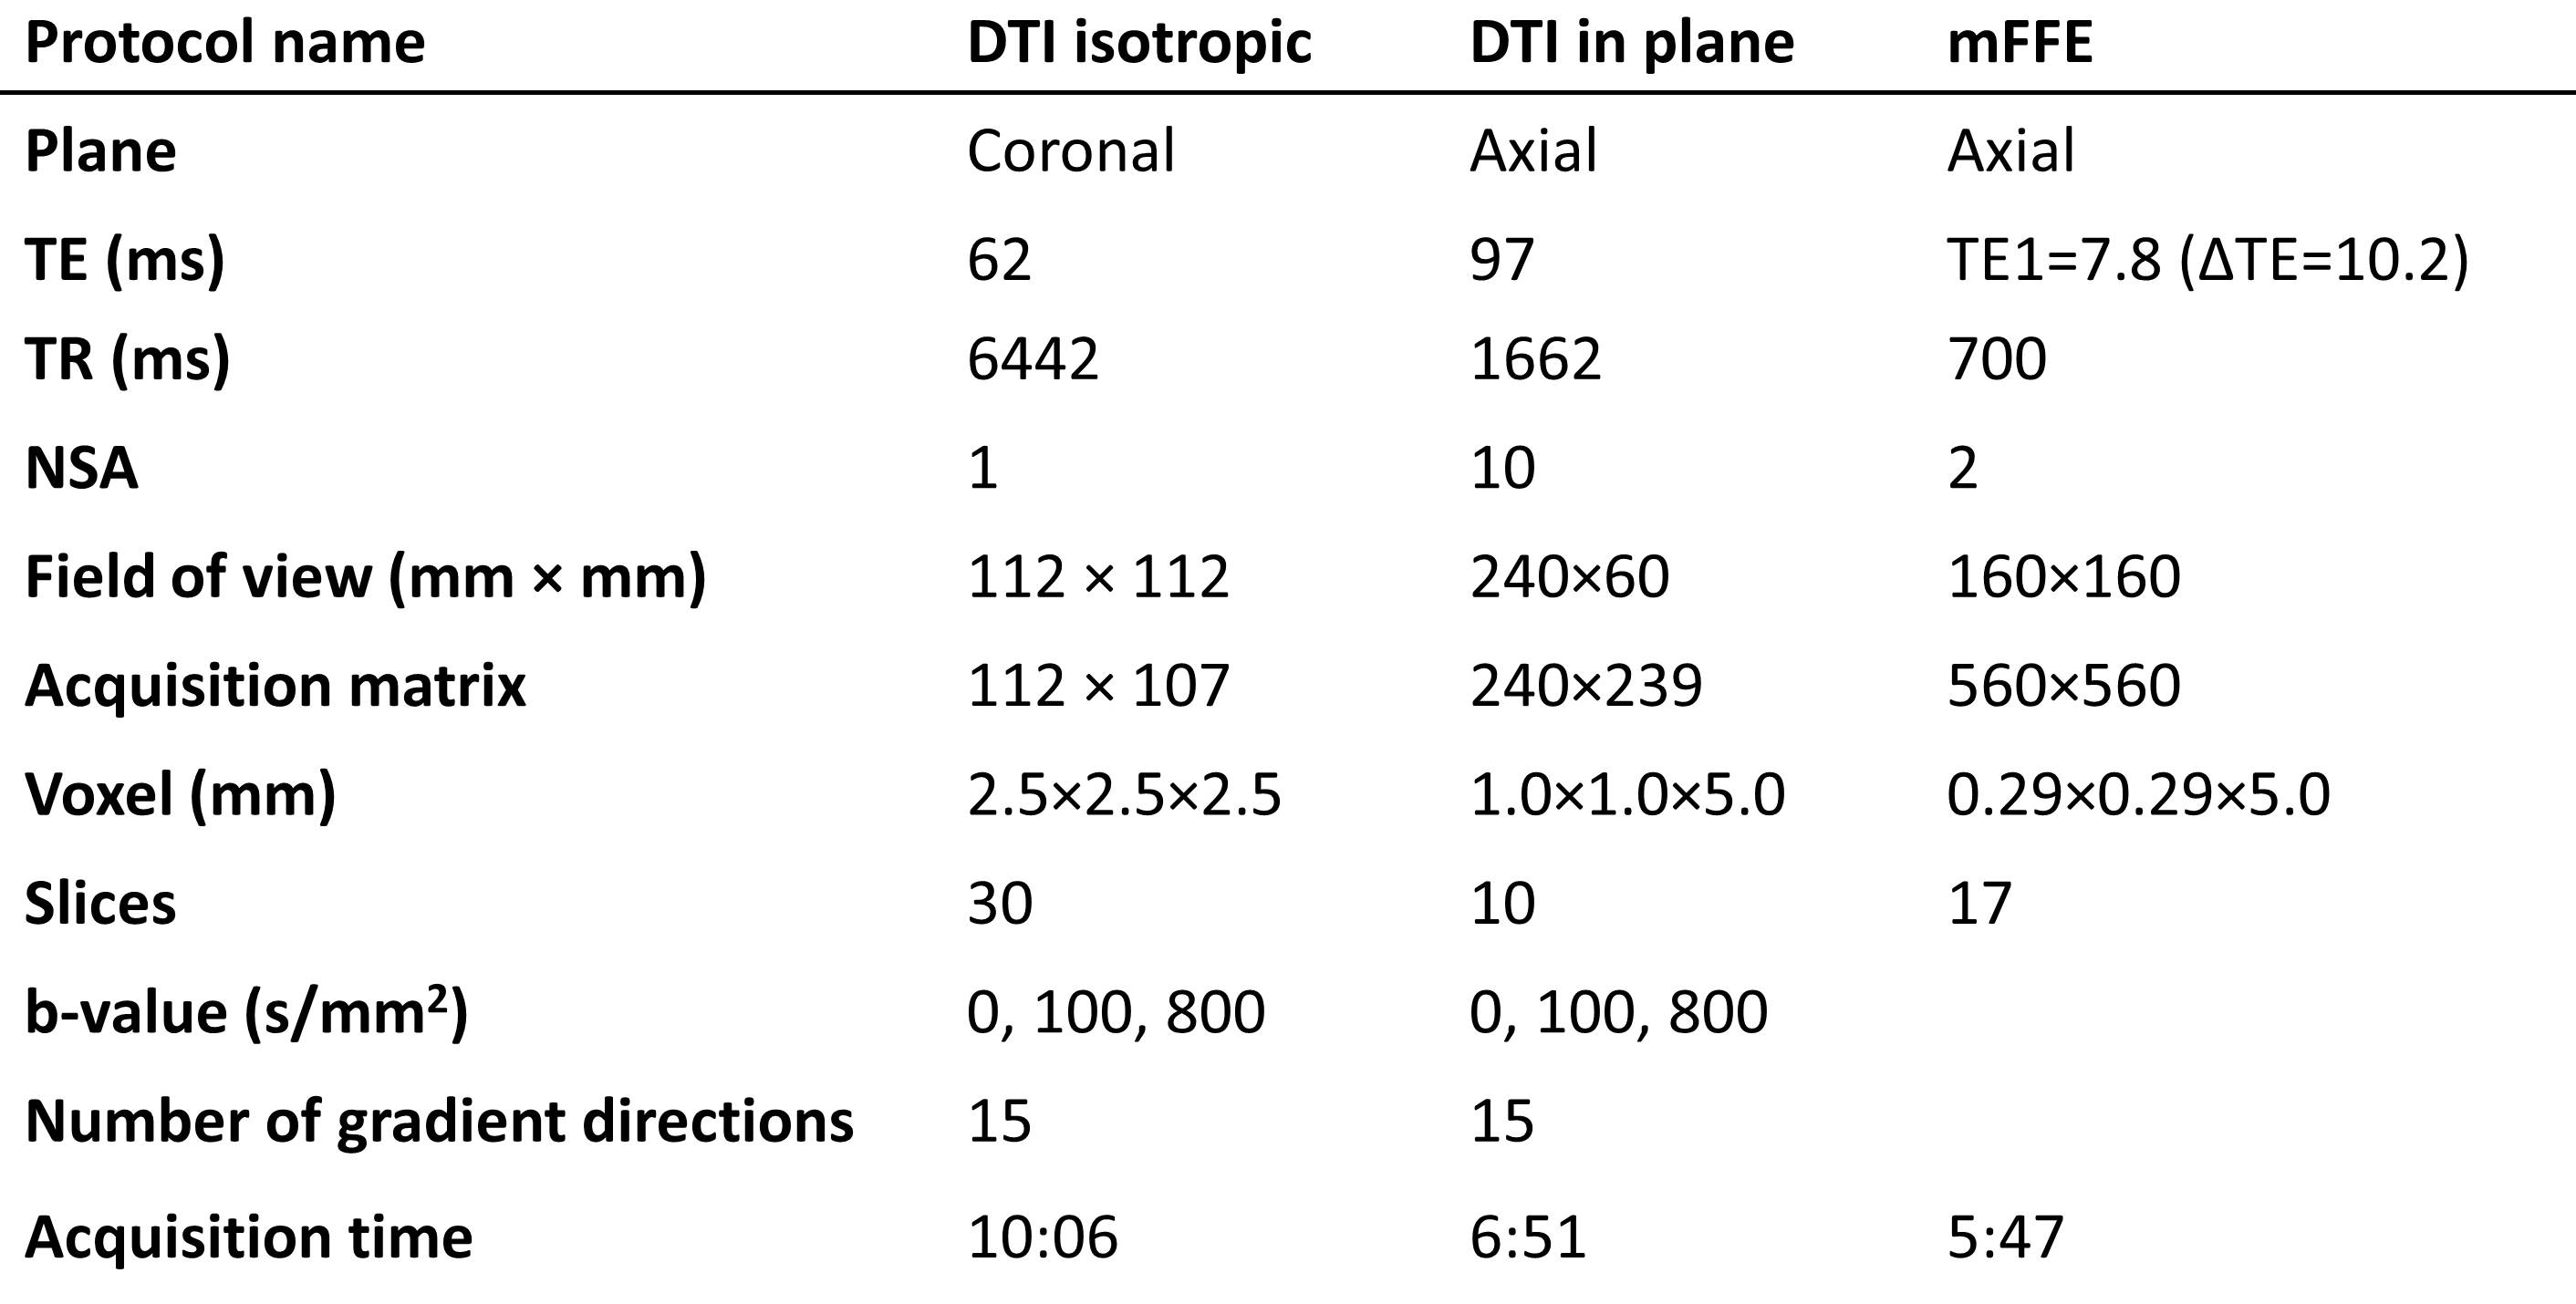
We included 10 SMA patients and 20 age- and gender-matched HC. Subjects were scanned on a 3 Tesla MR system (Ingenia, Philips Healthcare, Best, The Netherlands) using a neurovascular 16-channel surface coil. Two different areas in the cervical spine were evaluated: 1) the spinal cord (C5-C7) with a “high in-plane” resolution DTI protocol and a multi-echo fast field echo (mFFE) sequence, and 2) the peripheral nerves (C3-C8) with an “isotropic” DTI protocol together with a TSE sequence (Table 1). DTI scans were obtained using b= 100 and 800 to decrease the influence of cerebral spinal fluid. Clinical characteristics were collected using the Medical Research Council (MRC) scale for muscle strength7. Both DTI acquisitions were processed identically using ExploreDTI8 and consisted of the following steps. First the b=100 images were registered, then the b=800 images were registered to the mean of the registered b=100. Next, tensors were fitted with the iteratively weighted linear regression procedure9. Whole volume FT was used with a fractional anisotropy (FA) threshold of 0.10-1, minimum fiber length of 15 mm, and an angle of 30° for both protocols. Estimates for the FA, mean (MD), axial (AD), and radial (RD) diffusivity were computed of the grey, white, and whole myelum (“high in-plane” protocol), and segments of 3 cm of C3-C8 (“isotropic” protocol). From the high in-plane spinal cord images the grey, white and whole myelum were manually segmented.Results
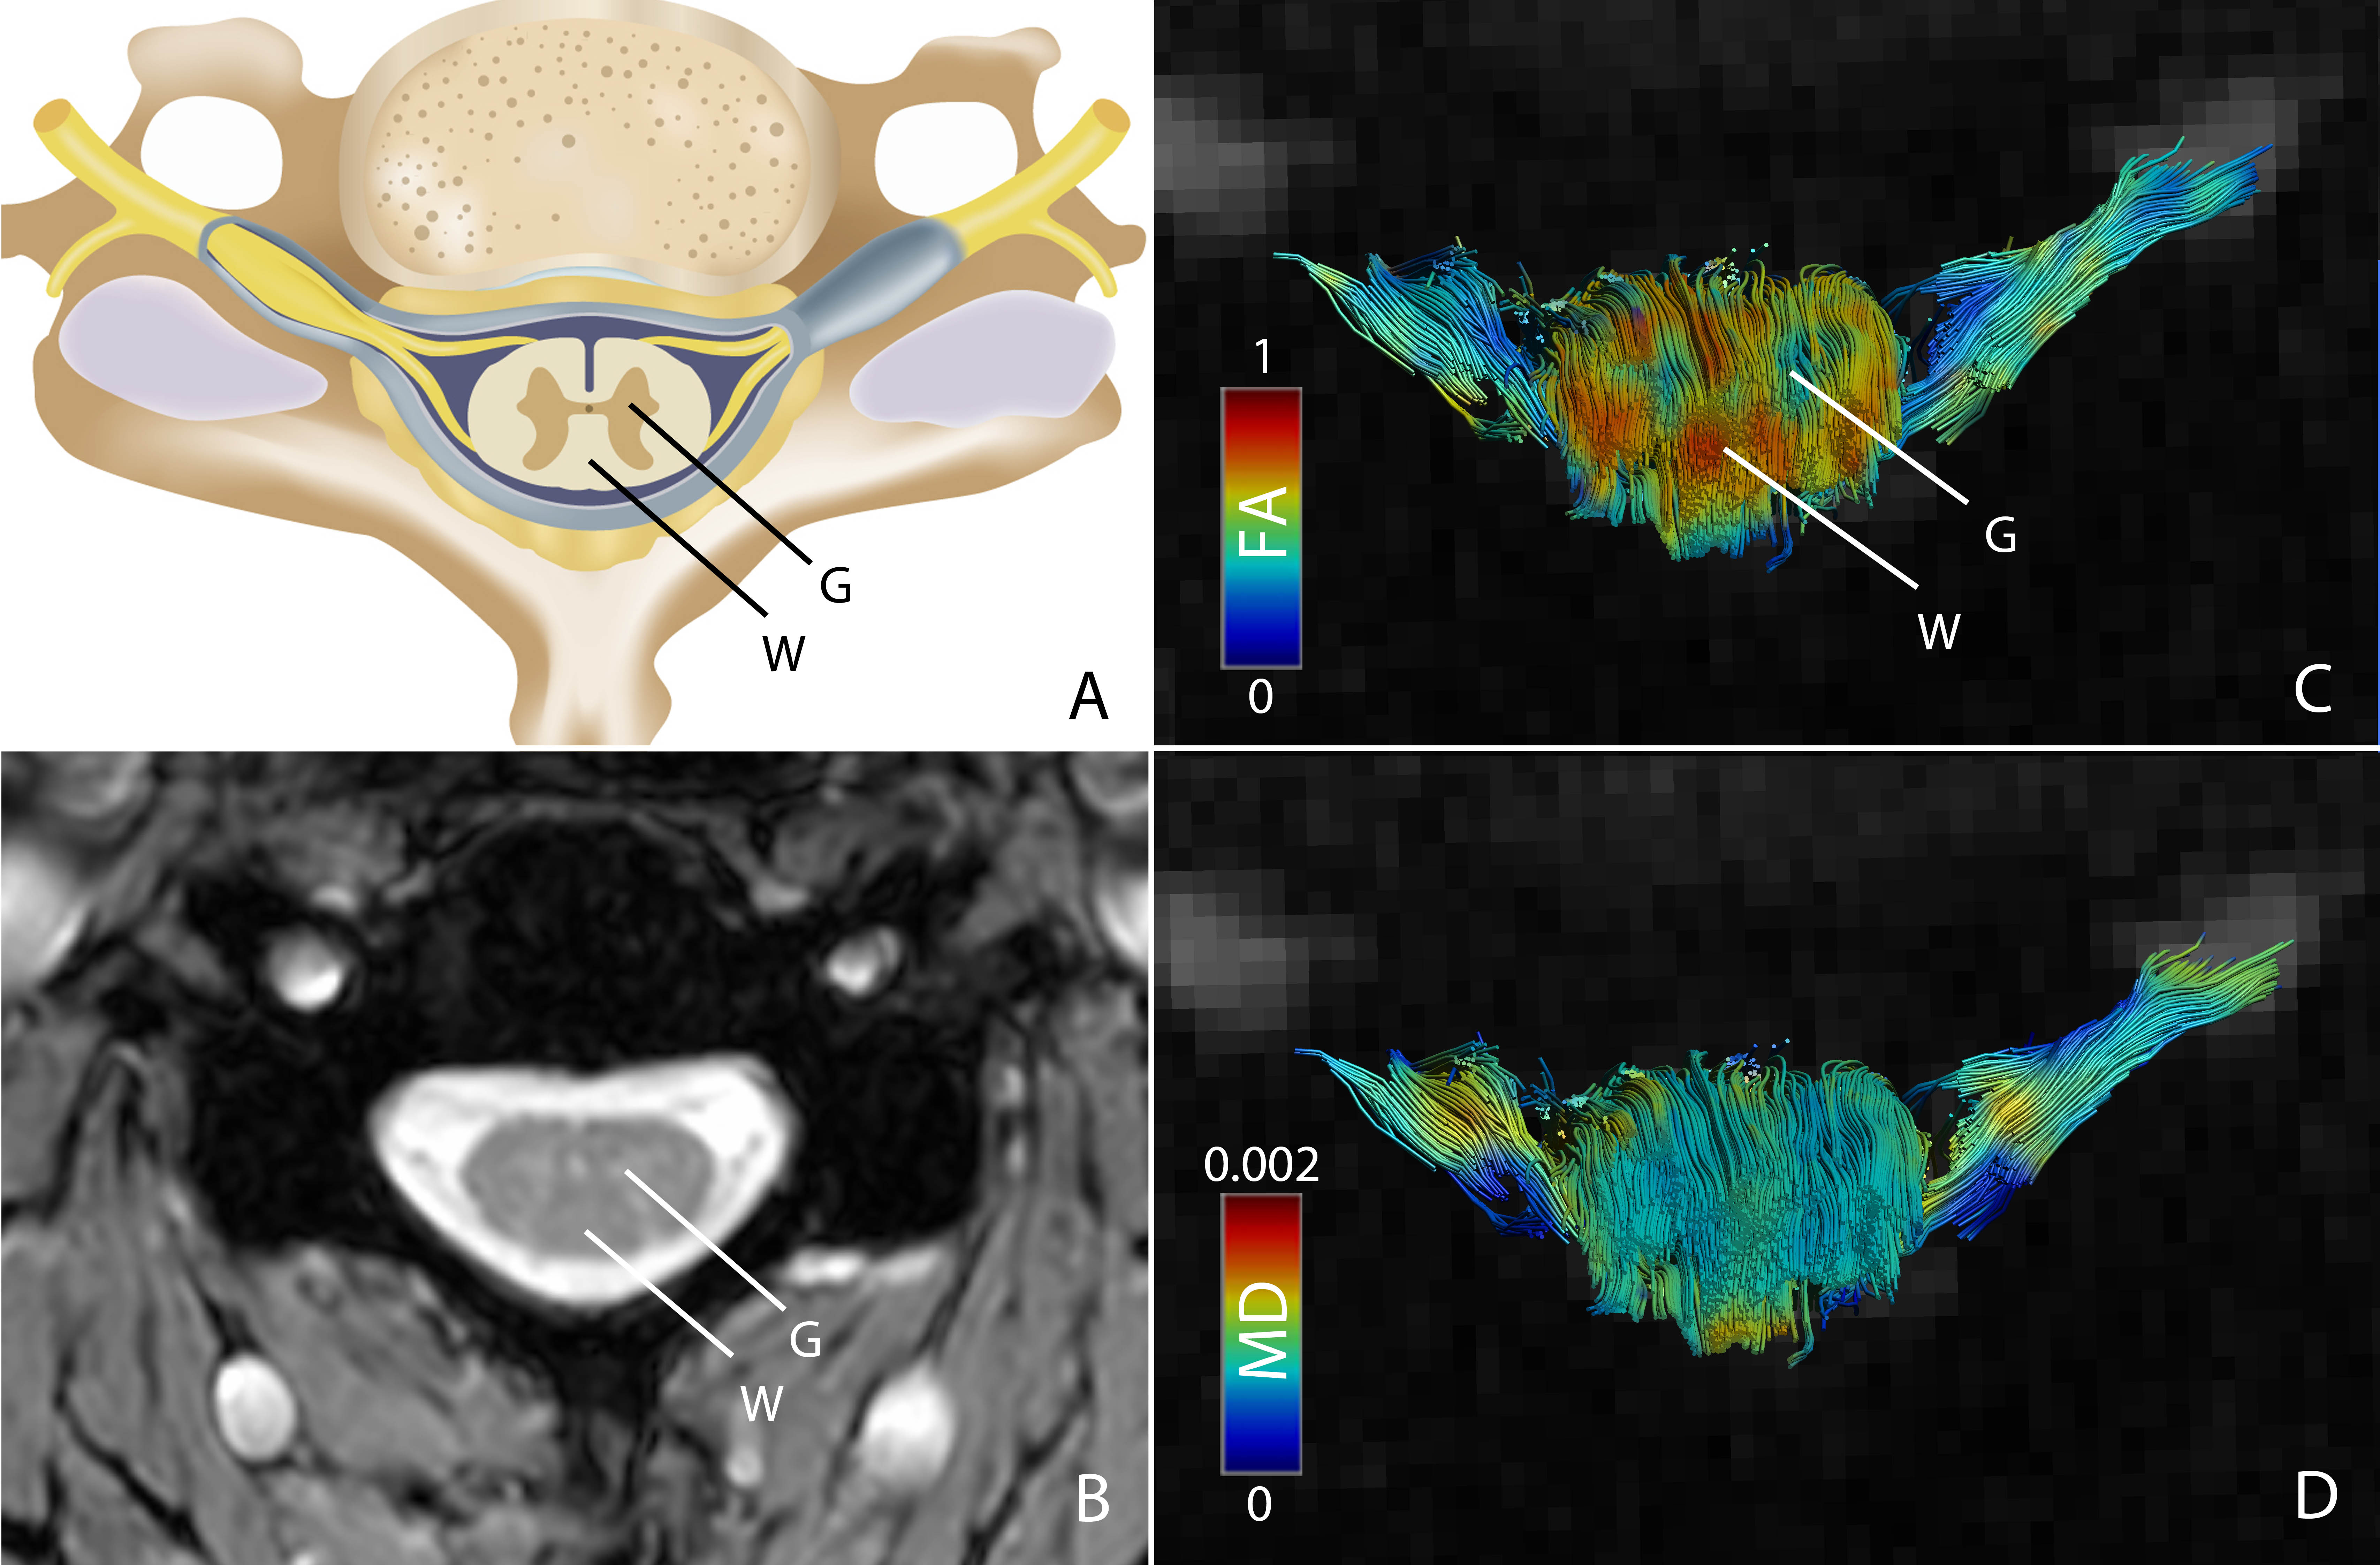
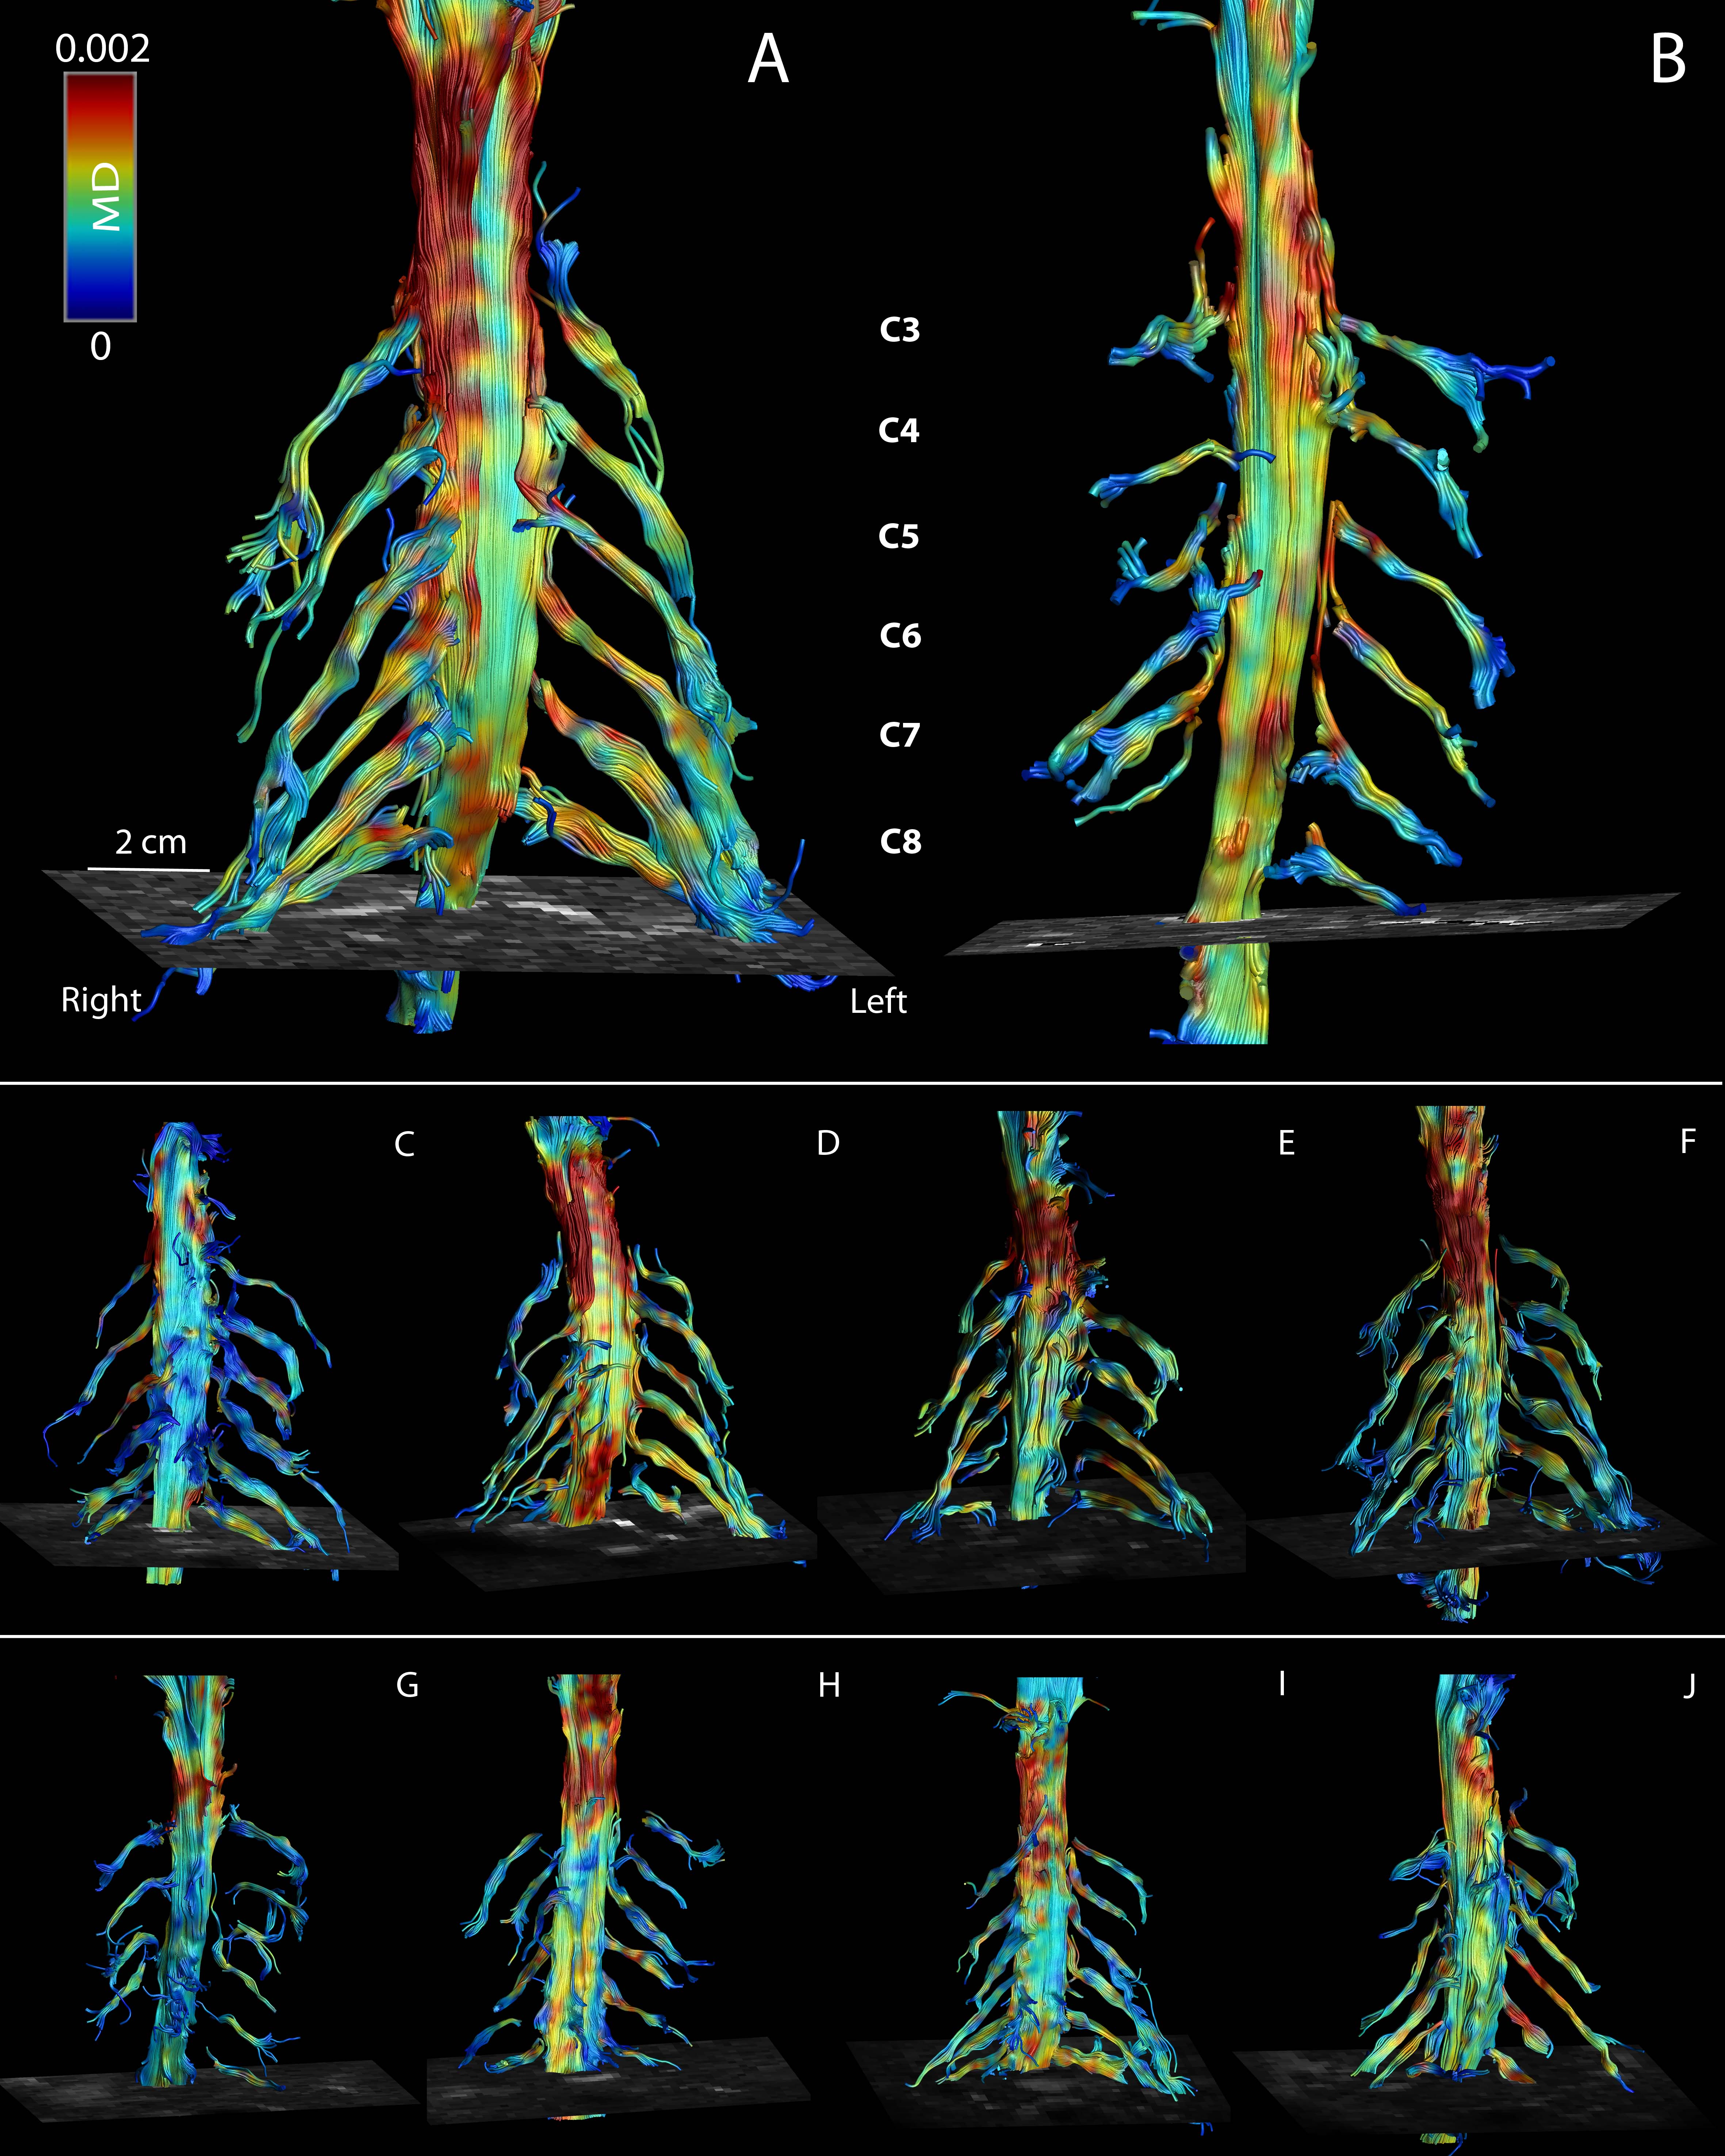
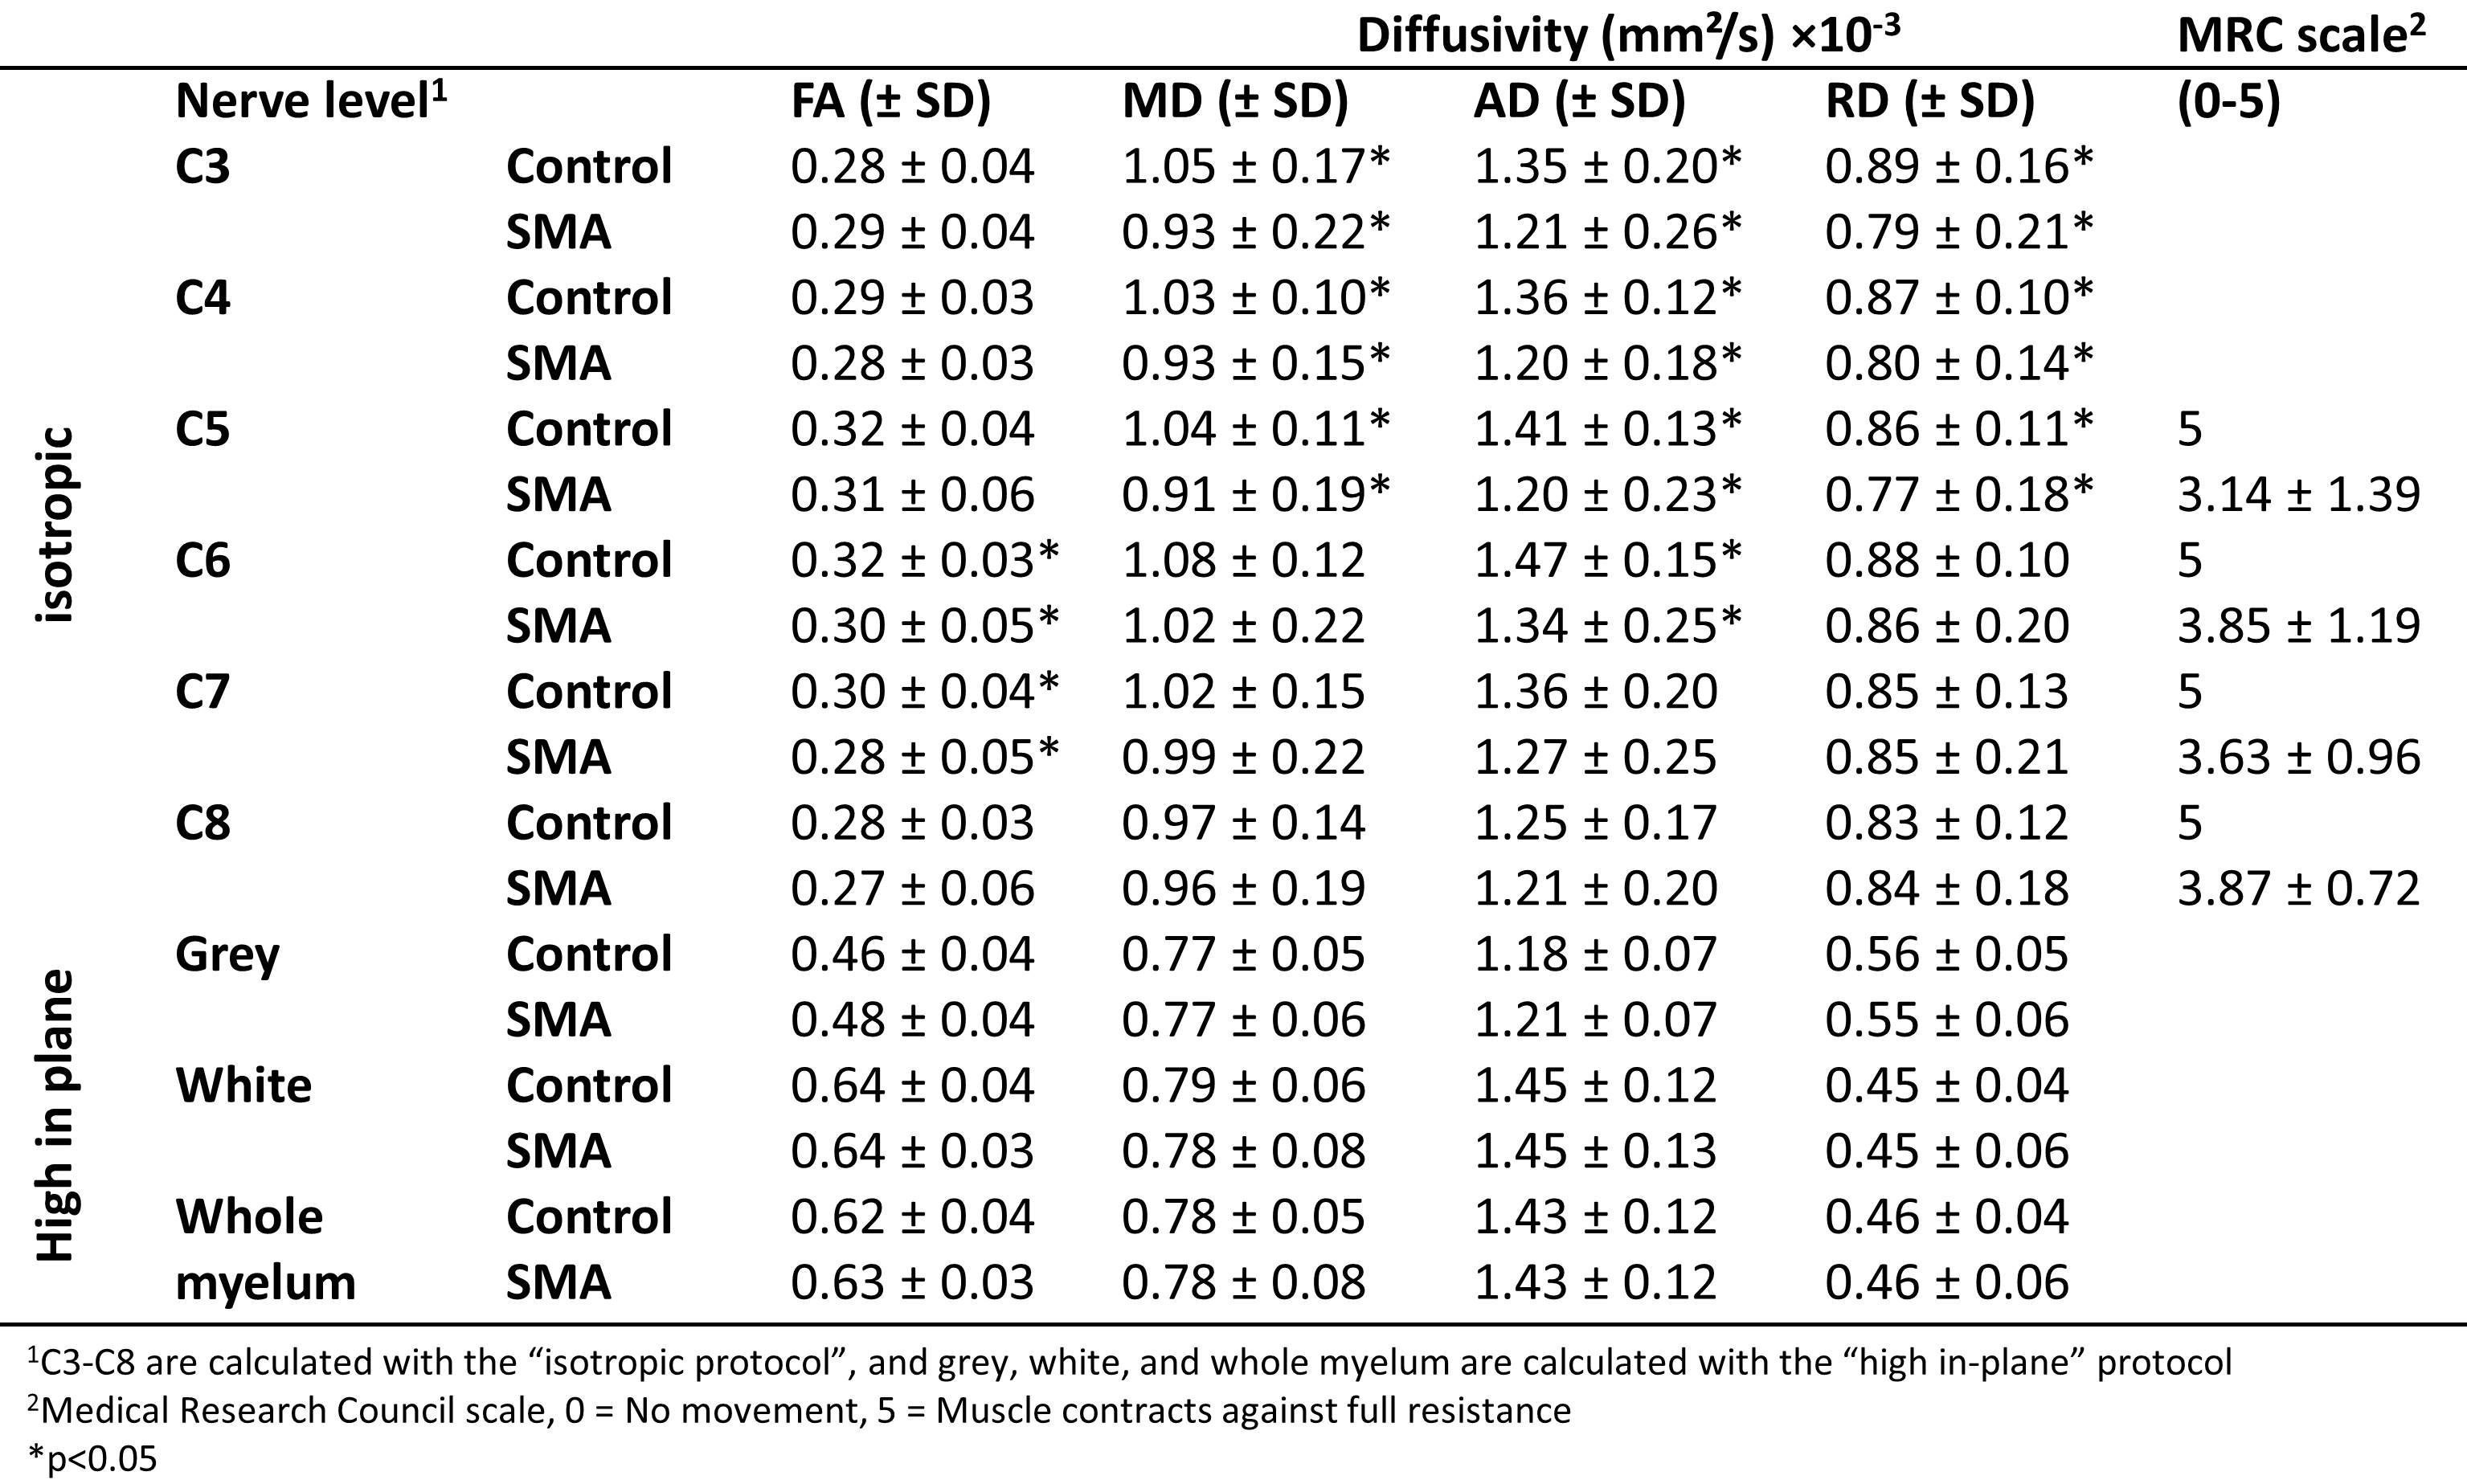
The MRC scale showed lower scores in the proximal muscles (C5) than in the distal muscles (C6-C8). 1) “high in-plane”: In all datasets it was possible to segment the cervical spine. There were no differences in any of the DTI parameters in the grey and white matter between SMA and HC. Figure 1A and 1B show an anatomical overview of the myelum and the mFFE map of the spinal cord in a HC. We identified a low FA value in the grey matter and high FA value in the white matter (Fig. 1C). 2) “isotropic”: At the level of C3-C8 356 out of 360 peripheral nerve segments could be reconstructed. In total 3 nerves in SMA patients and 1 nerve in a HC could not be reconstructed. Table 2 shows that the MD, AD, and RD of the nerve segments of C3-C5 of SMA patients were lower than those of HC. Visually, the architecture of the peripheral nerves of SMA patients was asymmetric in comparison to HC (Fig. 2).Discussion
The observed differences in diffusion values of the nerves of C5 between SMA patients and HC are in accordance with the clinical symptoms (muscle weakness and atrophy) of these patients. Nerves higher up in the cervical spine (C3-C5) are innervating proximal muscles which are most affected in SMA patients thus resulting in lower function (MRC score). The lower MD, AD, and RD values in SMA patients could be related to cytoskeletal breakdown resulting in increased viscosity10,11. However, partial volume effects may occur due to, potentially, smaller nerves in SMA patients which can influence the results. The FT results of the peripheral nerves showed more asymmetry in SMA patients compared to HC using the same FT settings. We did not find differences in diffusion values of the grey and white matter between SMA patients and HC in the spinal cord.Conclusion
Peripheral nerves as well as the spinal cord can be reconstructed with DTI and FT in SMA patients and HC. We did not find differences in grey and white matter diffusion between SMA and HC. We showed differences in peripheral nerves at the level of C3-C5, which are for C5 in accordance with the clinical symptoms of these patients.Acknowledgements
We would like to thank Tuan Nguyen, Ellart Aalbers, and Lidy Kuster for their help in acquiring the images.References
1. Lunn MR, Wang CH. Spinal muscular atrophy. Lancet 2008;371:2120–33
2. D’Errico P, Boido M, Piras A, et al. Selective vulnerability of spinal and cortical motor neuron subpopulations in delta7 SMA mice. PLoS One 2013;8.
3. Harding BN, Kariya S, Monani UR, et al. Spectrum of neuropathophysiology in spinal muscular atrophy type I. J. Neuropathol. Exp. Neurol. 2015;74:15–24.
4. Vargas MI, Viallon M, Nguyen D, et al. Diffusion tensor imaging (DTI) and tractography of the brachial plexus: feasibility and initial experience in neoplastic conditions. Neuroradiology 2010;52:237–245.
5. Tagliafico A, Calabrese M, Puntoni M, et al. Brachial plexus MR imaging: accuracy and reproducibility of DTI-derived measurements and fibre tractography at 3.0-T. Eur. Radiol. 2011;21:1764–1771.
6. Haakma W, Kuster L., Froeling M, et al. Post-mortem diffusion MRI of cervical spine and nerves roots. Intl Soc Mag Rerson Med 2016, 926
7. Bove GM. Medical Research Council. Aids to examination of the peripheral nervous system. Memorandum no. 45. London: Her Majesty’s Stationary Office; 1976. J. Bodyw. Mov. Ther. 2008;12:185–90.
8. Leemans A, Jeurissen B, Sijbers J, et al. ExploreDTI: a graphical toolbox for processing, analyzing, and visualizing diffusion MR data. Proc Intl Soc Mag Reson Med. 2009;17:3536.
9. Veraart J, Sijbers J, Sunaert S, et al. Weighted linear least squares estimation of diffusion MRI parameters: Strengths, limitations, and pitfalls. Neuroimage 2013;81:335–346.
10. Haakma W, Dik P, Ten Haken B, et al. Diffusion tensor MRI and fiber tractography of the sacral plexus in children with spina bifida. J. Urol. 2014;192:927–933.
11. Beaulieu C. The basis of anisotropic water diffusion in the nervous system - a technical review. NMR Biomed. 2002;15:435–55.
12. © 2004 Benjamin Cummings
Figures