1755
Comparison of between-subject and single-subject between-session variability in in vivo DKI brain studies1Forschungszentrum Jülich GmbH, Institute of Neuroscience and Medicine - 4, Juelich, Germany, 2JARA, RWTH Aachen University, Department of Neurology, Faculty of Medicine, Aachen, Germany, 3Georgian Technical University, Department of Physics, Tbilisi, Georgia
Synopsis
The knowledge of
Purpose
Diffusion kurtosis imaging (DKI) gives valuable information about microstructural changes in brain for both white and grey matter structures. DKI has the potential to replace diffusion tensor imaging (DTI) in clinical routine tests as it overcomes the well-known limitations of DTI related to the underlying Gaussian model of diffusion. However, in order for DKI to become a routine procedure, between-subject variability of DKI metrics, as well as their reproducibility in between-session and between scanner measurements should be well studied. In particular, studying variability in in vivo brains will facilitate more reliable interpretation of clinical data. However, to date, the variability of DKI parameters has been insufficiently studied [1, 2]. In particular, in Refs. [1, 2], variability was investigated for two DKI parameters, mean kurtosis (MK) and radial kurtosis (RK), in three major white matter structures only, such as superior cingulum bundle (CG), medial motor corticospinal tract (CST), and mid-sagittal corpus callosum (CC). The aim of this work was to compare the between-subject and single-subject between-session variability of major DTI/DKI parameters in in vivo brain studies, and to draw inferences about their dependence on various anatomical regions-of-interest.Materials and methods
Data acquisition of N=14 healthy subjects of the in vivo brain was performed with a 3T Siemens MAGENETOM Tim Trio scanner using the following protocol: b-values, b = 0, 700, 1000, 2500 s/mm2; 150 diffusion gradient directions; TE/TR=109ms/9000ms; number of slices = 60; voxel size = 2x2x2 mm3. For between-session variability study, measurements were additionally repeated in 10 different sessions for 3 subjects with an interval of 3 days between measurements during a 3-month period. Eddy current distortions as well as motion effects were corrected in the EPI datasets using the tool “EDDY” available in FSL [3]. The corresponding rotation matrix was applied to the diffusion gradient directions [5]. Bias due to background noise was corrected using the power-images method [4]. Gibbs ringing artefacts were corrected using the Total Variation method [5] available in the ExploreDTI toolbox [6]. Finally, DKI parameters were evaluated using a weighted-linear least-squares approach available in the ExploreDTI toolbox. The diagonal elements of the kurtosis tensor were constrained to be positive. Variability was quantified using the coefficient of variation (CoV) that represents the relative standard deviation, i.e., the ratio of the standard deviation to the mean. CoV was estimated based on 10 session measurements for the total of 20 white matter tracts provided by the John-Hopkins-University (JHU) atlas available in FSL using a co-registration of the individual FA maps to the FA template in the JHU space [7]. Afterwards, the saved transformation matrix was applied to the non-FA images. In total, we investigated 10 major fibres, such as the anterior thalamic radiation (ATR) and corticospinal tract (CST), cingulum (gyrus) (Cg) and cingulum (hippocampus) (Ch), superior longitudinal fasciculus (SLF), SLF (temp), inferior longitudinal fasciculus (ILF), inferior fronto-occipital fasciculus (IFOF), uncinate fasciculus (UF), the left and right regions of 2 projection fibres, and 2 commissural fibres, forceps major (F_major) (splenium of corpus callosum) and forceps minor (F_minor) (genu of corpus callosum).Results and discussions
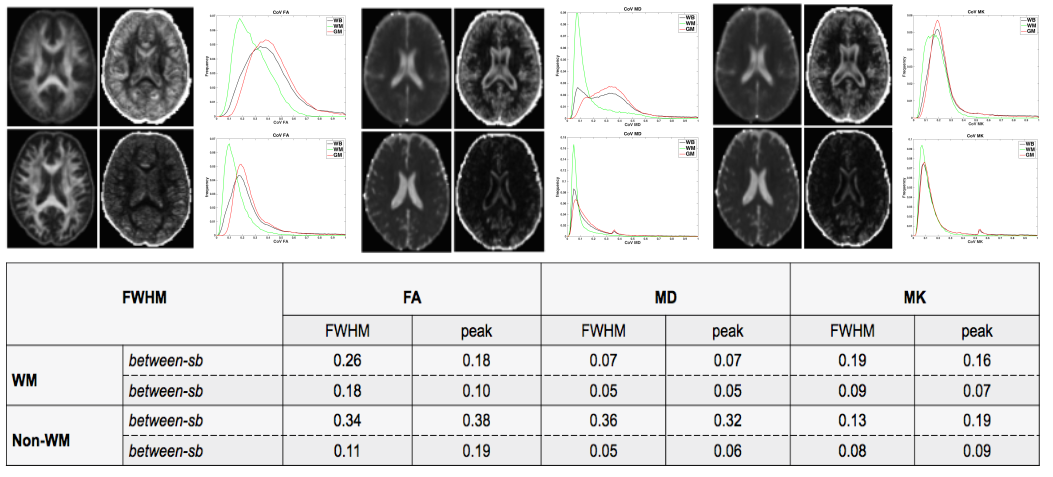
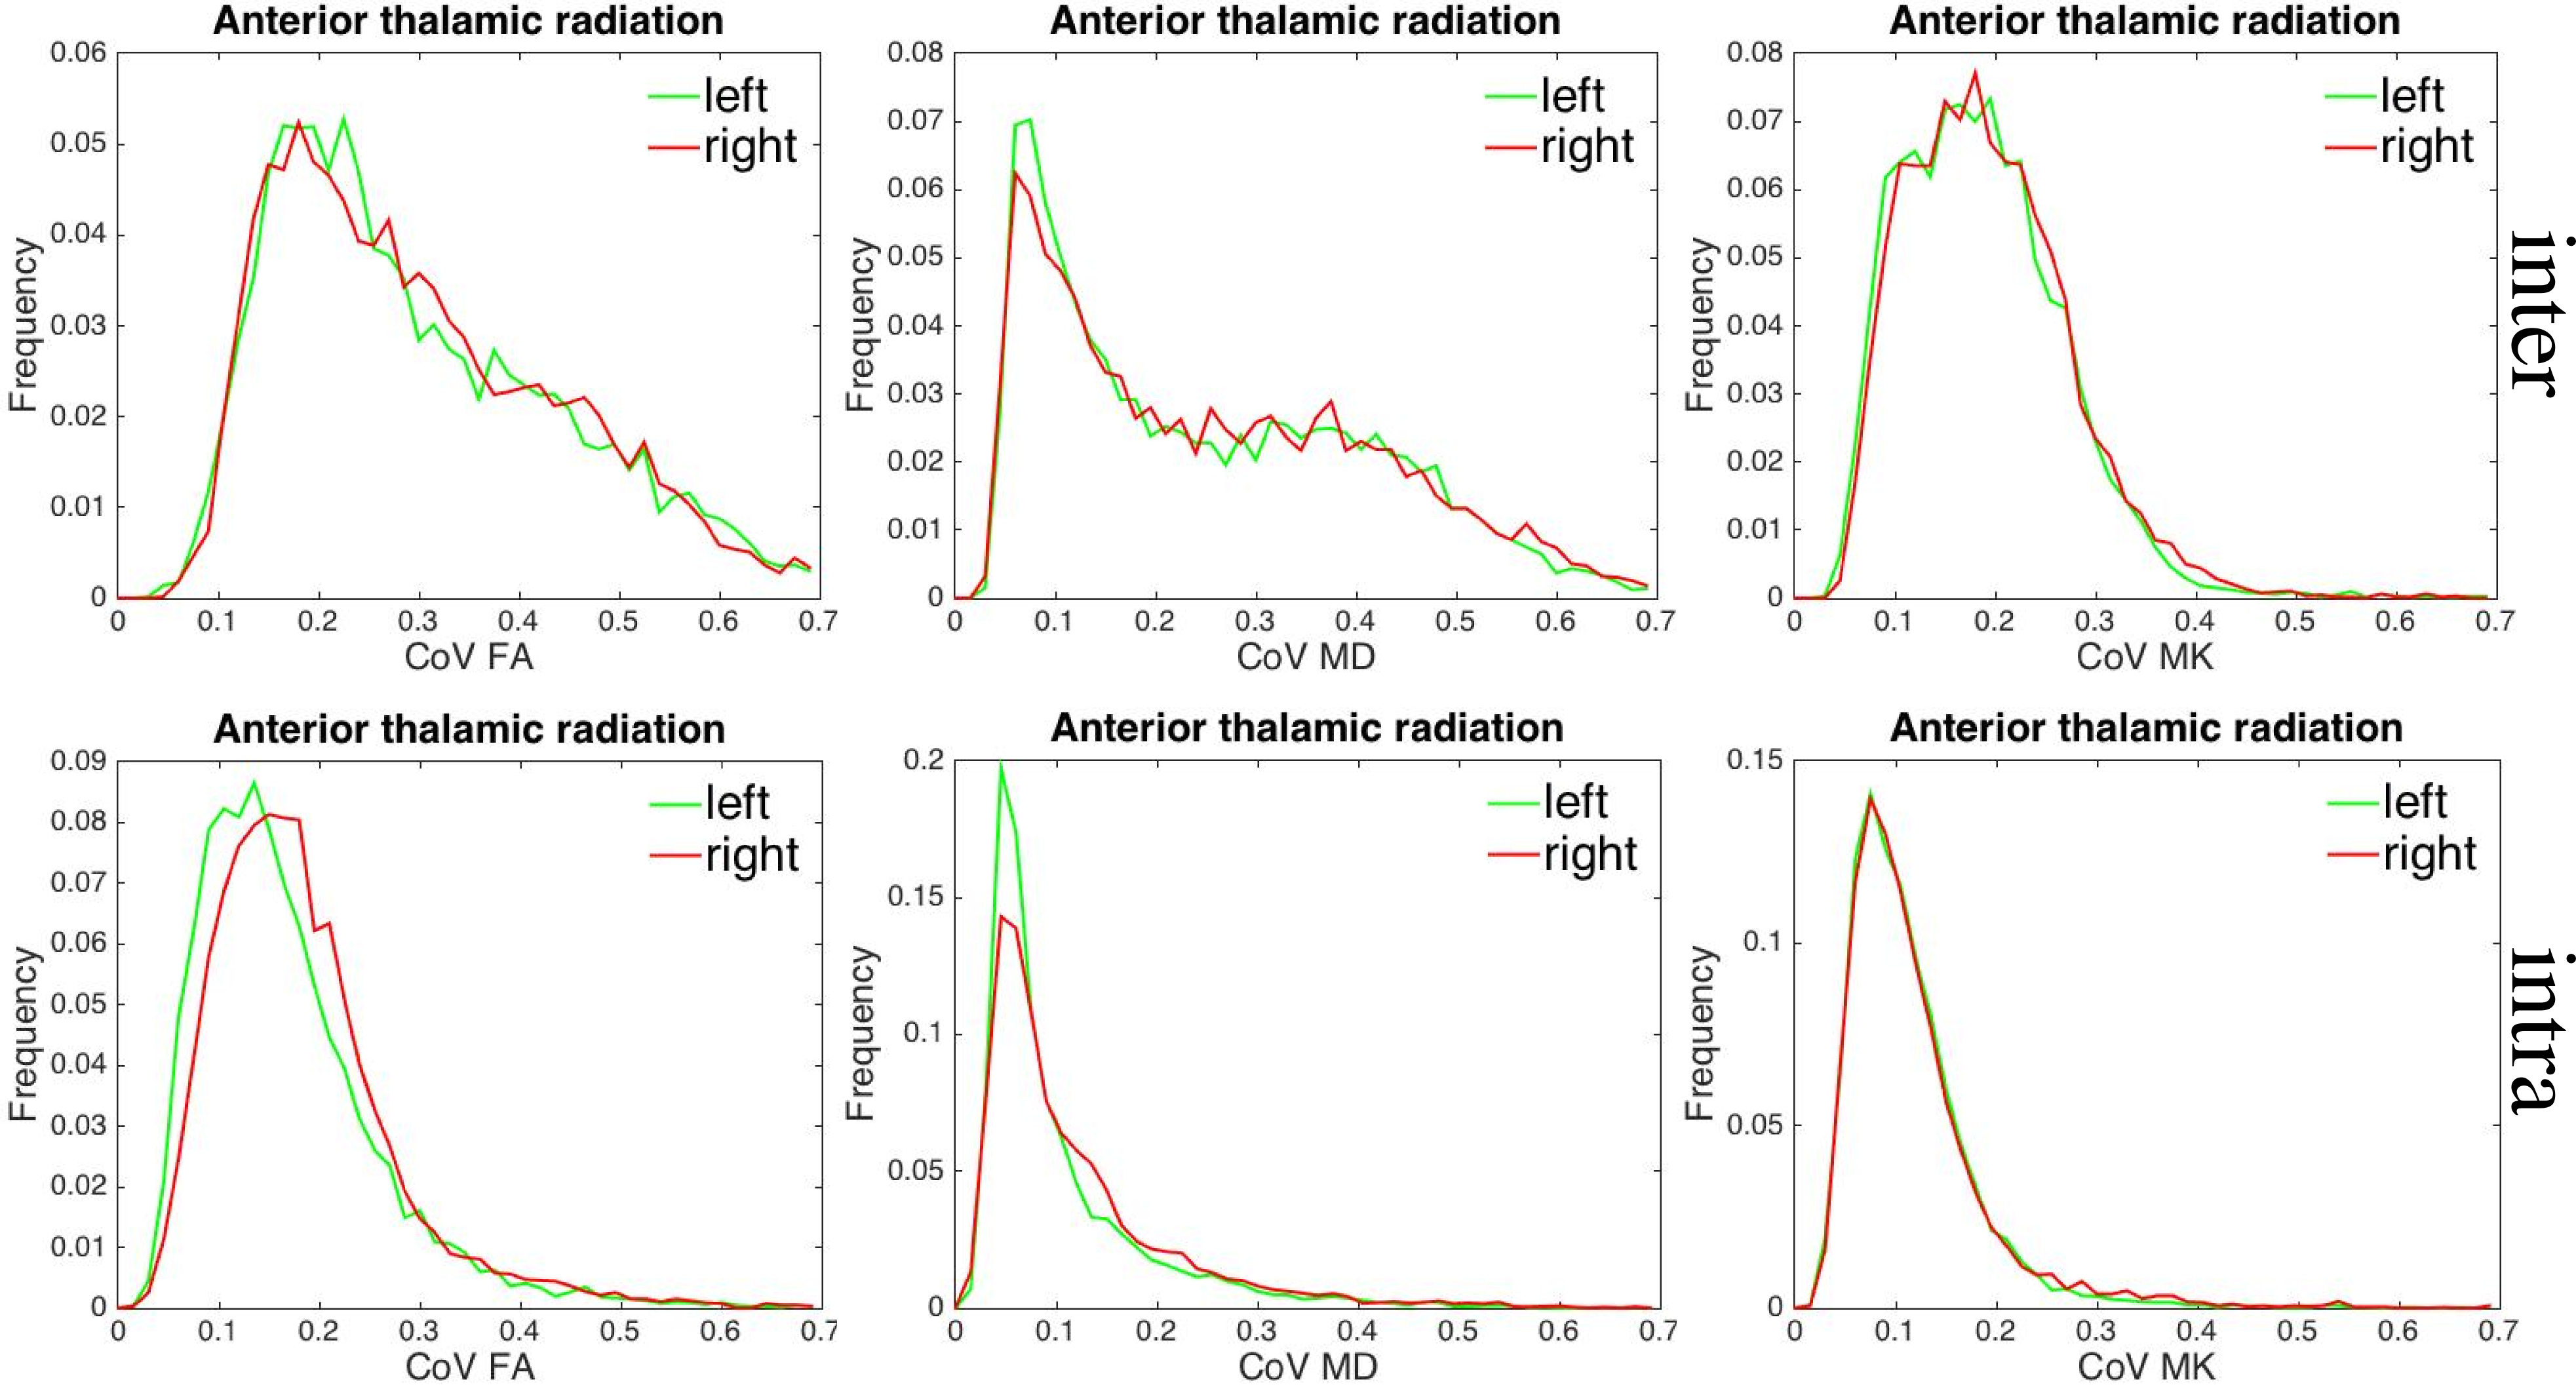
Figures 1 shows mean parameter maps (the means in between- and intra-subject experiments), the corresponding CoV maps, and CoV histograms for FA, MD, and MK in one selected slice. The histograms are shown separately for white matter and non-white matter tissues using the condition FA > 0.2 for WM and ≤ 0.2 for non-WM. The Table shown in Figure 1 quantifies the full-width-at-half-maximum (FWHM) of the related histograms. Clearly, the CoV in intra-subject variability is much narrower than in between-subject variability. It should be noted that the CV maps for FA provided a larger contrast between WM and non-WM tissues (low values in WM, high - in non-WM) in comparison to the CV of MK. The reason is due to a higher uncertainty of FA estimations in non-WM voxels. Figure 2 shows CoV histograms for FA, MD, and MK for one representative fibre, ATR. Again, we see that the histograms are much broader for between-subject variability. We shall discuss our findings in the context of various reasons contributing to DTI/DKI parameter variability, in particular, those that are general for the method, and those that are specific for in vivo brain.Conclusion
We demonstrate that all DTI/DKI parameters show heterogeneous between-subject and single-subject between-session variability depending on the anatomical region. Our results provide the baseline for variability analysis expected to be useful in interpretation of the clinical multi- and single-subject longitudinal studies.Acknowledgements
No acknowledgement found.References
[1] F. Szczepankiewicz “Variability in diffusion kurtosis imaging: Impact on study design, statistical power and interpretation” NeuroImage, 2013; 76: 145-154
[2] A.D. Elodie “Influence of Noise Correction on Intra- and Inter-Subject Variability of Quantitative Metrics in Diffusion Kurtosis Imaging” Plos one; 2014; 9: e94531
[3] M.W. Woolrich et al., “Bayesian analysis of neuroimaging data in FSL”. NeuroImage, 2009; 45:173-86
[4] A.J. Miller, P.M. Joseph “The use of power images to perform quantitative analysis on low SNR MR images”, Magn. Reson. Imaging 1993; 11: 1051-1056
[5] A.Leemans et al., “The B-Matrix Must Be Rotated When Correcting for Subject Motion in DTI Data” Magnetic Resonance in Medicine 2009; 61:1336–1349
[6] A.Leemans et al.,” ExploreDTI: a graphical toolbox for processing, analyzing, and visualizing diffusion MR data” the 7th Annual Meeting of Intl Soc Mag Reson Med, 2009; 3537
[7] S.Mori et al., “Stereotaxic White Matter Atlas Based on Diffusion Tensor Imaging in an ICBM Template” Neuroimage”. 2008; 40: 570–582.
Figures