1754
Cerebellar connectivity influences brain network topology1Department of Physics, University of Pavia, Pavia, Italy, 2Brain Connectivity Center, C. Mondino National Neurological Institute, Pavia, Italy, 3Department of Physics, University of Milan, Milan, Italy, 4Department of Brain and Behavioral Sciences, University of Pavia, Pavia, Italy, 5Department of Electrical, Computer and Biomedical Engineering, University of Pavia, Pavia, Italy, 6Brain MRI 3T Mondino Research Center, C. Mondino National Neurological Institute, Pavia, Italy, 7Neuroradiology Unit, C. Mondino National Neurological Institute, Pavia, Italy, 8Queen Square MS Centre, Department of Neuroinflammation, UCL Institute of Neurology, London, United Kingdom
Synopsis
Graph theory based approaches applied to diffusion weighted MRI data have been used for understanding cerebral processing at whole-brain scale. Nevertheless, a few studies have considered including the connectivity with the cerebellum. In this work, the cerebellar role in the whole-brain connectomic was investigated by combining automatic tools and a priori information about cerebellar connections. We assert that it is important to incorporate the knowledge that cerebro-cerebellar connections are all contralateral. Moreover, our findings demonstrate that network topology is highly influenced by the presence or the absence of the cerebellum suggesting that it plays a key role in brain processing.
Purpose
Recent studies have moved towards the understanding of cerebral processing at whole brain scale, both in healthy subjects and in neurological patients, providing unique information about structural and functional substrates1-3. Graph theory based approaches applied to diffusion weighted MRI data have been used to provide further insights into the brain connectomic, but only a few studies have considered including the connectivity with the cerebellum2,3. In this work, the cerebellar role in the whole brain connectomic was investigated by creating whole-brain networks using automatic tools and a priori information4. Indeed, it is important to incorporate the knowledge that cerebro-cerebellar loop comprises connections between each cerebellar hemisphere and the contralateral cerebral cortex.Methods
Subjects: The study was carried out on 42 healthy adults (14 males; age (32.1 ± 8.7) years and range 20–49 years).
MRI acquisition: Data were acquired using a 3T Skyra scanner (Siemens, Erlangen, Germany) with a 32-channel head-coil. Diffusion data were acquired using a twice-refocused SE-EPI sequence (TR/TE=14500/103ms, 70 axial slices, FOV=240mm, 2mm isotropic voxel, 64 non-collinear diffusion directions, b=2500s/mm2 and 10 volumes with b=0s/mm2). 3DT1w images were collected with a MPRAGE sequence (TR/TE/TI=2300/2.95/900ms, 176 sagittal slices, FOV=270mm, 1.2x1.1×1.1mm3 voxel, flip angle=9°).
Preprocessing: Diffusion data were corrected for susceptibility distortions, eddy currents, and inter-volume motions combining BrainSuite5 and FSL EDDY6 tools. Brain extraction of the mean b0 images and creation of fractional anisotropy (FA) and mean diffusivity (MD) maps were performed using FSL. For each subject, the 3DT1 images were aligned to the corresponding b0 images using a full-affine registration. Tissue volume maps of white matter (WM), grey matter (GM), subcortical GM, and cerebrospinal fluid were created with FSL for the Anatomically-Constrained Tractography (ACT) framework7.
Tractography: Whole-brain tractography was performed with MRtrix3 by combining constrained spherical deconvolution and probabilistic streamline tractography (iFOD2)8. Relevant parameters were: step size=1mm, max angle=45° per step, FOD threshold=0.1, 10 million streamlines selected. The WM-GM interface was used for randomly seeding the streamlines within the ACT framework. “Spherical-deconvolution Informed Filtering of Tractograms” (SIFT2)9 method was applied for obtaining a valid marker of axonal fibre count.
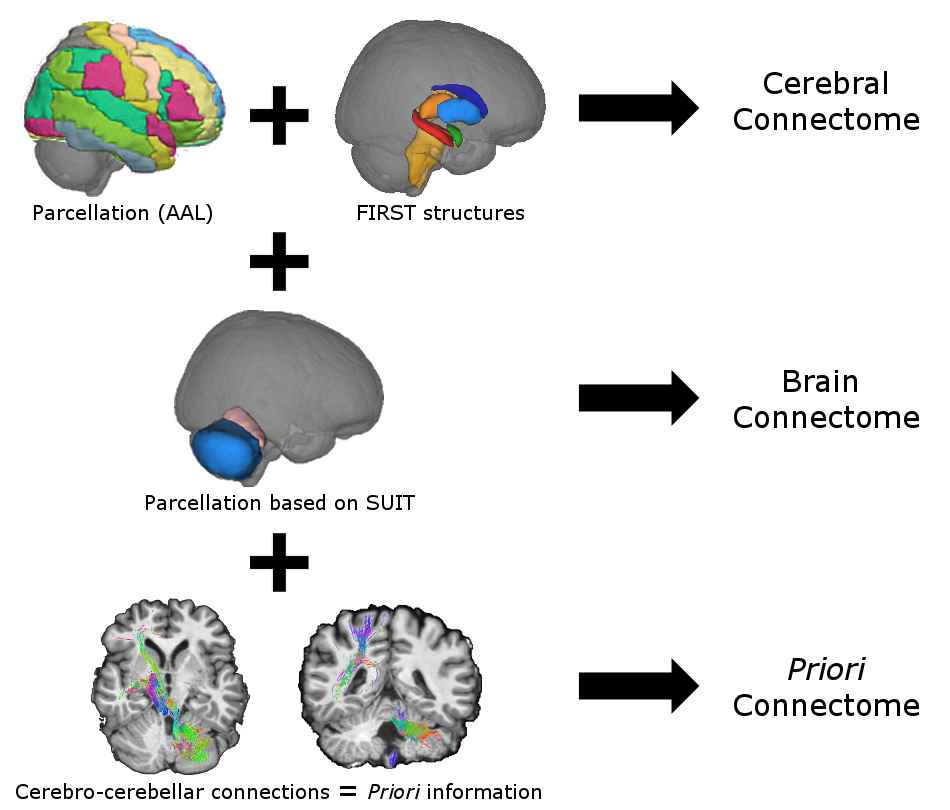
Atlas and connectome construction: An ad-hoc atlas was created in MNI152 space combining deep GM structures, Automated Anatomical Labeling (AAL)10 and SUIT atlases11. The atlas comprising a totality of 97 labels was dilated to overlap GM-WM interface and was transformed to subject-space by inverting the non-affine registration from diffusion to MNI space. Three connectomes, i.e. groups, with different nodes were built: (i) cereb_atlas = cerebral using AAL labels; (ii) brain_atlas = whole-brain using ad-hoc atlas labels without priori information; (iii) a_priori_atlas = as brain_atlas but with a priori information on the cerebro-cerebellar loop contralateral connectivity. Each connectome was created by combining the streamline tractograms (edges) with the different subject's atlases (nodes). For each connectome three edge weightings were defined: (i) streamline count following SIFT2, (ii) mean FA of the tract, (iii) mean MD of the tract.
Structural network analysis: Basic characterization was achieved calculating nodal degree (K), and nodal strength (KW) of each node and deriving small-world index (SW). Network integration and segregation were provided by global efficiency (Eglob) and local efficiency (Eloc), respectively. Centrality and modularity were studied using betweenness centrality (BW) and participation coefficient (PW), respectively. These measurements, depending on their distribution, were compared among groups using ANOVA test (p ≤ 0.05, with Bonferroni) or Mann-Whitney U test.
Results
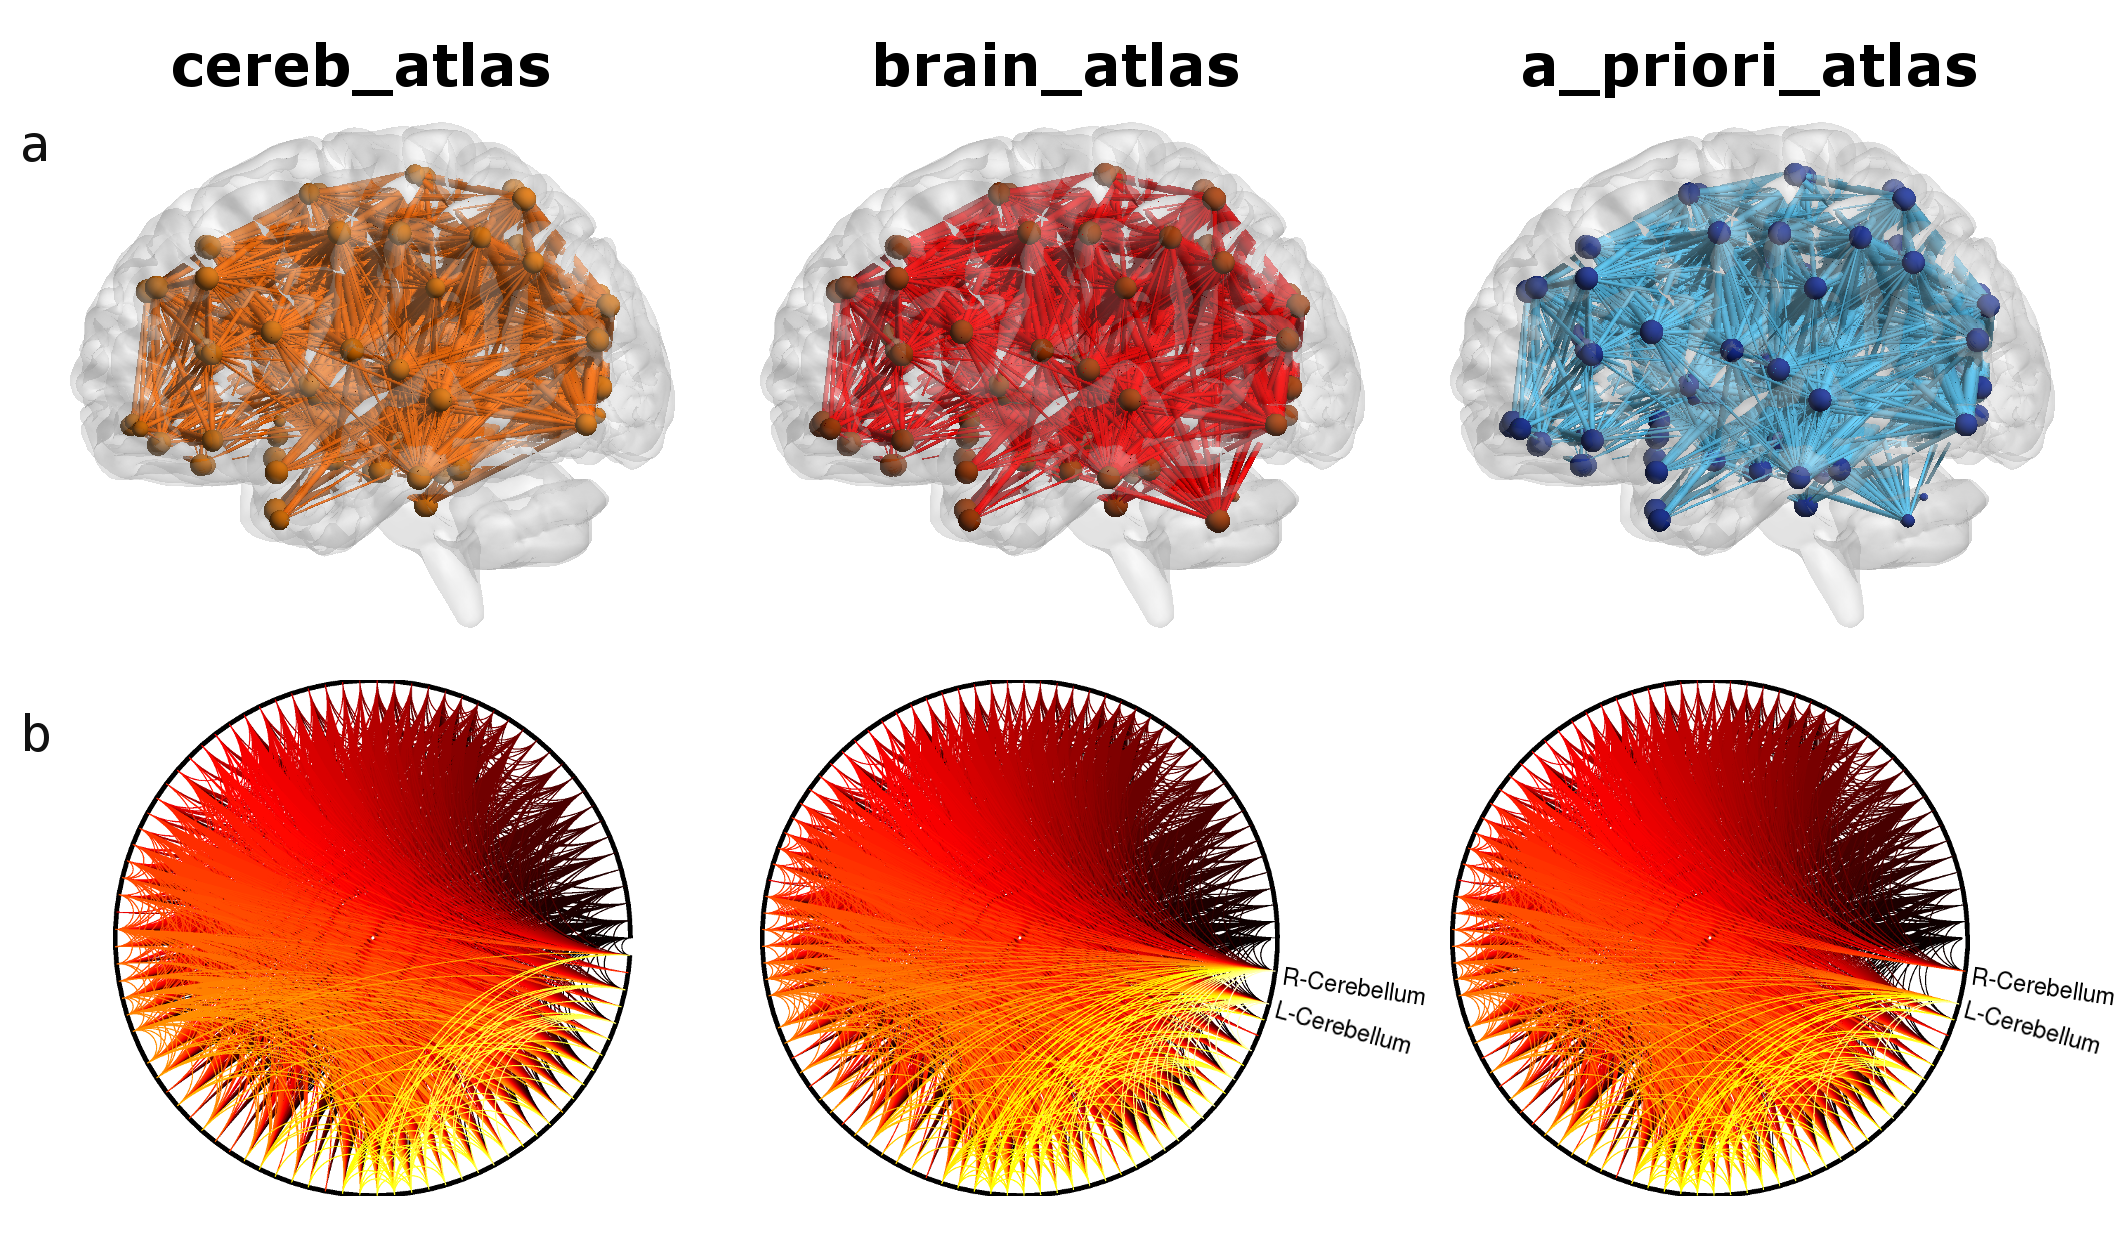
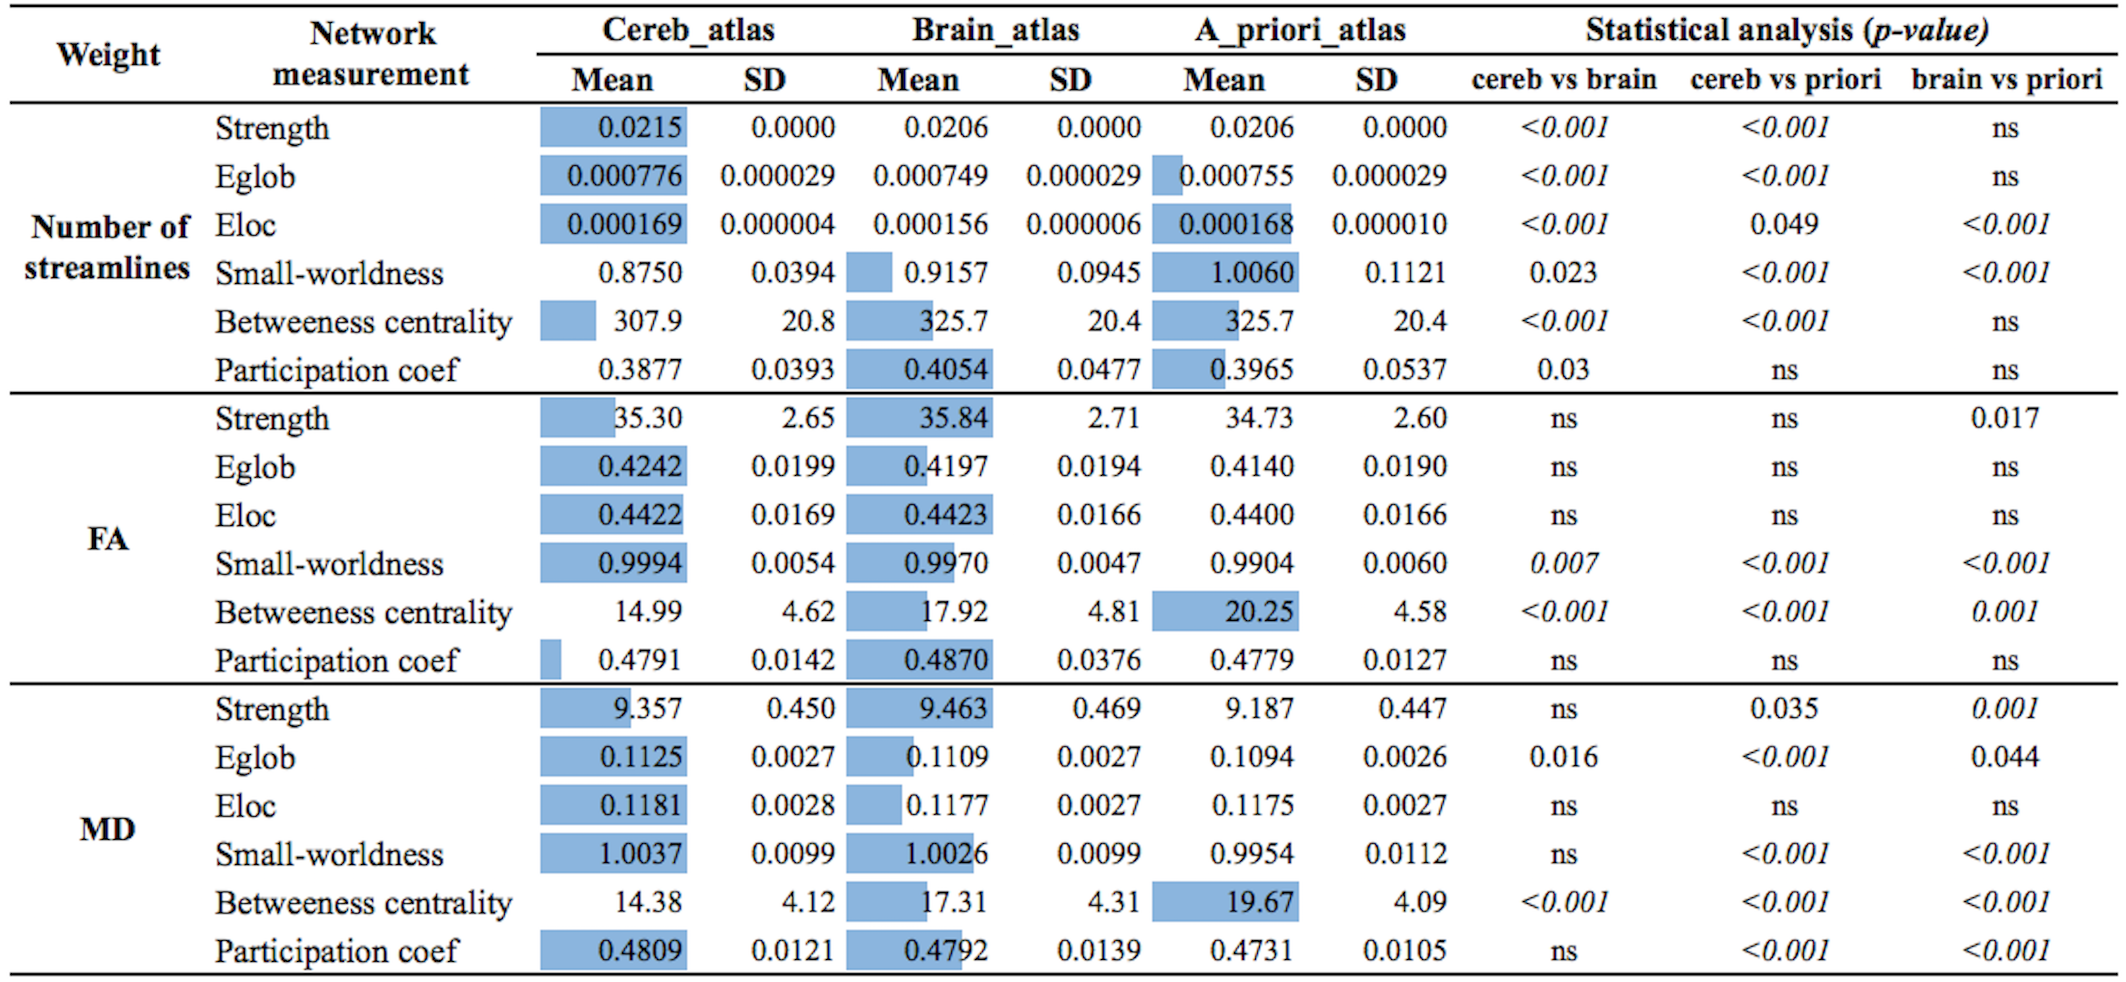
Connectomes construction is briefly described in Figure 1. Network topology (Figure 2) highlights how cerebellar connectivity is considered for each group. All differences between groups are summarized in Table 1. A_priori_atlas showed minimum values for all network metrics apart from BW when weighting for FA and MD, while brain_atlas showed minimum Eglob, Eloc and strength, and maximum BW when weighting for number of streamlines. Network topology was highly influenced by the presence or the absence of the cerebellum and its connections.Discussion
Our main finding is that cerebellar connectivity plays a key role for understanding the substrate of cerebral processing at a large scale. The inclusion of the cerebellum decreases network metric values (apart from BW) meaning that network integration and segregation are reduced but the amount of flowing information is increased (BW is increased). Moreover, the use of a priori information regarding cerebellar connectivity, i.e. that cerebro-cerebellar connections are all contralateral, has a striking effect changing modularity proprieties of the connectome (PW is decreased). These changes need to be further investigated for understanding cerebellar and brain organization at large-scale12.Acknowledgements
We thank University of Pavia and C. Mondino National Neurological institute (Pavia, Italy) for funding (5 per 1000, year 2013); UCL-UCLH Biomedical Research Centre (London, UK) for ongoing support.References
1 Yeh, C.-H., Smith, R. E., Liang, X., Calamante, F. & Connelly, A. Correction for diffusion MRI fibre tracking biases: The consequences for structural connectomic metrics. NeuroImage, doi:10.1016/j.neuroimage.2016.05.047 (2016).
2 Caminiti, S. P. et al. Metabolic connectomics targeting brain pathology in dementia with Lewy bodies. J Cereb Blood Flow Metab 0, 1-15, doi:10.1177/0271678X16654497 (2016).
3 Pannek, K., Boyd, R. N., Fiori, S., Guzzetta, A. & Rose, S. E. Assessment of the structural brain network reveals altered connectivity in children with unilateral cerebral palsy due to periventricular white matter lesions. Neuroimage Clin 5, 84-92, doi:10.1016/j.nicl.2014.05.018 (2014).
4 Ramnani, N. The primate cortico-cerebellar system: anatomy and function. Nat Rev Neurosci 7, 511-522, doi:10.1038/nrn1953 (2006).
5 Bhushan, C., Haldar, J. P., Joshi, A. a. & Leahy, R. M. Correcting Susceptibilty-induced distortion in duffusion-weighted MRI using constrained nonridgid registration. Signal Inf Process Assoc Annu Summit Conf APSIPA Asia Pac, 1-9 (2012).
6 Smith, S. M. et al. Advances in functional and structural MR image analysis and implementation as FSL. NeuroImage 23, 208-219, doi:10.1016/j.neuroimage.2004.07.051 (2004).
7 Smith, R. E., Tournier, J.-D., Calamante, F. & Connelly, A. Anatomically-constrained tractography: improved diffusion MRI streamlines tractography through effective use of anatomical information. NeuroImage 62, 1924-1938, doi:10.1016/j.neuroimage.2012.06.005 (2012).
8 Tournier, J.-D., Calamante, F. & Connelly, A. 1670 (2010).
9 Smith, R. E., Tournier, J.-D., Calamante, F. & Connelly, A. SIFT2: Enabling dense quantitative assessment of brain white matter connectivity using streamlines tractography. NeuroImage 119, 338-351, doi:10.1016/j.neuroimage.2015.06.092 (2015).
10 Tzourio-Mazoyer, N. et al. Automated anatomical labeling of activations in SPM using a macroscopic anatomical parcellation of the MNI MRI single-subject brain. NeuroImage 15, 273-289, doi:10.1006/nimg.2001.0978 (2002).
11 Diedrichsen, J., Balsters, J. H., Flavell, J., Cussans, E. & Ramnani, N. A probabilistic MR atlas of the human cerebellum. NeuroImage 46, 39-46, doi:10.1016/j.neuroimage.2009.01.045 (2009).
12 Tononi, G. An information integration theory of consciousness. BMC Neurosci 5, 42-42, doi:10.1186/1471-2202-5-42 (2004).
Figures