1751
Introducing axonal myelination in connectomics: a preliminary analysis of g-ratio distribution in healthy subjectsMatteo Mancini1,2, Giovanni Giulietti2, Nick Dowell3, Barbara Spanò2, Neil Harrison3, Marco Bozzali2, and Mara Cercignani2,3
1University of Rome "Roma Tre", Rome, Italy, 2Neuroimaging Laboratory, Santa Lucia Foundation, Rome, Italy, 3Clinical Imaging Sciences Centre, University of Sussex, Brighton, United Kingdom
Synopsis
We estimated the g-ratio (i.e., the ratio of the inner and the outer diameters of myelinated axons) in-vivo in two different datasets of healthy subjects using diffusion and magnetization data. We used this measure to characterize the organization of the structural connectome and compared it to the information obtained by the streamlines reconstructed using tractography. The g-ratio significantly differentiated hub-related aspects of the connections and subcortico-cortical organization. These preliminary results showed that this measure could provide complementary information to the connectome structure.
Purpose
Recently, the fusion of different MRI modalities has made it possible to estimate the g-ratio (i.e., the ratio of the inner and the outer diameters of myelinated axons) in-vivo1. Since this measure is associated with axonal conduction speed, it offers a potential new way to characterize the structural connectome and integrate the results obtained using the number of streamlines2 (NOS). The aim of this study is to characterize the g-ratio distribution over the white matter streamlines using two different datasets of healthy subjects and an approach based on graph theory.Methods
The datasets were acquired at two different sites, using different scanners and protocols. At site A, 17 healthy subjects (M/F: 6/11; mean age (SD): 25.7 (6.7)) were scanned at 1.5T, using a 3-shell diffusion MRI (dMRI) protocol for neurite orientation dispersion and density imaging3 (NODDI) and quantitative magnetization transfer (MT) imaging based on balanced steady-state free precession4 (bSSFP). At site B, images from 15 healthy subjects (M/F: 7/8; mean age (SD): 28.9 (4.8)) were acquired at 3T using again a 3-shell dMRI protocol optimised for NODDI5 and a series of 10 MT-weighted 3D gradient echo volumes with differing MT-weightings. T1-weighted volumes were acquired as well at both the sites. T1 images were pre-processed using FreeSurfer and parcellated with the Desikan-Killiany atlas. Diffusion data were co-registered to the respective average of b0 volumes in order to minimize artifacts. Streamlines were deterministically reconstructed using tensor fitting by means of Diffusion Toolkit and then co-registered to the anatomical space using an inverse linear transformation. Using the MT and NODDI data, the g-ratio was estimated as in 6, and co-registered to the anatomical space using an inverse non-linear warping. The structural connectome was reconstructed for each subject counting the NOS between every possible pair of regions, and arranging such values into an adjacency matrix. For these streamlines, the average g-ratio was computed. Appropriate thresholds were used to avoid spurious connections. Strength distribution for all the regions was computed and compared to the corresponding average g-ratio. Moreover, for each region the percentage of tracts with a theoretically optimal g-ratio7 (range: 0.75-0.8) was calculated. Then, hubs have been defined taking the eight regions with highest strength values. Alternative hub definitions have been used (top twelve regions, regions with strength greater than the average plus one standard deviation). The connections have been classified on the basis of the nodes interconnected to (hub-hub: rich-club; hub-peripheral: feeder; peripheral-peripheral: local). For each class the median of the related g-ratio distribution has been computed. As further rich-club analysis, the s-core decomposition was used: for a range of strength values, the connections with lower strength were removed and the median g-ratio of remaining tracts computed. Finally, other classifications were explored: subcortical/cortical, inter-/intra-hemispherical. Sign test was used for assessing significance of differences between connection classes.Results
Figure 1 shows the average connectome for dataset A (fig. 1a-c) and B (fig. 1b-d) using NOS and G-ratio. While the strength distribution showed the characteristic power-law distribution (fig. 2b, fig. 3b), the related average g-ratio across the regions didn’t present any particular pattern (fig. 2b, fig. 3b). Figures 2c and 3c show the distribution of the percentage of “optimal” fibers. Local connections showed a significant higher g-ratio when compared to feeder (A: p=0.0002, fig. 4a; B: p=0.00006, fig. 4b) and rich-club (A: p=0.0127, fig. 4a; B: p=0.00006, fig. 4b). Consistently, the s-core decomposition showed that the median g-ratio decreased (i.e. the relative amount of myelin increased) as the strength increased (fig. 4c). Subcortical connections showed a higher g-ratio than cortical (A: p=0.0002, fig. 5a; B: p=0.00006, fig. 5b) and subcortico-cortical (A: p=0.0002, fig. 4a; B: p=0.00006, fig. 4b) connections. Finally, while the dataset A showed no significance in any inter-/intra-hemispheric comparison (fig. 5c), the dataset B showed significance differences while comparing intra- and inter-hemispheric connections (right-inter: p=0.0073; left-inter: p=0.00006; fig. 5d).Discussion
Although the median g-ratio distribution didn’t show particular trends, it was able to differentiate connections on the basis of the hub structure and the subcortico-cortical organization. Fibers with an optimal value were observed mostly in the subcortical and temporal areas. Regarding the subcortico-cortical classification, notably the g-ratio showed in both the datasets a trend already observed in a previous rat study7. Overall, the results obtained showed consistency across the two datasets despite acquisition and processing differences.Conclusion
To the best of our knowledge, this is the first study that explores the structural connectome by means of the g-ratio. These preliminary results showed that this measure could provide complementary information to the connectome structure.Acknowledgements
This work was funded by the Italian Ministry of Health (RF-2013-02358409).References
1. Stikov et al. In vivo histology of the myelin g-ratio with magnetic resonance imaging. Neuroimage 2015, 4: 368-73; 2. Collin et al. Structural and Functional Aspects Relating to Cost and Benefit of Rich Club Organization in the Human Cerebral Cortex. Cereb Cortex 2014, 24(9): 2258–67; 3. Zhang H, et al. NODDI: practical in vivo neurite orientation dispersion and density imaging of the human brain. Neuroimage 2012, 61: 1000-16; 4. Gloor et al. Quantitative magnetization transfer imaging using balanced SSFP. Magn Reson Med 2008, 60:691-700; 5. Daducci et al. Accelerated Microstructure Imaging via Convex Optimization (AMICO) from diffusion MRI data. Neuroimage 2015, 105: 32-44; 6. Cercignani et al. Characterizing axonal myelination within the healthy population: a tract-by-tract mapping of effects of age and gender on the fiber g-ratio. Neurobiology of Aging 2017, 49: 109-118; 7. Chomiak and Hu. What Is the Optimal Value of the g-Ratio for Myelinated Fibers in the Rat CNS? A Theoretical Approach. PLoS ONE 2009, 4(11): e7754.Figures
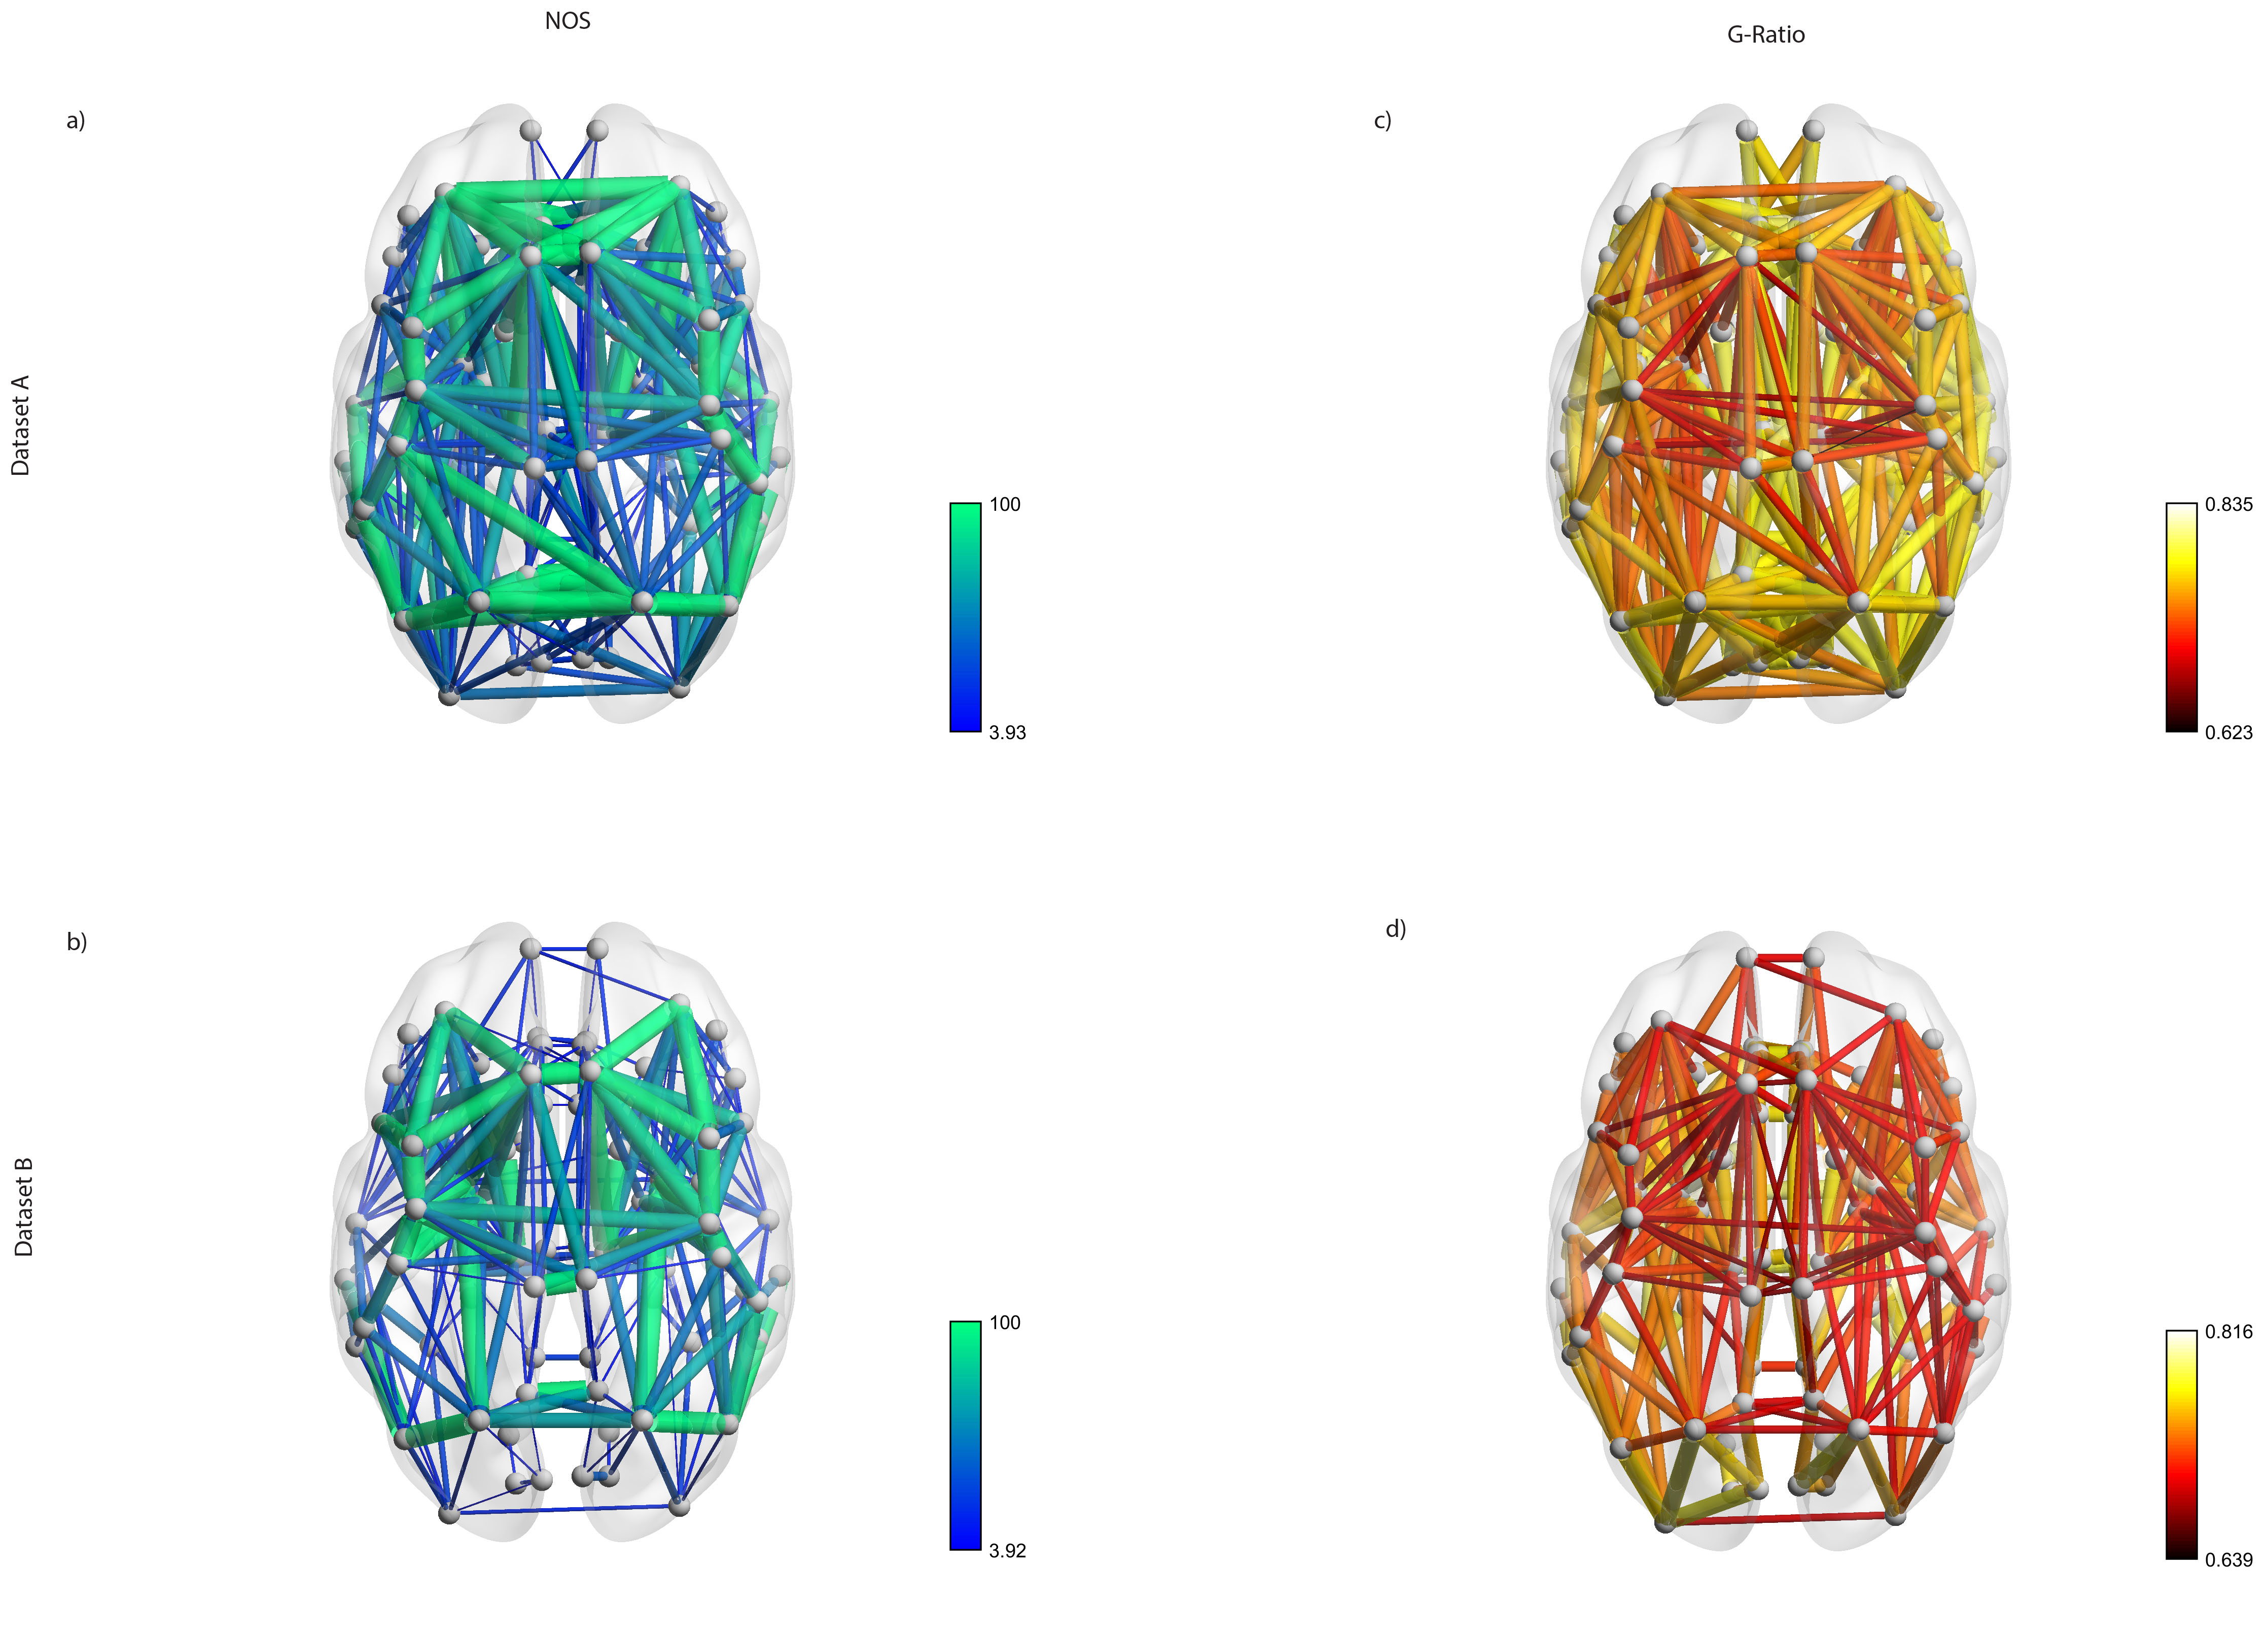
Average connectome represented using the number of streamlines (a-b) and the g-ratio (c-d) as weights for both the datasets.
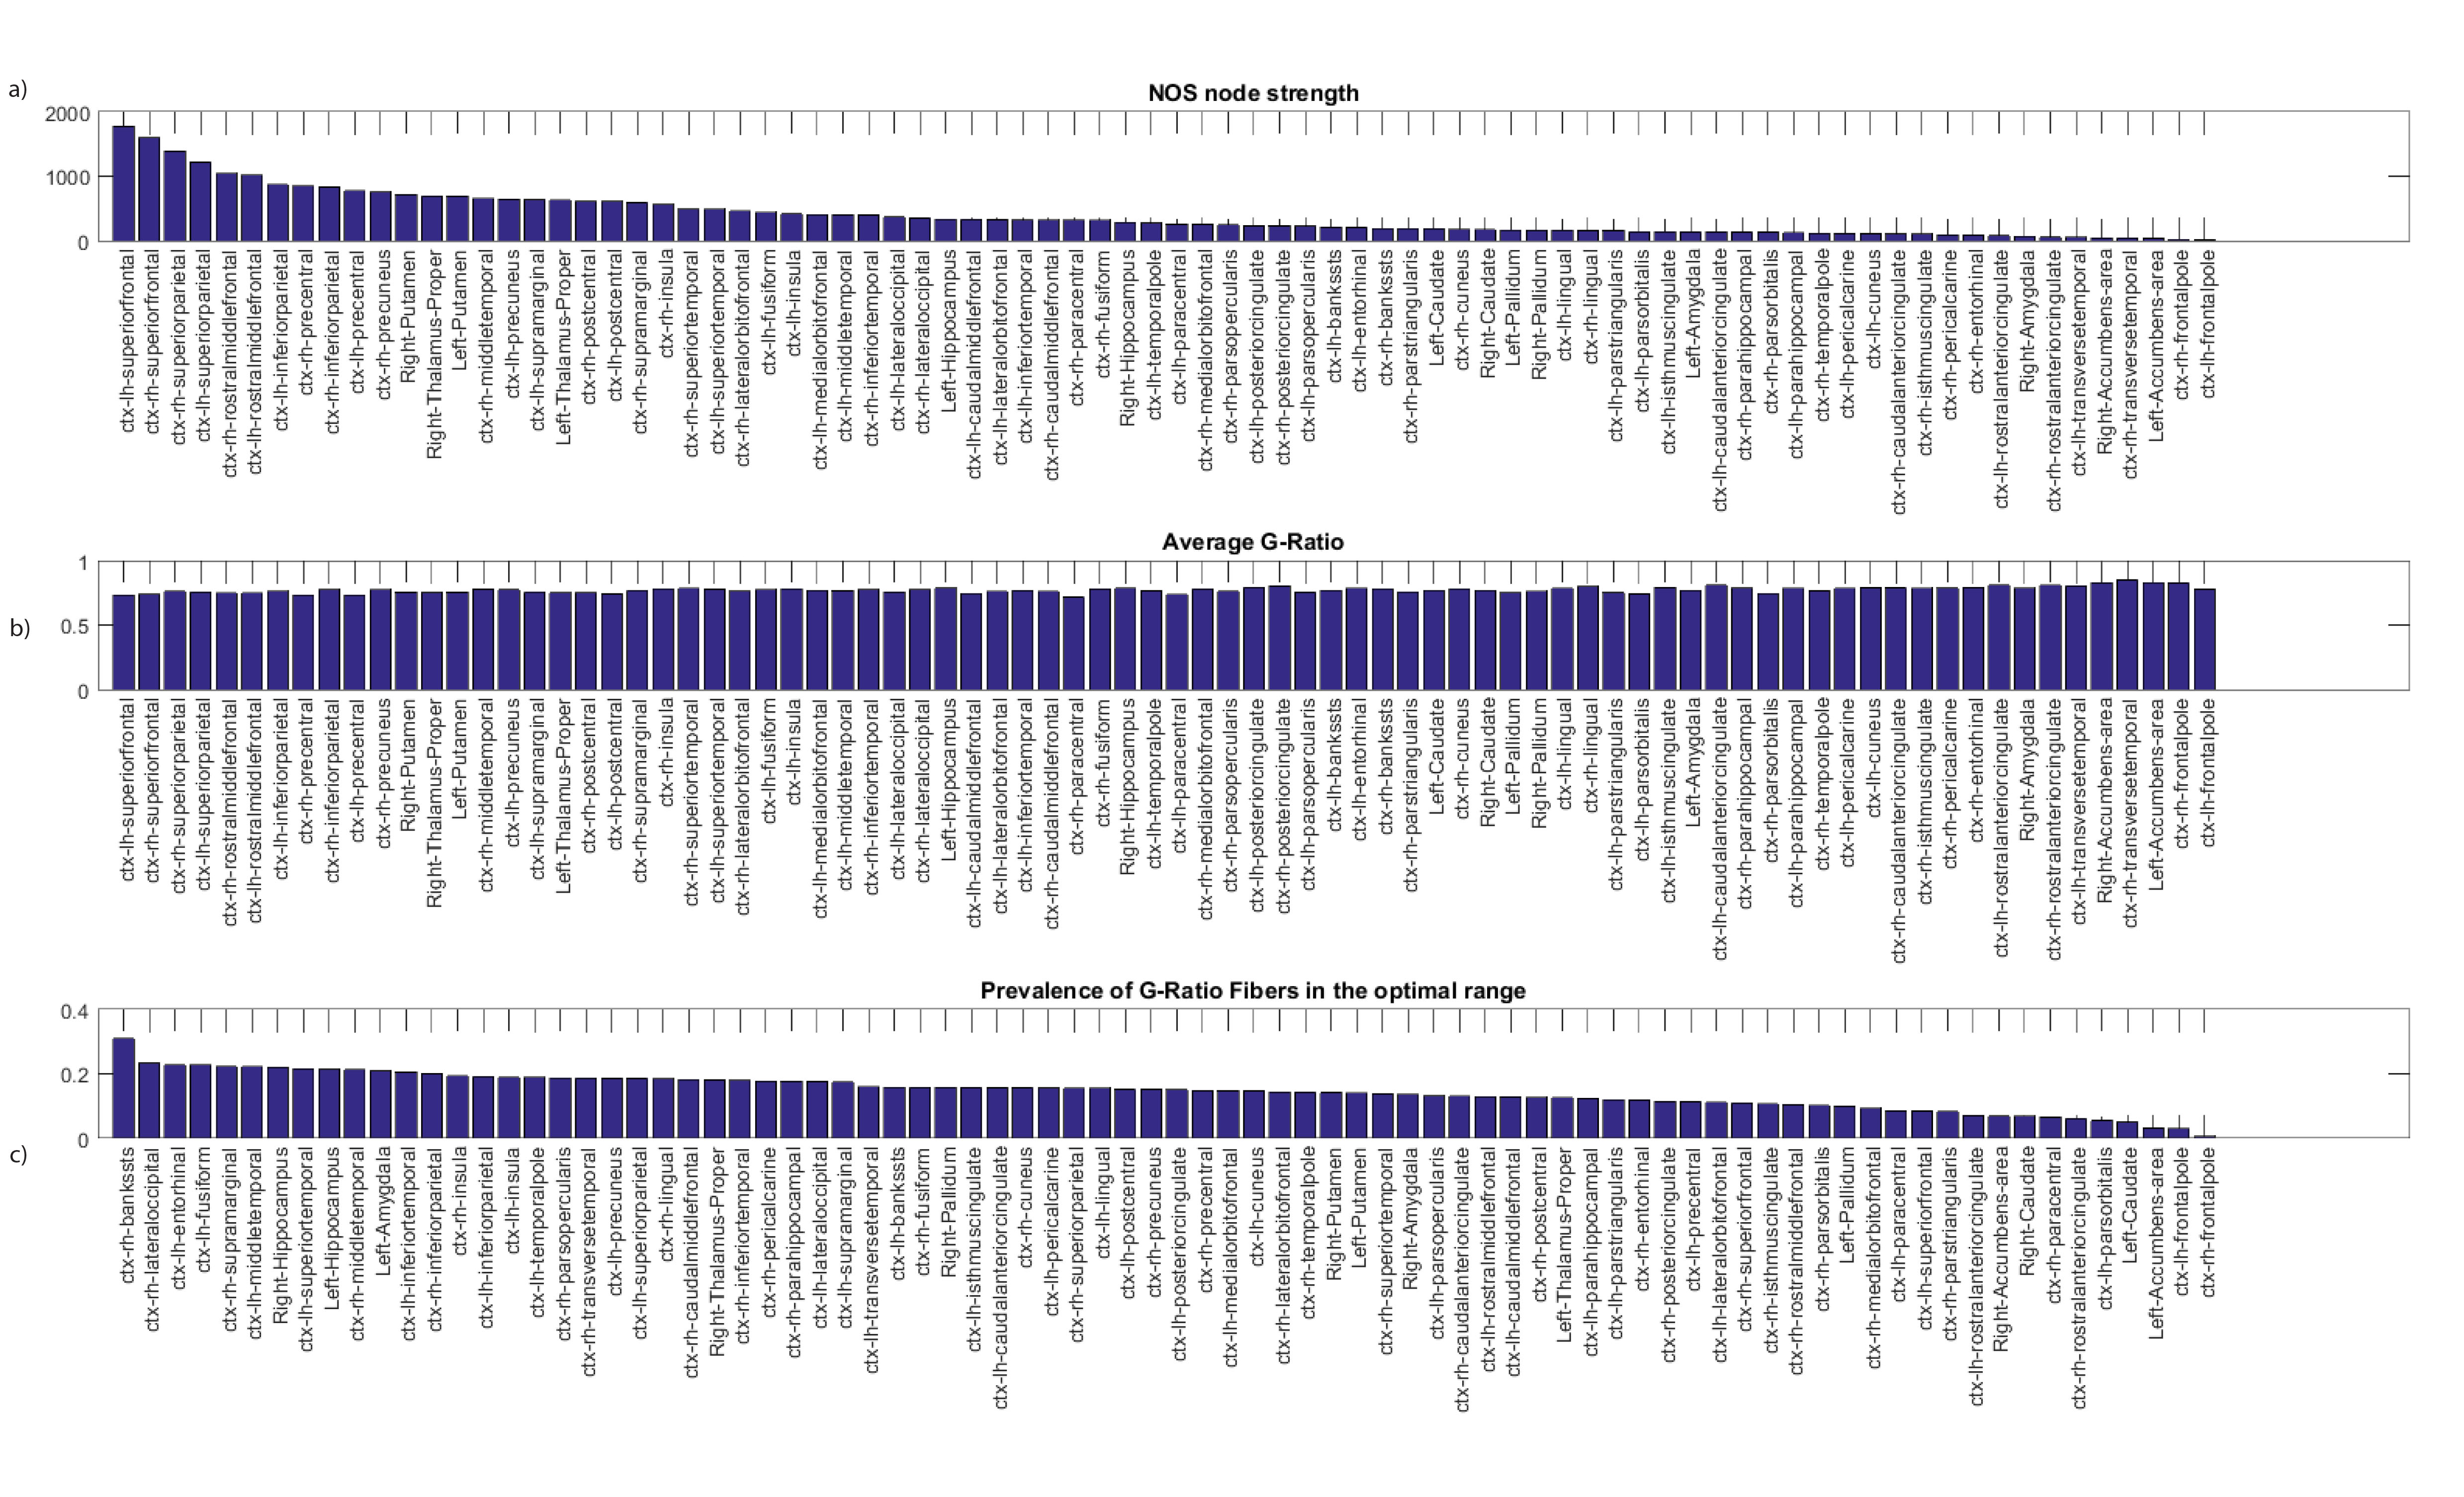
Strength distribution (a), average g-ratio (b) and percentage of "optimal" fibers (c) across anatomical regions for dataset A.
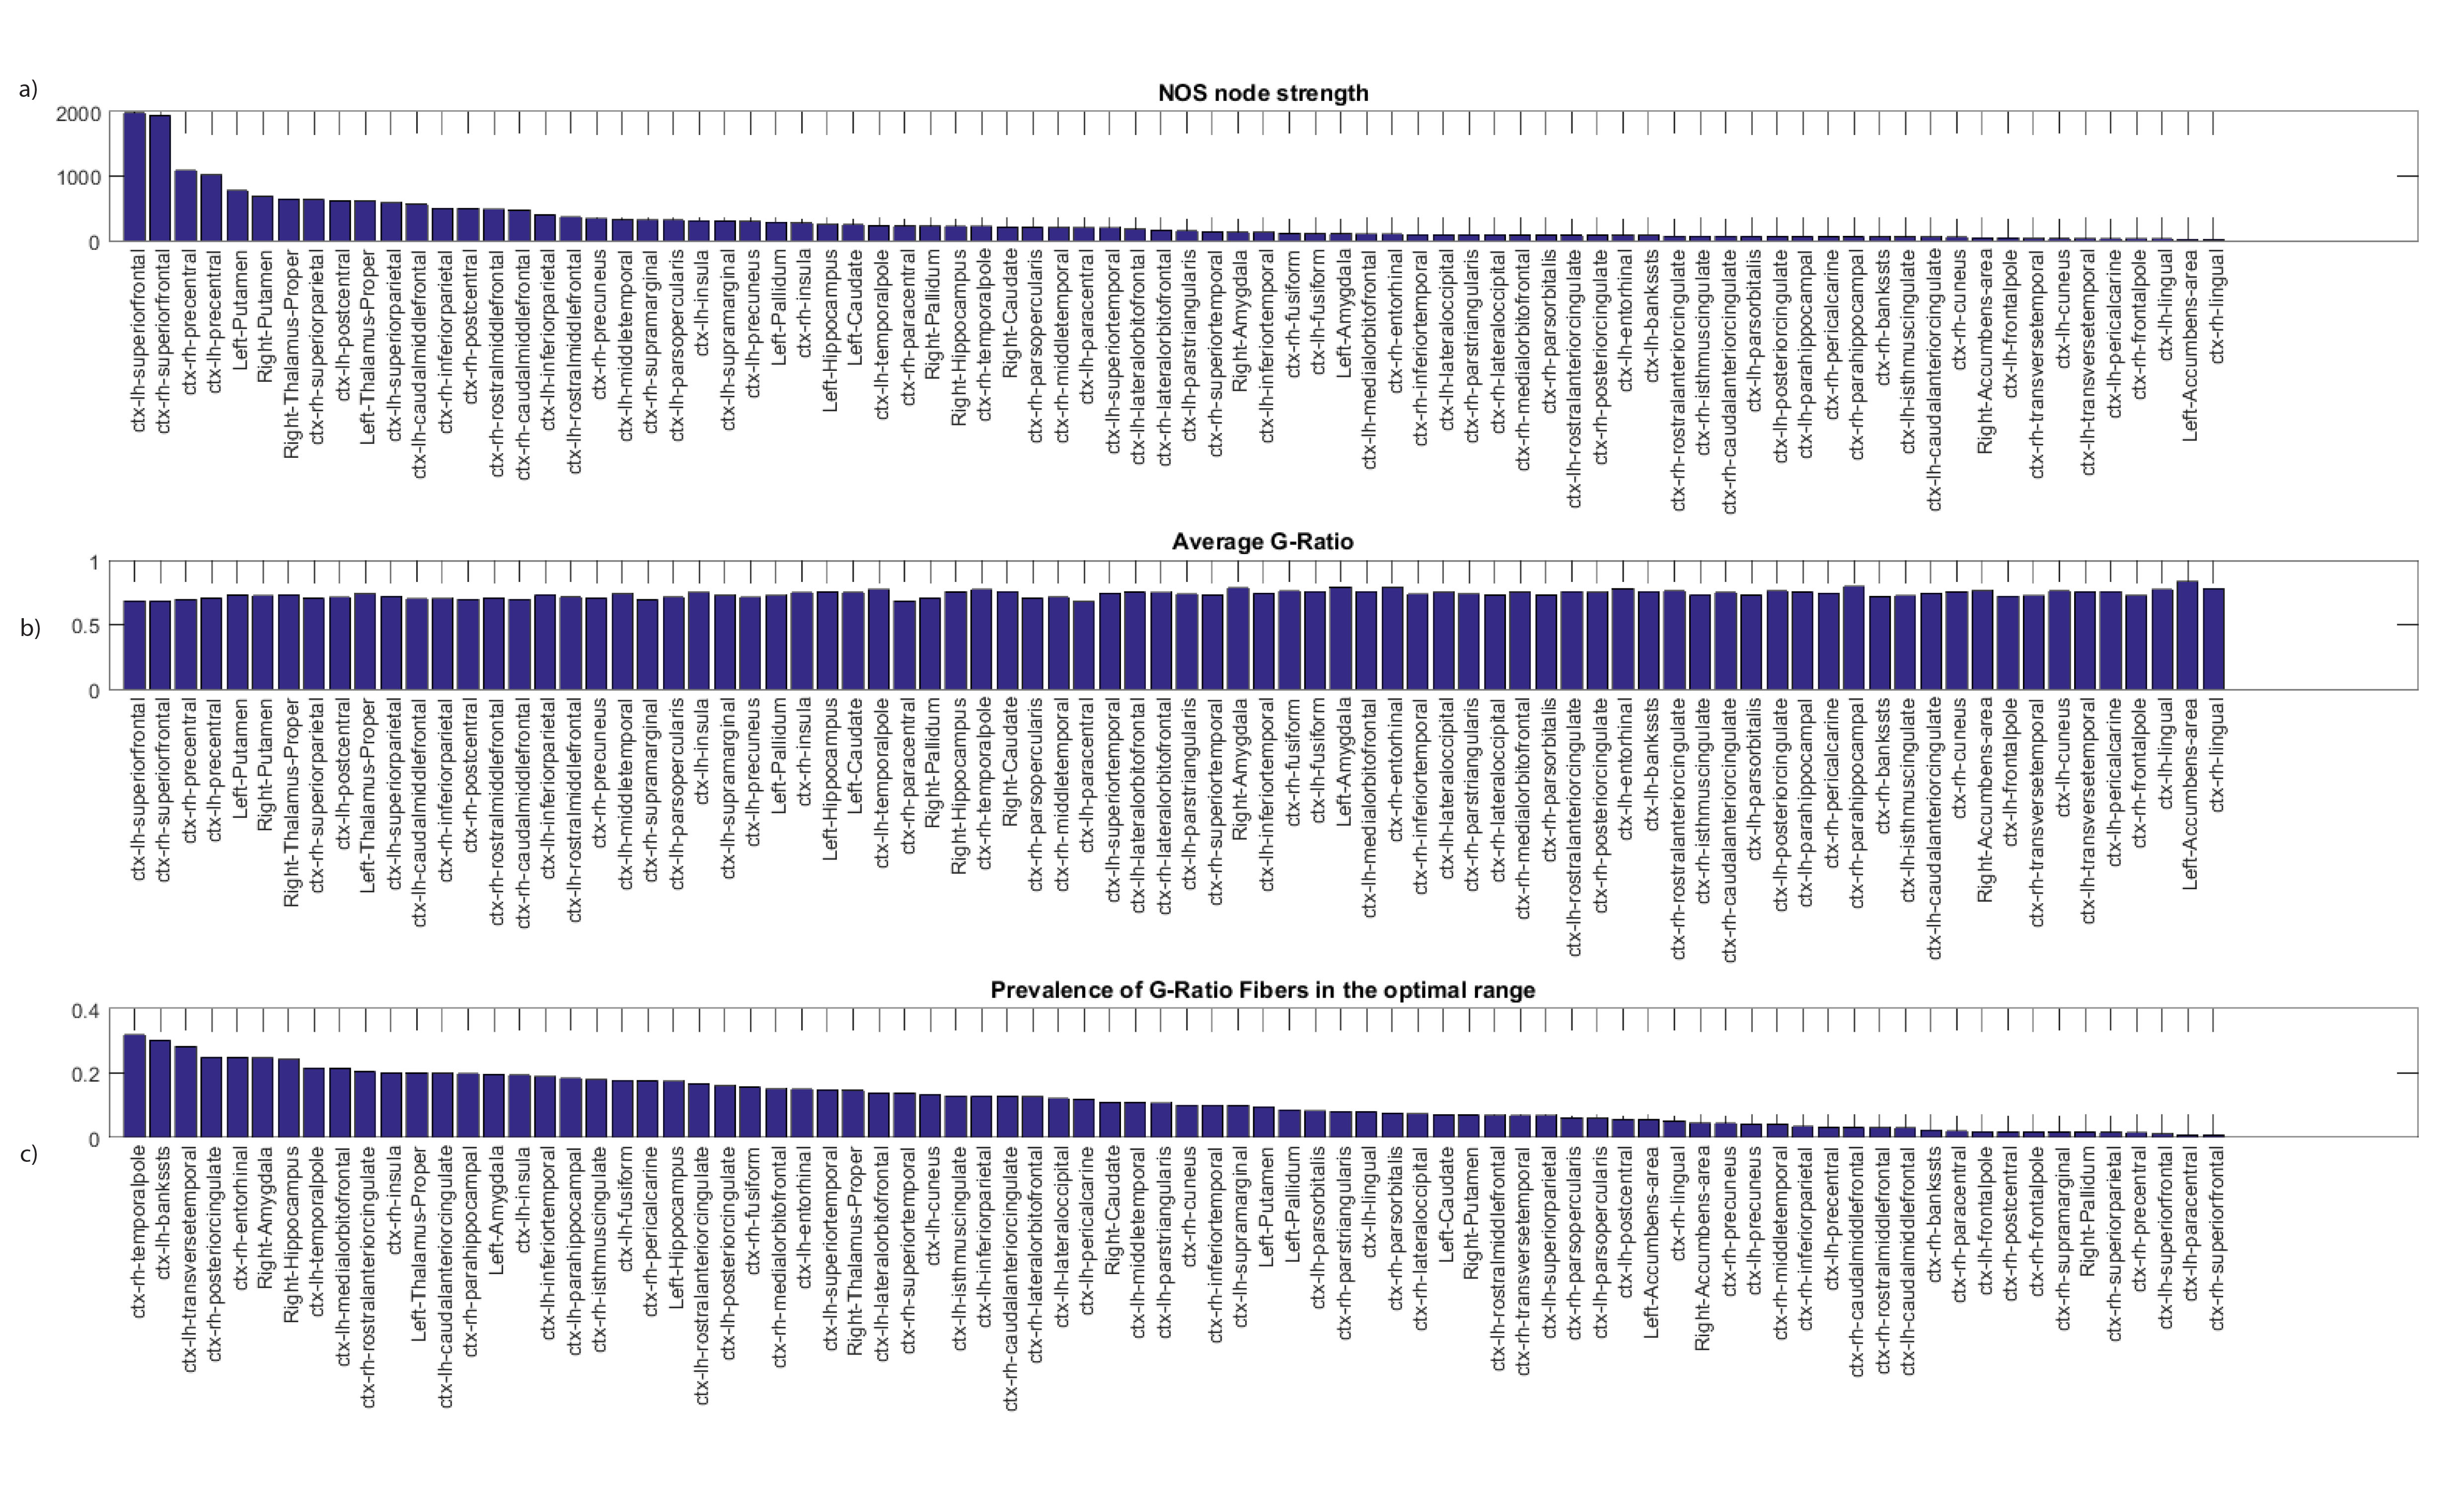
Strength distribution (a), average g-ratio (b) and percentage of "optimal" fibers (c) across anatomical regions for dataset B.
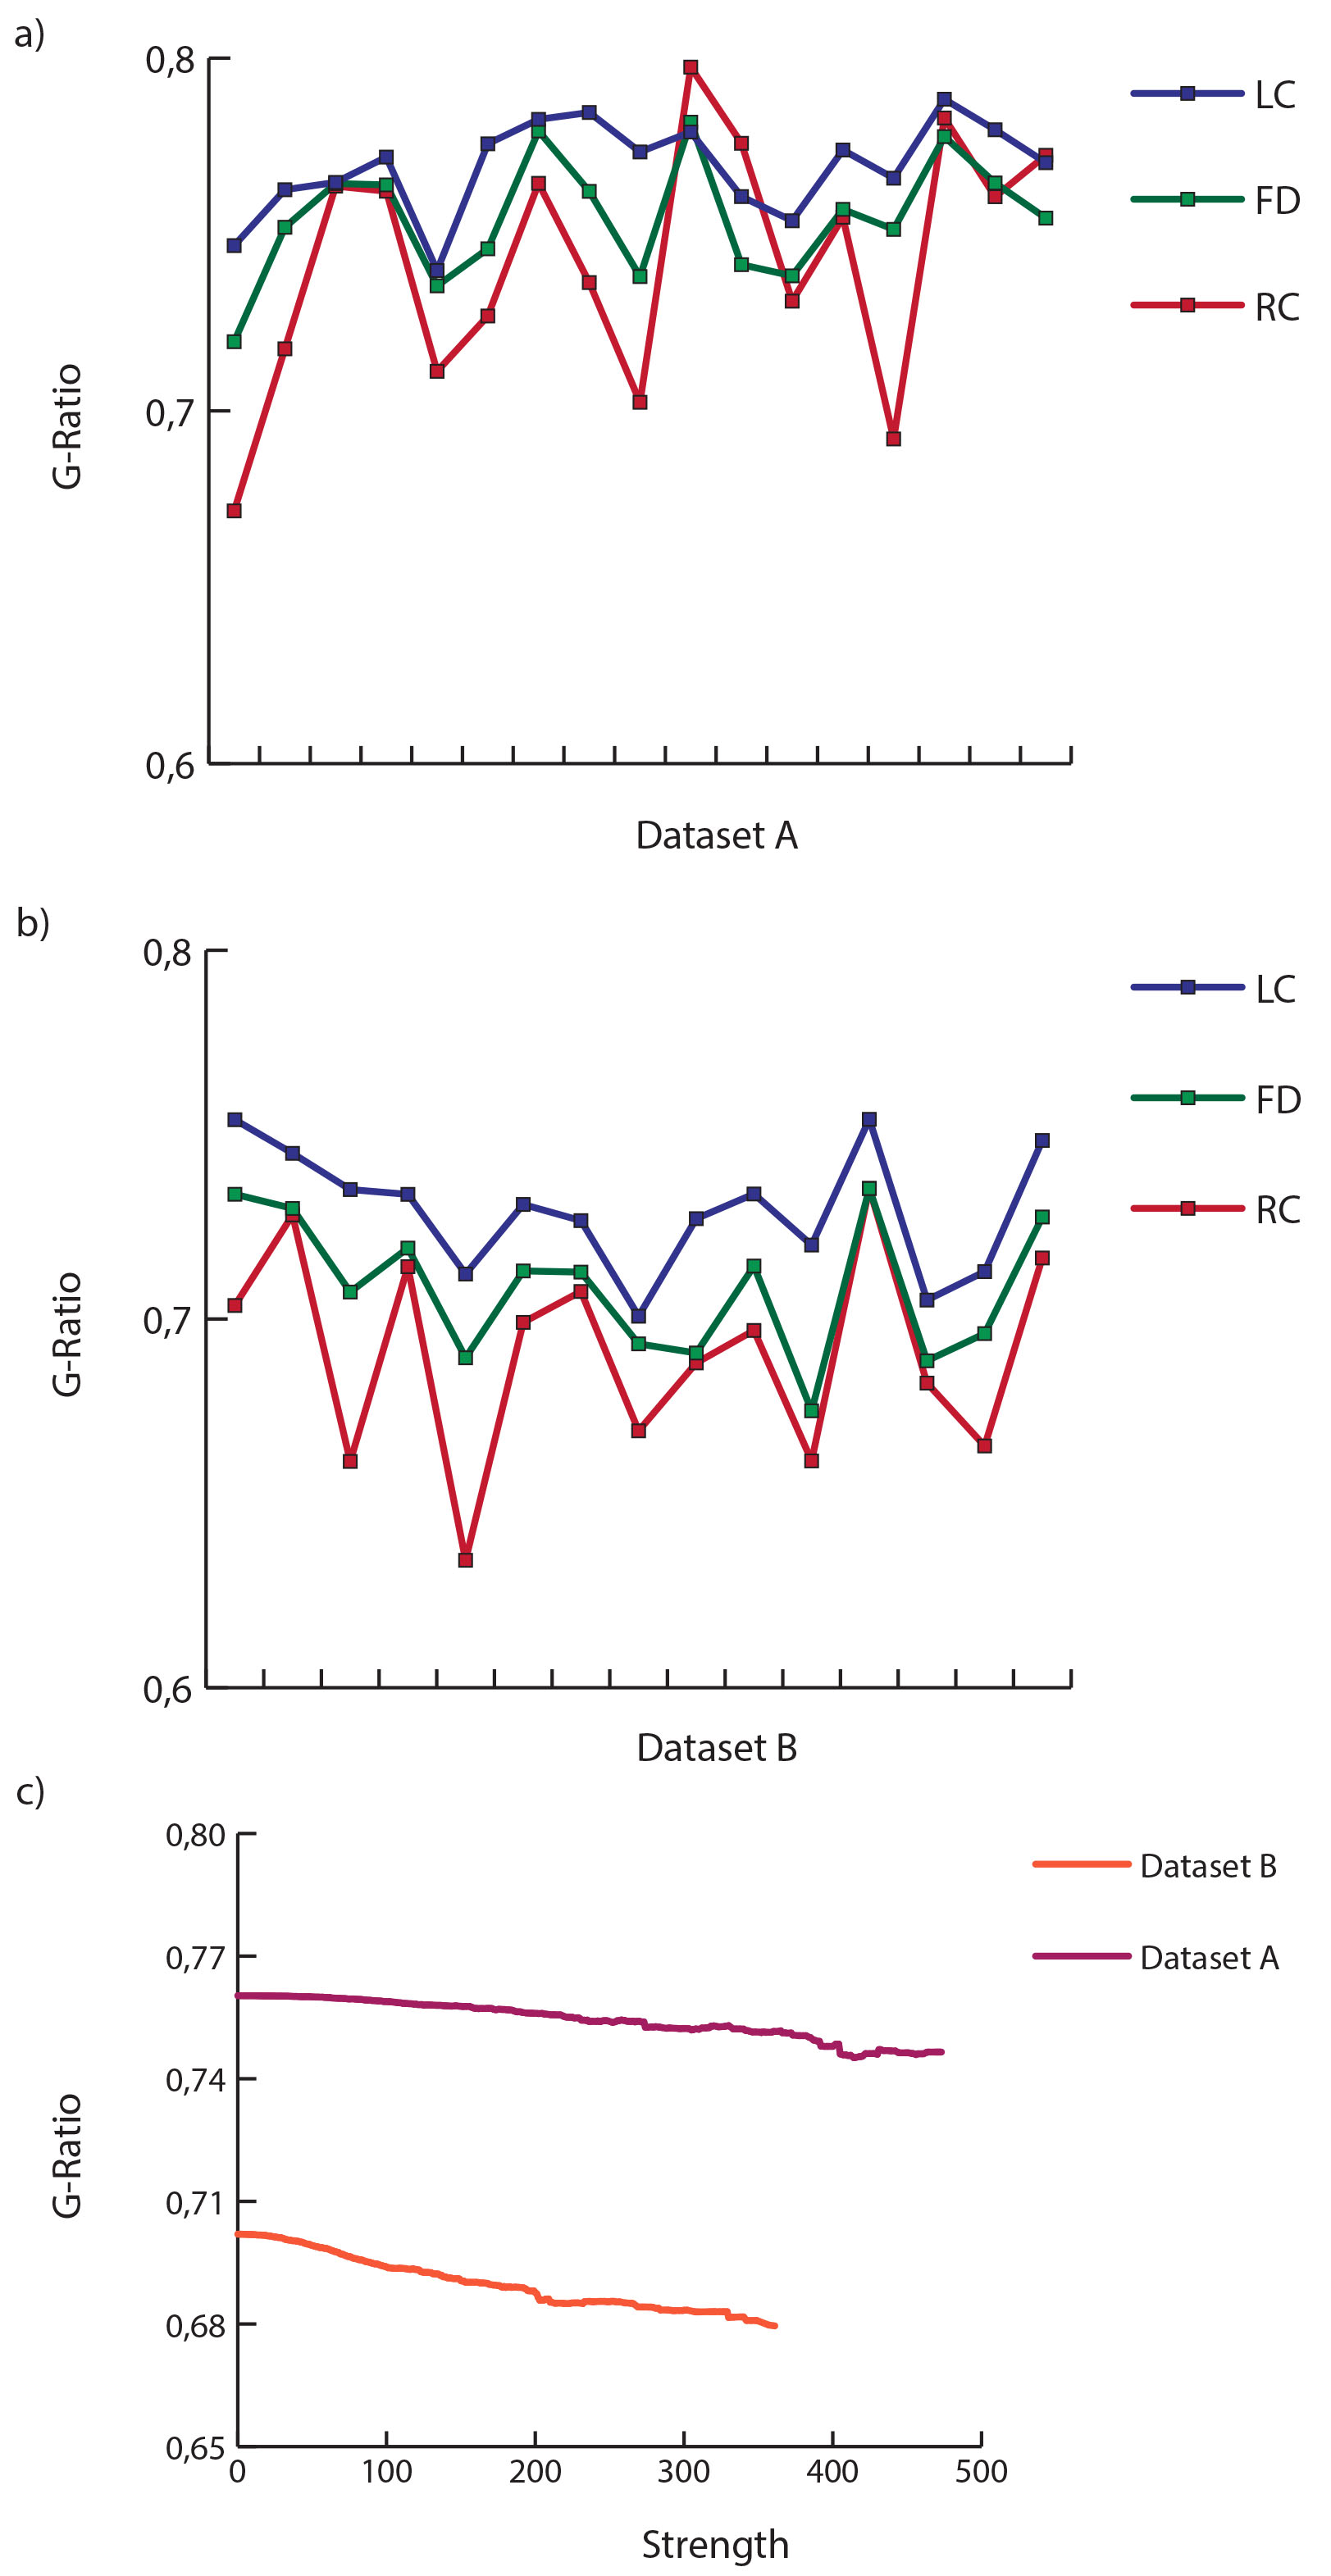
Median g-ratio values of rich-club, feeder and local connections for dataset A (a) and B (b), and s-core decomposition of both the datasets (c).
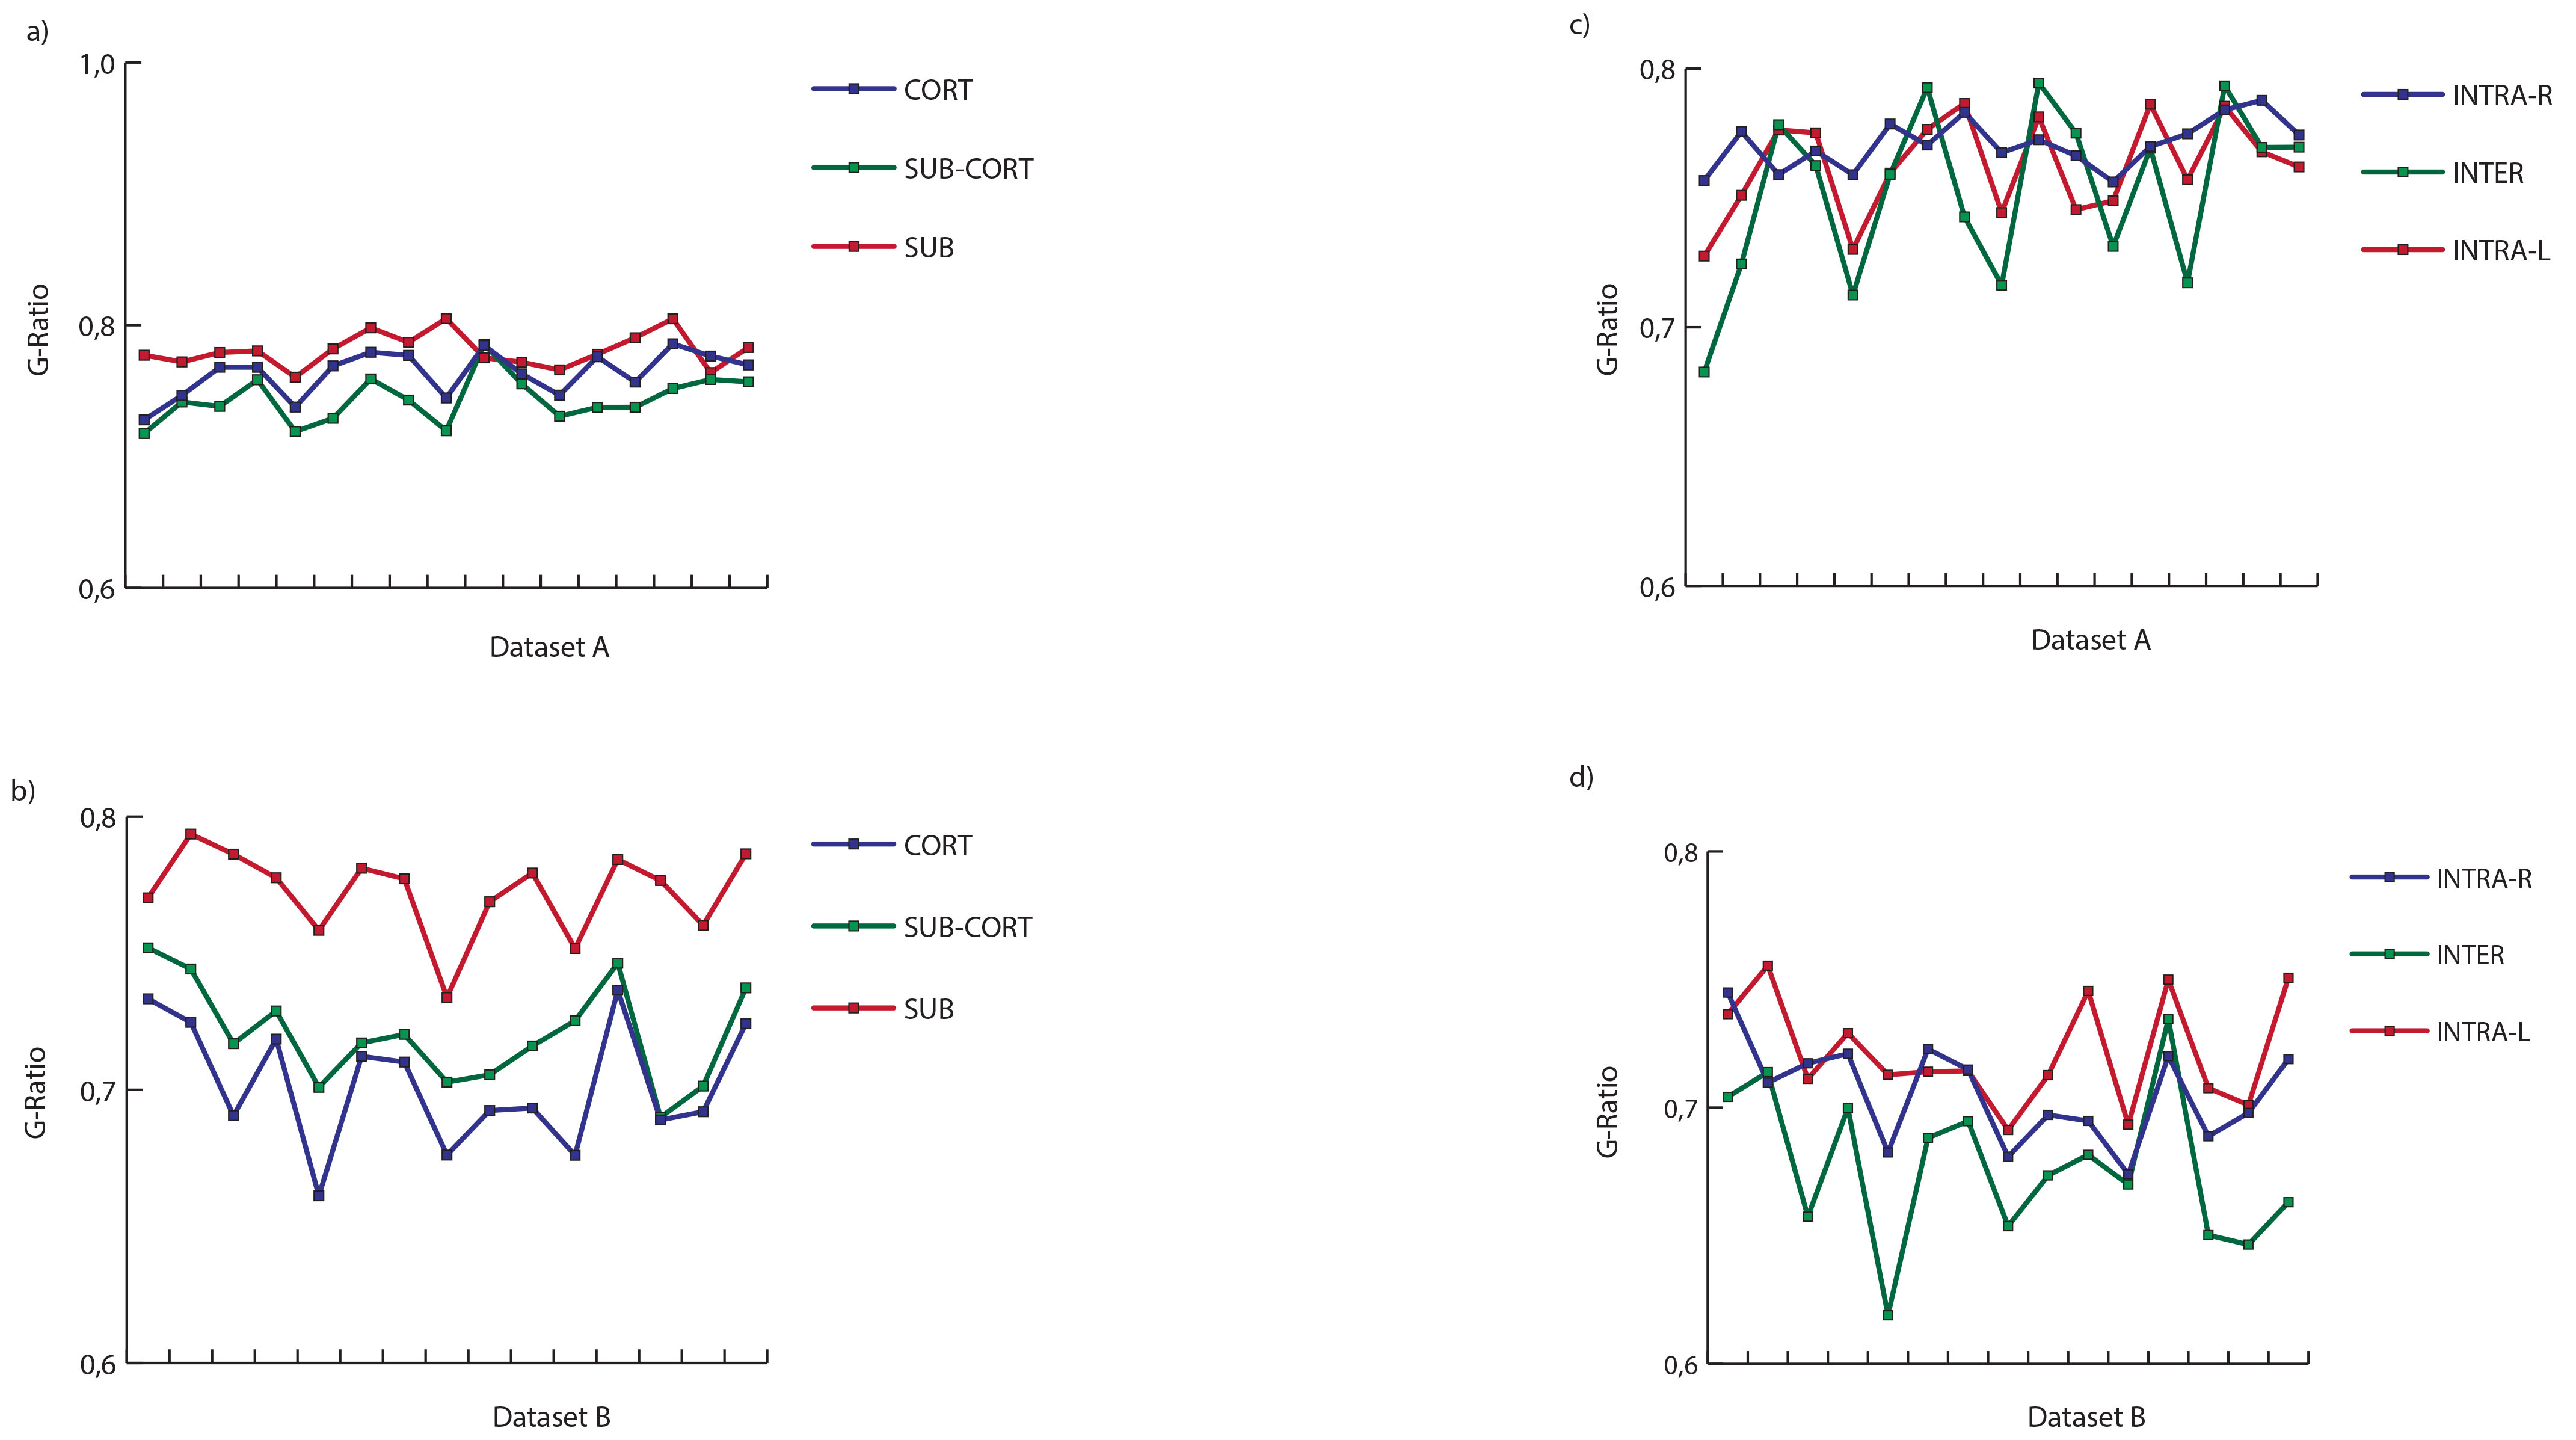
Median g-ratio values of cortical, subcortical and subcortico-cortical connections (a-b) and median values of inter- and intra-hemispherics ones (c-d).