1749
Preliminary Investigation on NODDI for Studying Spinal Cord Microstructure of Postoperative CSM Patients1Center for Biomedical Imaging Research, Department of Biomedical Engineering, School of Medicine, Tsinghua University, Beijing, China, Beijing, People's Republic of China, 2Department of Surgery, Beijing Jishuitan Hospital, Beijing, China, Beijing, People's Republic of China, 3Department of Radiology, Beijing Jishuitan Hospital, Beijing, China
Synopsis
In this study, the neurite orientation dispersion and density imaging (NODDI) was used to investigate the spinal cord microstructure for postoperative CSM patients. MRI data were acquired on eleven patients with a long time after surgery. The value of the calculated parameters (OD, Viso and Vic) were preliminarily evaluated. Statistical results show that OD of grey matter is lower at the stenotic level than the normal level, and Viso in both grey and white matter is higher. To the best of our knowledge, this is the first time that the application of NODDI in the spinal cord disease was reported.
Purpose
Diffusion Tensor Imaging (DTI) is a quantitative method for evaluating the spinal cord function, and is useful for a diverse range of cervical spine diseases, including cervical spondylosis myelopathy (CSM). Previous studies have shown that fractional anisotropy (FA) calculated from DTI model is positively correlated with the clinical scores of preoperative CSM patients, and is capable to predict short-term myelopathy outcome after surgery [1-3].
To overcome the inherent non-specific limitation of DTI, more advanced models have been proposed to reveal the microstructural information. In this study, the neurite orientation dispersion and density imaging (NODDI) [4] was used to study the spinal cord microstructure for postoperative CSM patients with a long time after surgery. The related metrics for specific features of the spinal cord, orientation dispersion (OD), isotropic volume fraction (Viso, denoting the fraction of free water) and intra-cellular volume fraction (Vic, denoting the neurite density) were preliminarily investigated.
Methods
Data acquisition
Eleven postoperative CSM patients with a long time after surgery (2 F and 9 M, age 48-74 years, mean 60.2 years) were recruited under IRB approval from Beijing Jishuitan Hospital. All data were acquired on a Philips 3.0T Ingenia scanner (Philips, Best, The Netherlands) with a 16-channel head-neck coil. The time between the surgery and postoperative MRI scan is from 12 to 19 months. For each patient, a single-shot EPI DTI sequence was used to acquire NODDI data, with reduced FOV using outer-volume suppression. Two b values of 1000 s/mm2 and 2000 s/mm2, and 32 directions were used. FOV=160×59mm2, matrix size=108×39, slice thickness=4mm, TE/TR=77/4470ms, scan time=5min. 17 axial slices were acquired with a 2mm gap, covering the vertebral segments from C2 to C7. In addition, the T2*-weighted (T2*W) three-echo FFE was used to acquire anatomical images at the same locations as NODDI, using FOV of 200×152mm2 and matrix size of 252×190.
Image processing
The diffusion-weighted images were pre-processed using spinal cord toolbox (SCT) [6], including spinal cord segmentation and slice-wise motion correction. Then they were registered to the PAM50 template through the anatomical T2*W images, using the multi-model registration tool in SCT. Afterwards, the FA maps were calculated using FSL [7], and NODDI-related parameters (OD, Viso and Vic) were calculated using NODDI MATLAB Toolbox [4]. Lastly, all parameters were analyzed using the automatic metric extraction tool in SCT, with 3 ROIs covering white mater of lateral corticospinal tracts (CST), grey matter of intermediate zone(GM) and whole spinal cord (Whole).
Statistics
To compare the computed diffusion metrics at the stenotic level and those at the normal level, a non-paired, two-tailed Student t-test was used. P<0.05 was considered statistically significant. For each patient, the stenotic level was chosen based on the preoperative anatomical MRI, and only the most severe level was used if multi-level stenosis was detected. The C2 level was chosen as the normal level.
Results and Discussion
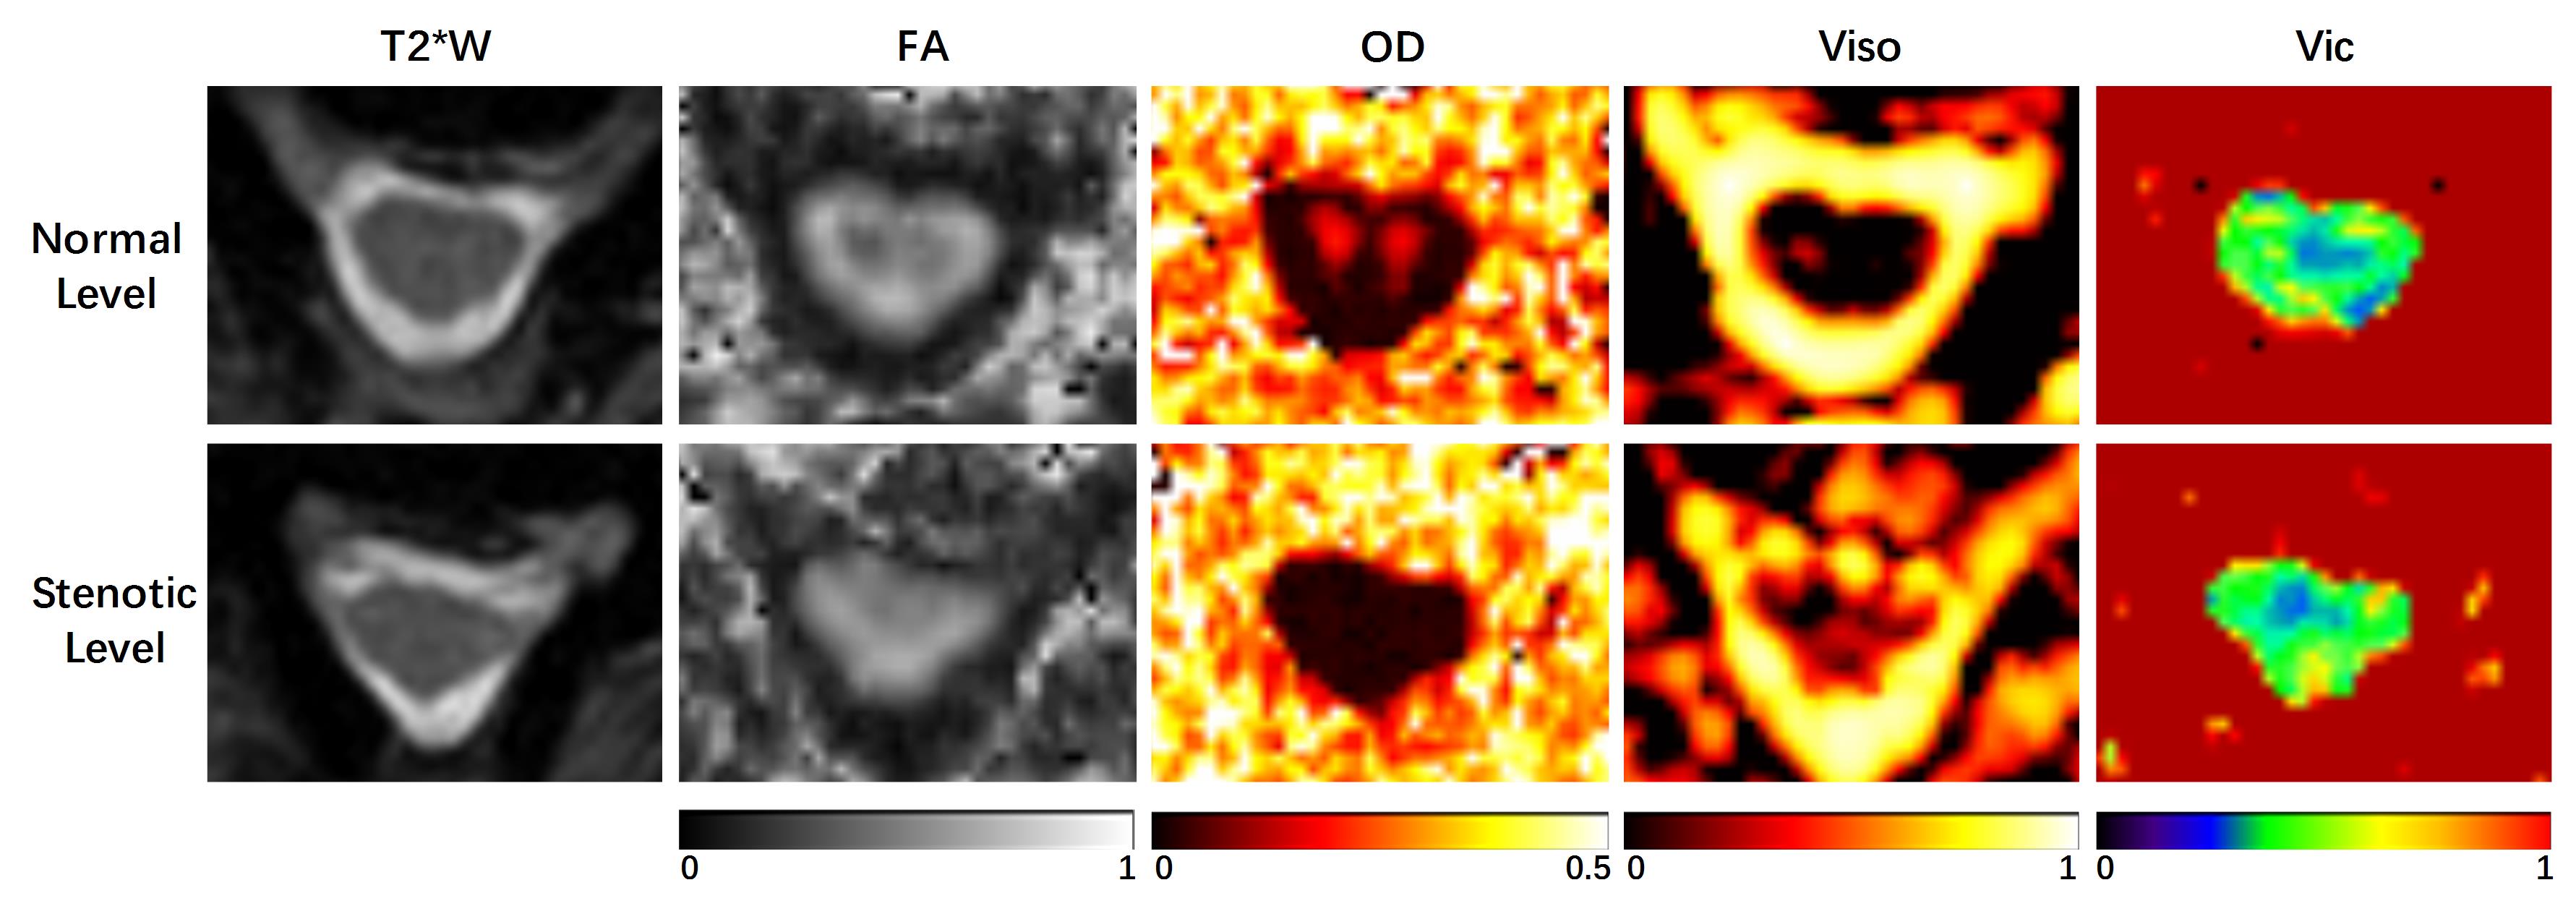
The three-echo merged T2*W images and the computed diffusion metrics of one representative patient are shown in Fig. 1. It can be observed that at the normal level, FA and OD show clear contrast between the white and grey matter, while Viso and Vic do not. This indicates that neurite density calculated by NODDI model in the spinal cord appears relatively homogeneous, which is consistent with the previous study [5].
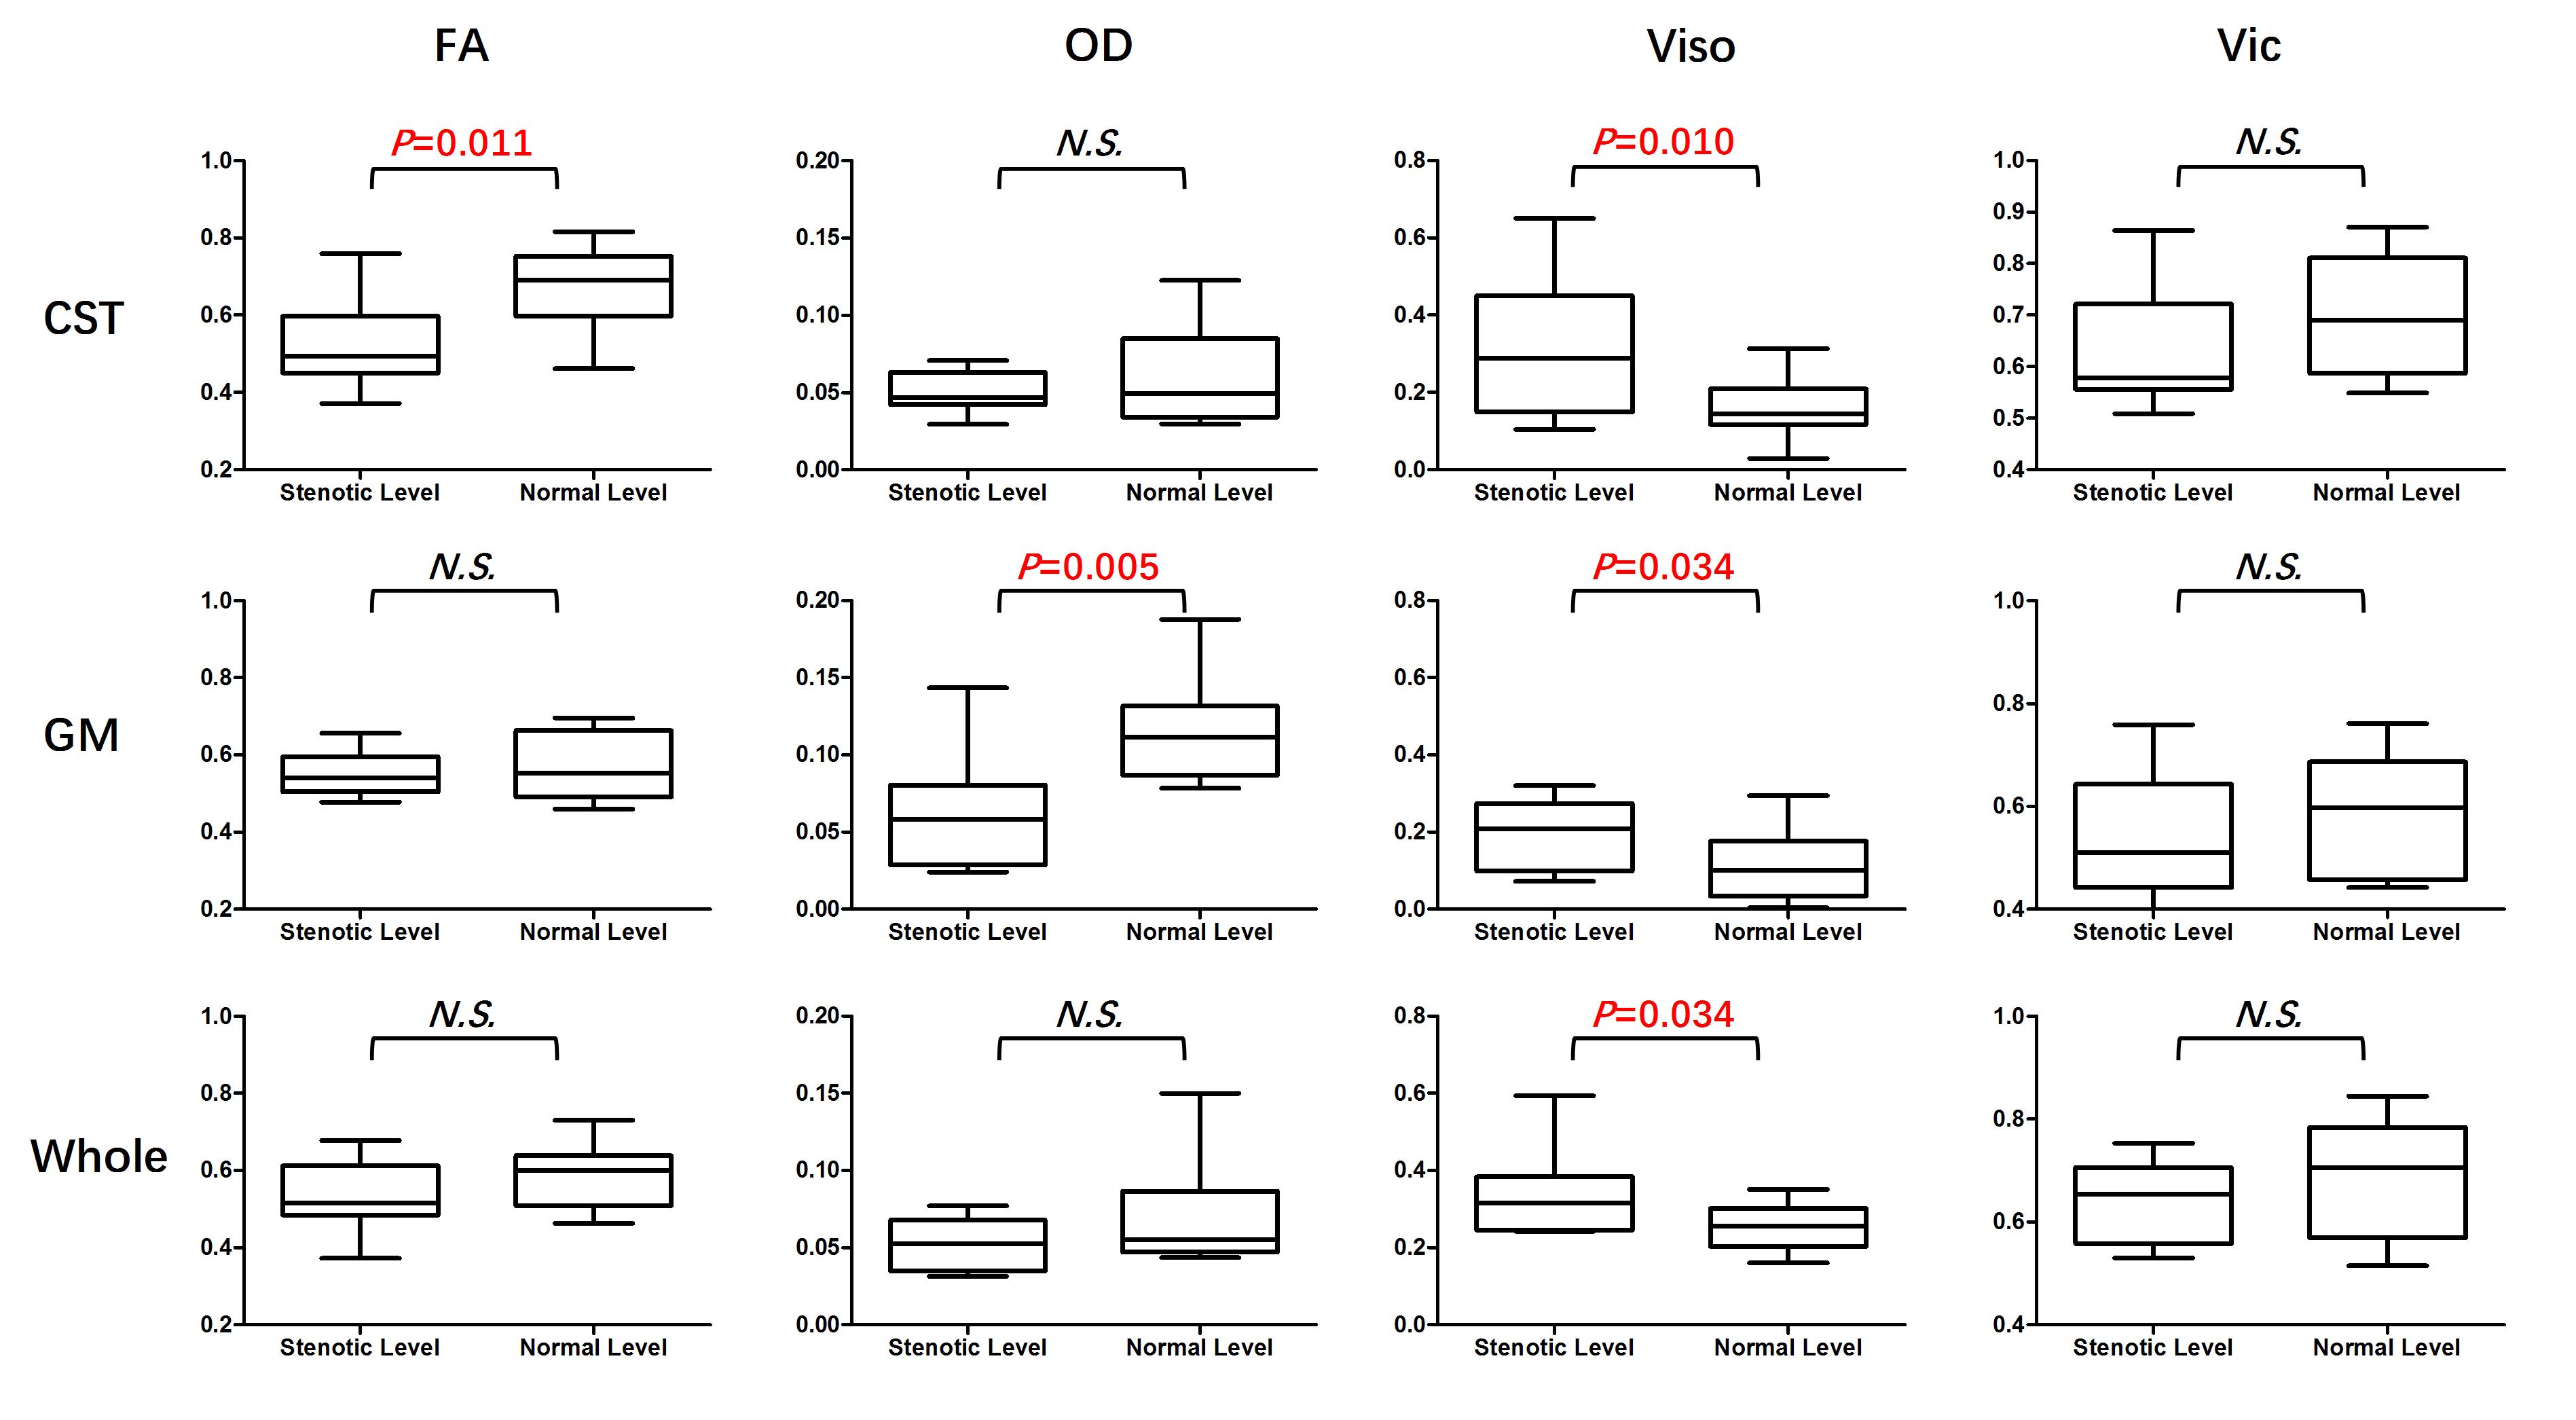
The result of t-test for the comparison of different metrics between the stenotic level and the normal level is shown in Fig. 2. FA in CST, OD in GM and Viso in all three ROIs show significant differences between the stenotic and normal levels. For the rest metrics, no significant differences were detected. Among all metrics, Viso shows the strongest capability to differentiate the stenotic and normal levels, suggesting that the spinal cord at the stenotic level may have more freely-diffused components. The decreased OD in GM at the stenotic level indicates that the neurite in GM tends to be aligned because of compression. It should be noted that Vic does not show significant differences in any ROIs.
Conclusion
In this study, an advanced diffusion model, NODDI was used to investigate the microstructural feature of spinal cord for postoperative CSM patients. Statistical results reveal that OD of grey matter is lower at the stenotic level than the normal level, and Viso in both grey and white matter is higher.
To the best of our knowledge, this is the first time that the application of NODDI in the spinal cord disease was reported. Further investigation on the correlation between NODDI metrics and clinical scores (e.g., JOA) is warranted to clarify their diagnostic ability, with more patients recruited.
Acknowledgements
No acknowledgement found.References
[1] Demir A, Ries M, Moonen CT, et al. Diffusion-weighted MR imaging with apparent diffusion coefficient and apparent diffusion tensor maps in cervical spondylotic myelopathy. Radiology 2003;229(1):37-43.
[2] Wen, C. Y., Cui, J. L., Liu, H. S., Mak, K. C., Cheung, W. Y., Luk, K. D. K., & Hu, Y. (2014). Is diffusion anisotropy a biomarker for disease severity and surgical prognosis of cervical spondylotic myelopathy? Radiology, 270(1), 197–204.
[3] Vedantam, A., Rao, A., Kurpad, S. N., Jirjis, M. B., Eckardt, G., Schmit, B. D., & Wang, M. C. (2016). Diffusion Tensor Imaging Correlates with Short-Term Myelopathy Outcome in Patients with Cervical Spondylotic Myelopathy. World Neurosurgery. http://doi.org/10.1016/j.wneu.2016.03.075
[4] Zhang, H., Schneider, T., Wheeler-Kingshott, C. a., & Alexander, D. C. (2012). NODDI: Practical in vivo neurite orientation dispersion and density imaging of the human brain. NeuroImage, 61(4), 1000–1016.
[5] Grussu, F., Schneider, T., Zhang, H., Alexander, D. C., & Wheeler-Kingshott, C. a M. (2015). Neurite orientation dispersion and density imaging of the healthy cervical spinal cord in vivo. NeuroImage, 111, 590–601.
[6] De Leener, B., Lévy, S., Dupont, S. M., Fonov, V. S., Stikov, N., Louis Collins, D., Cohen-Adad, J. (2016). SCT: Spinal Cord Toolbox, an open-source software for processing spinal cord MRI data. NeuroImage. http://doi.org/10.1016/j.neuroimage.2016.10.009
[7] M. Jenkinson et al., “FSL.” Neuroimage 62(2), 782–790 (2012)
Figures