1748
Monoexponential, Biexponential, and Stretched exponential Diffusion-weighted Imaging Models: Quantitative Biomarkers for Differentiating Renal Clear Cell Carcinoma and Minimal Fat Angiomyolipoma1Radiology, Tongji Hospital, Tongji Medical College, Huazhong University of Science and Technology, Wu Han, People's Republic of China
Synopsis
Compared to monoexponential DWI model, biexponential and stretched exponential DWI models are feasible and useful in the noninvasive tissue characterization of renal tumors. Water molecular diffusion heterogeneity index (α) and Dt may provide additional information and could lead to improved differentiation with better sensitivity and specificity in differencing MFAML from ccRCC compared with mean ADC, Dp, fp, and DDC values in clinical setting.
Purpose:
To determine the utility of various diffusion parameters obtained from monoexponential, biexponential, and stretched exponential Diffusion-weighted imaging models in differentiating between Minimal Fat Angiomyolipoma (MFAML) and clear cMaterials and Methods:ll Renal Cell Carcinoma (ccRCC).
Introduction:
DWI has been shown to be useful in the functional evaluation of renal tumors, allowing a noninvasive means of tumor characterization [1]. Compared to monoexponential DWI model, biexponential and stretched exponential models might demonstrate various aspects of tissue properties and provide more accurate information about water diffusion [2]. The purpose of this study was to evaluate the potential clinical value of various exponential DWI models in differentiating MFAML from ccRCC.Materials and Methods:
One hundred and thirty-one patients with pathologically confirmed MFAML (n=27) or ccRCC(n=104) underwent multi-b values DWI(0~1700 sec/mm2)imaging at 3.0T MRI. An isotropic apparent diffusion coefficient (ADC) was calculated from diffusion-weighted images by using a monoexponential model. A pseudo-ADC (Dp), true ADC (Dt), and perfusion fraction (fp) were calculated from diffusion-weighted images by using a biexponential model. A water molecular diffusion heterogeneity index (α) and distributed diffusion coefficient (DDC) were calculated from diffusion-weighted images by using a stretched exponential model. Student’s t test and Receiver operating characteristic were used for statistical evaluations.Results:
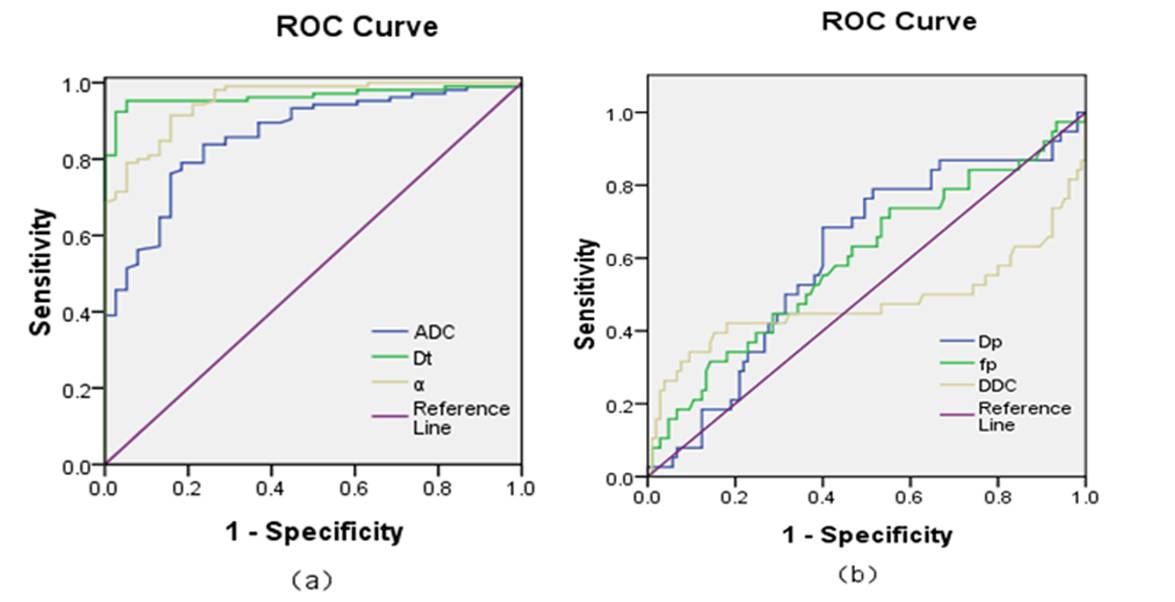
ADC, Dt, α values were significantly lower in the MFAML group than in the ccRCC group (P <0.001) (Fig. 1). Dp, fp, and DDC values were slightly higher in the MFAML group (Fig. 2) than in the ccRCC group (Fig. 3), however, the difference was not significant (P=0.136, 0.090, and 0.424, respectively). The AUC values for both α (0.953) and Dt (0.964) were significantly higher than those for ADC (0860), Dp (0.605), fp (0.596), and DDC (0.477) in the differentiation of MFAML from ccRCC (P<0.001) (Fig. 4).Discussion and conclusion:
In this study, the preliminary date from our study demonstrate that biexponential and stretched exponential DWI models are feasible and useful in the noninvasive tissue characterization of renal tumors. Water molecular diffusion heterogeneity index (α) and Dt may provide additional information and could lead to improved differentiation with better sensitivity and specificity in differencing MFAML from ccRCC compared with mean ADC, Dp, fp, and DDC values in clinical setting.Acknowledgements
No acknowledgement found.References
[1] Wang H. et al. Radiology. 2010; [2] Gaing B. et al. Invest Radiol. 2015.Figures
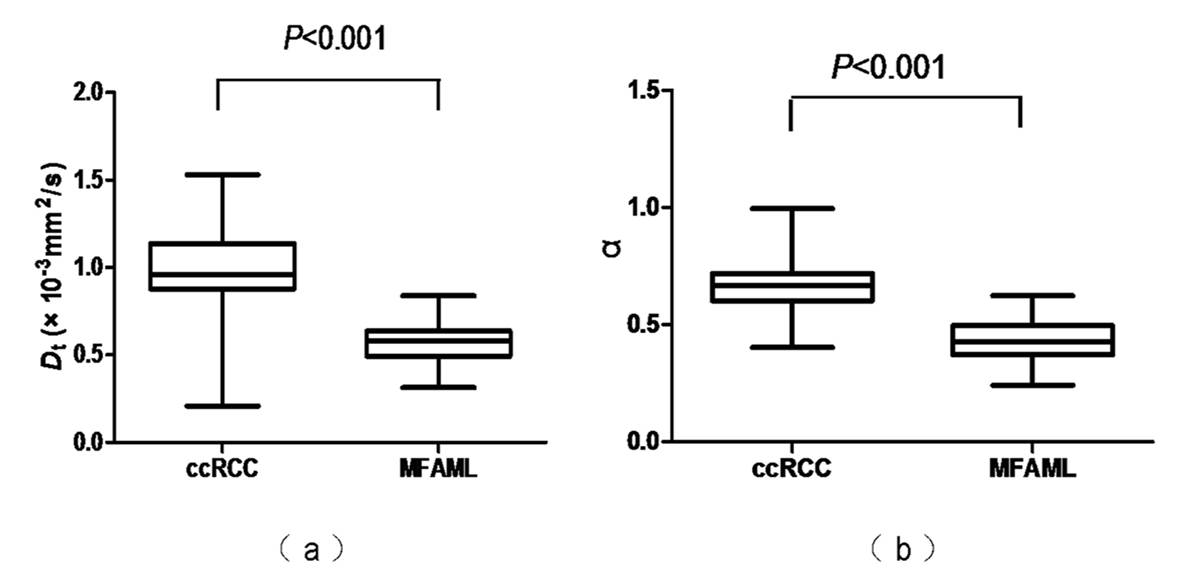
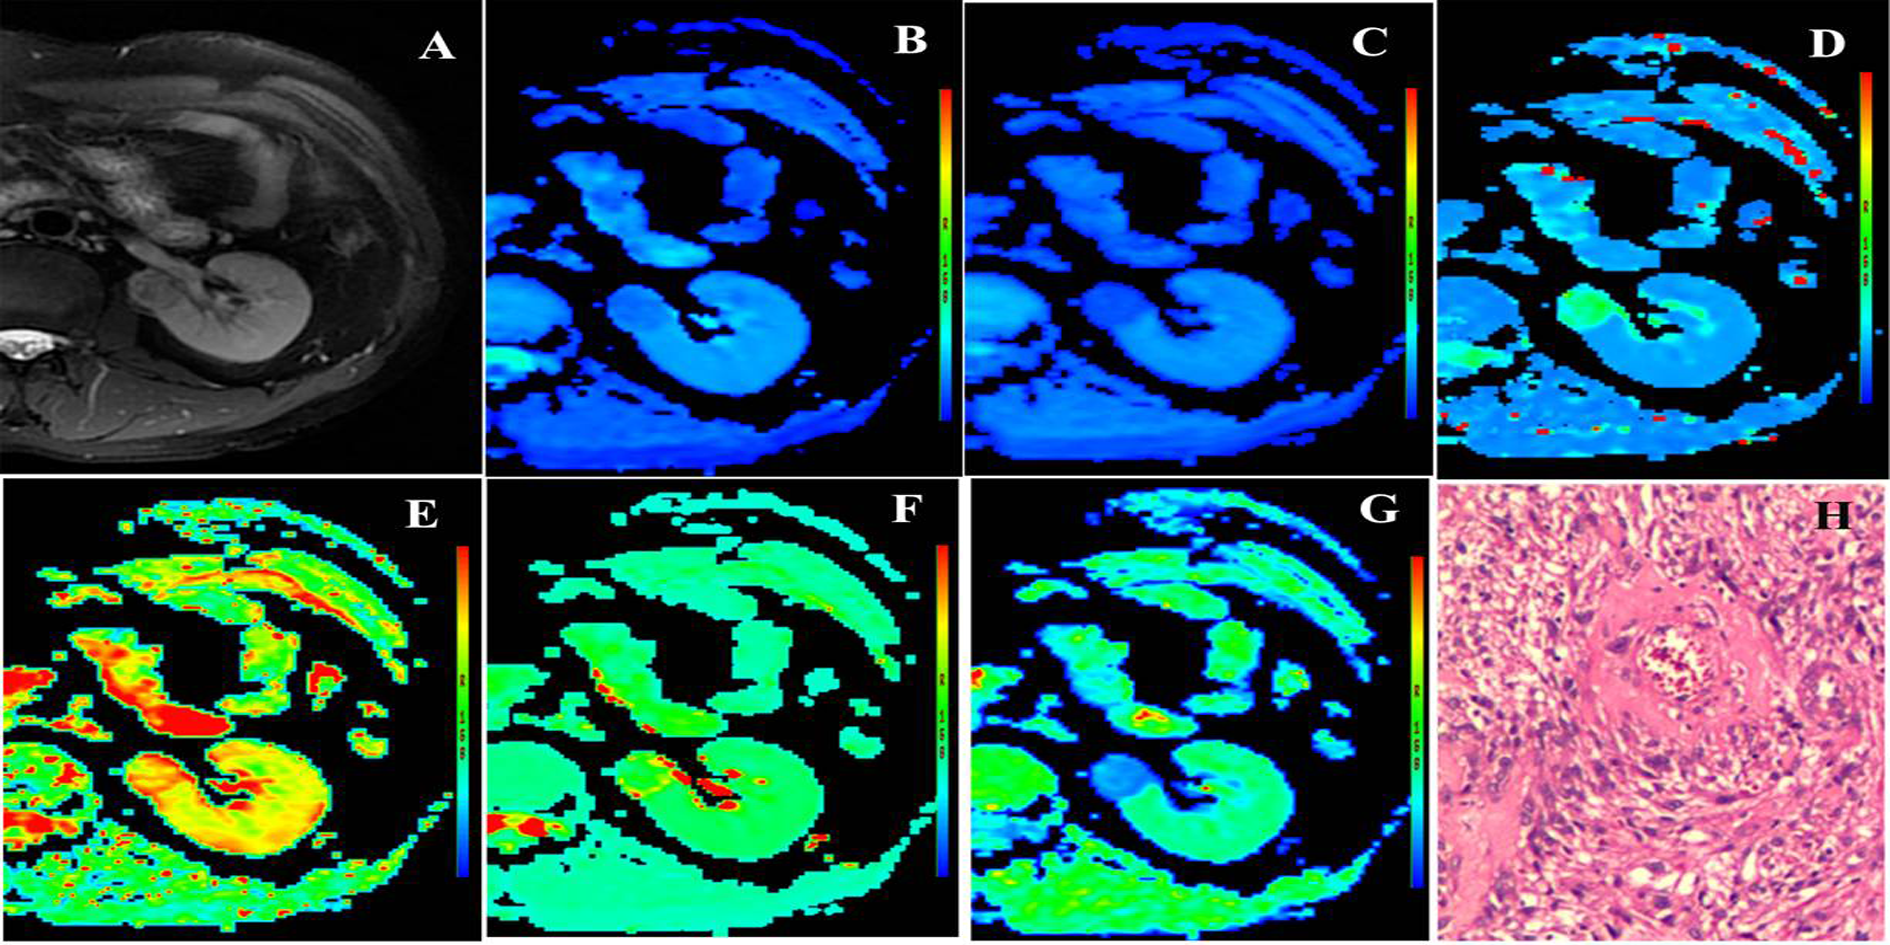
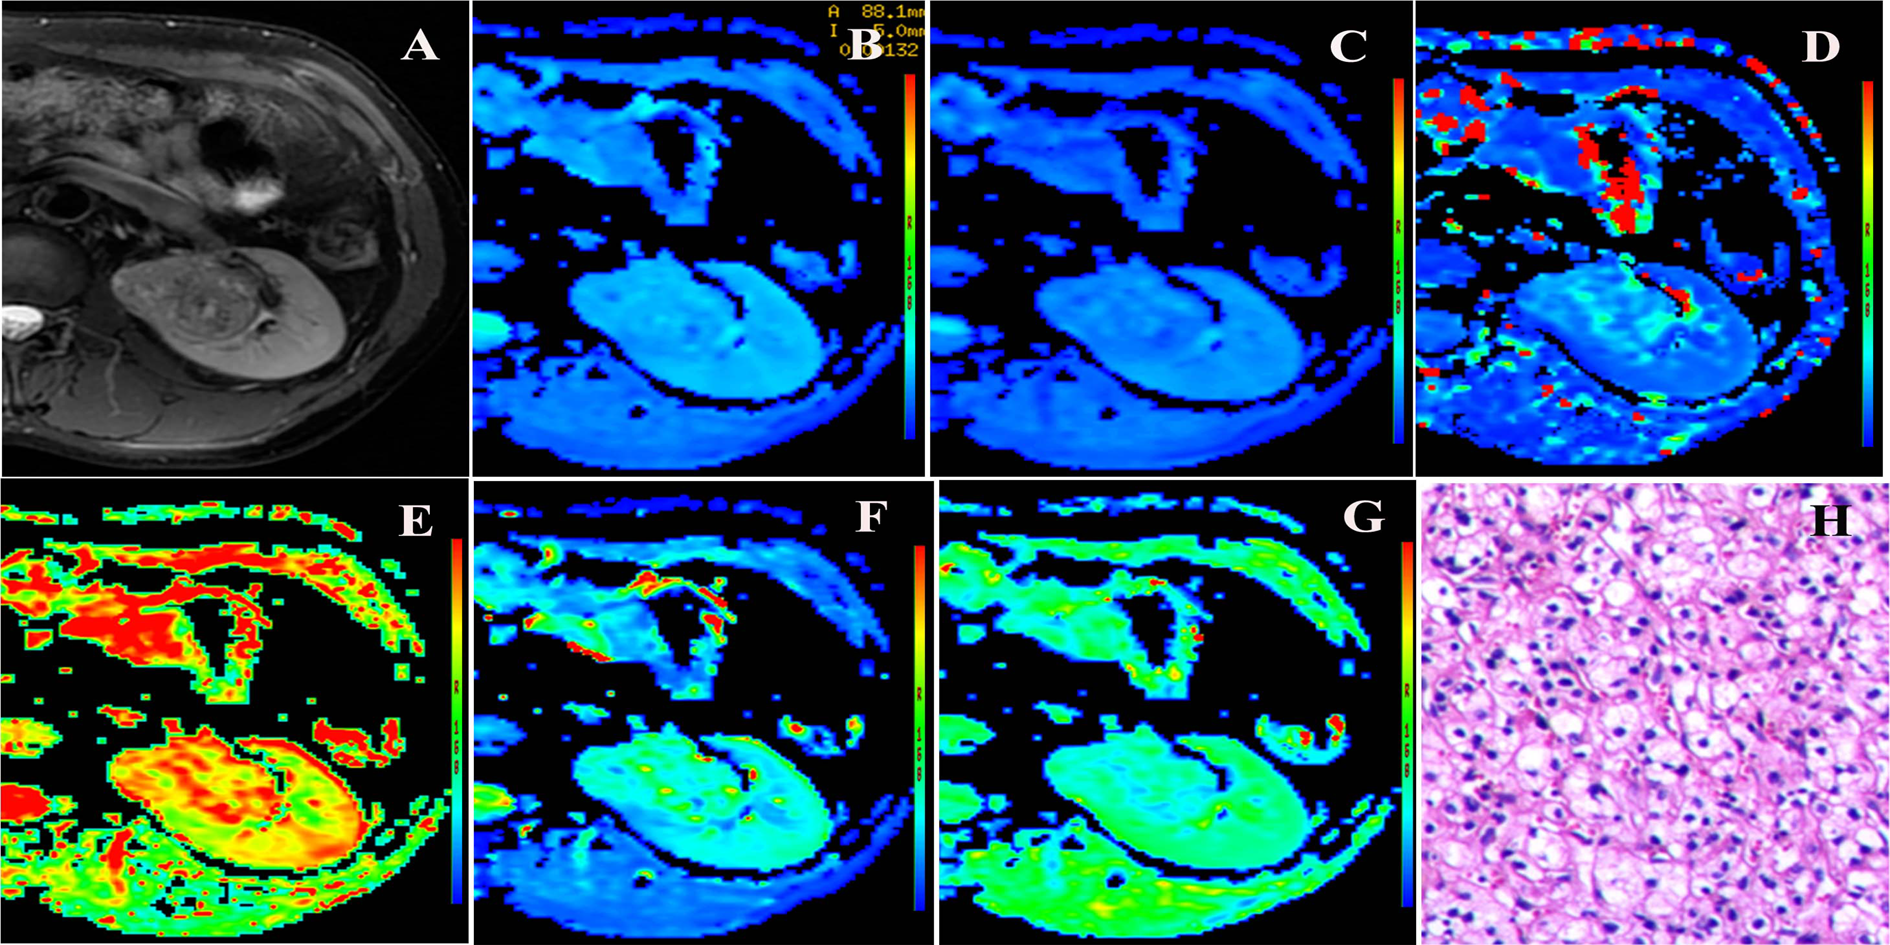
Fig. 2 Representative images of MFAML. Images A to G are axial T2-weighted images, ADC, Dt, Dp, fp, DDC and α maps, respectively. The ADC, Dt, Dp, fp, DDC and α values of the lesion were 1.08×10⁻³ mm2/s, 0.61×10⁻³ mm2/s, 38.7×10⁻³ mm2/s, 0.43, 1.95×10⁻³ mm2/s, and 0.43, respectively. Image H: Photomicrograph shows variable proportions of smooth muscle cells, blood vessels, and adipose tissues.