1746
Empirical reproducibility of clinically feasible ensemble average propagator imaging1Biomedical Engineering, Vanderbilt University, Nashville, TN, United States, 2Computer Science, Vanderbilt University
Synopsis
In this study, we measure the reproducibility of metrics derived from the ensemble averaged propagator (EAP) estimated using the 3D-SHORE technique using a clinically feasible high angular resolution diffusion dataset repeated 11 times on a single subject. We find very low reproducibility in measures of microstructural restriction (including the mean-squared displacement and return to origin probability) as well as measures of the orientation distribution function (including peaks of the ODF). This study highlights the limitations of using advanced models with empirical data, particularly in the low-SNR regime.
PURPOSE:
Diffusion-weighted (DW) magnetic resonance signals reflect information regarding the underlying tissue microenvironment. With the increasing prevalence of high angular resolution diffusion imaging (HARDI) protocols with multiple diffusion weightings, it is possible to characterize both the angular and radial structure of diffusion by recovering the 3D ensemble average propagator (EAP). While much is known about the methods to approximate the EAP through both theory and simulations [1, 2], little is known about the reproducibility of the EAP, particularly in the clinical settings where the number of DW images is limited and SNR is low. In this study, we investigate the reproducibility of measures derived from the EAP that characterize both microstructure dimensions and size, as well as tissue orientation.METHODS:
Acquisition: One healthy subject was imaged on a 3T Phillips Achieva Scanner in three different scan sessions on three consecutive days. The scanning protocol consisted of five diffusion shells (b-values of 1000, 1500, 2000, 2500, and 3000 s/mm2) with 96 DW directions each. The data was acquired at 2.5mm isotropic resolution, with a matrix of 96 x 96 x 38 slices, using a DW PGSE-EPI sequence. This protocol was repeated four times on days 1 and 2, and three times on day 3, resulting in a total of 11 repeats of each diffusion shell. For each set of 5 shells, an additional “b0” was acquired with reverse phase encoded volumes to be used for susceptibility distortion and eddy current correction.
EAP Processing: We model the diffusion signal using the 3D Simple Harmonic Oscillator based Reconstruction and Estimation (3D SHORE) [2, 3]. Orientation features of the EAP are extracted, including the ODF and local maxima of the ODF, and microstructure related indices are extracted including the return to origin probability (RTO) and mean squared displacement (MSD). These indices reflect the degree of restriction of water molecules and have been directly linked to compartment size and shapes [3, 4].
Reproducibility: The voxel-wise mean and standard deviation of RTO and MSD are calculated across all 11 repeat scans, followed by calculation of the coefficient of variation (CV). To assess reproducibility of the ODF, the Jensen-Shannon Divergence (JSD) is calculated (as in [5]), which measures similarity of probability distributions. Finally, the angular variation of the primary (AV1) and secondary (AV2) peaks of the ODF are computed [6]. In addition to voxel-wise metrics, the average value within 5 ROIs are calculated. White matter ROI include the splenium of the corpus callosum (SCC), the internal capsule (IC), and the centrum semiovale (CS). Gray matter (GM) structures include the sub-cortical globus pallidus (GP) in addition to the precentral gyrus (PCG) of the cerebral cortex.
RESULTS:
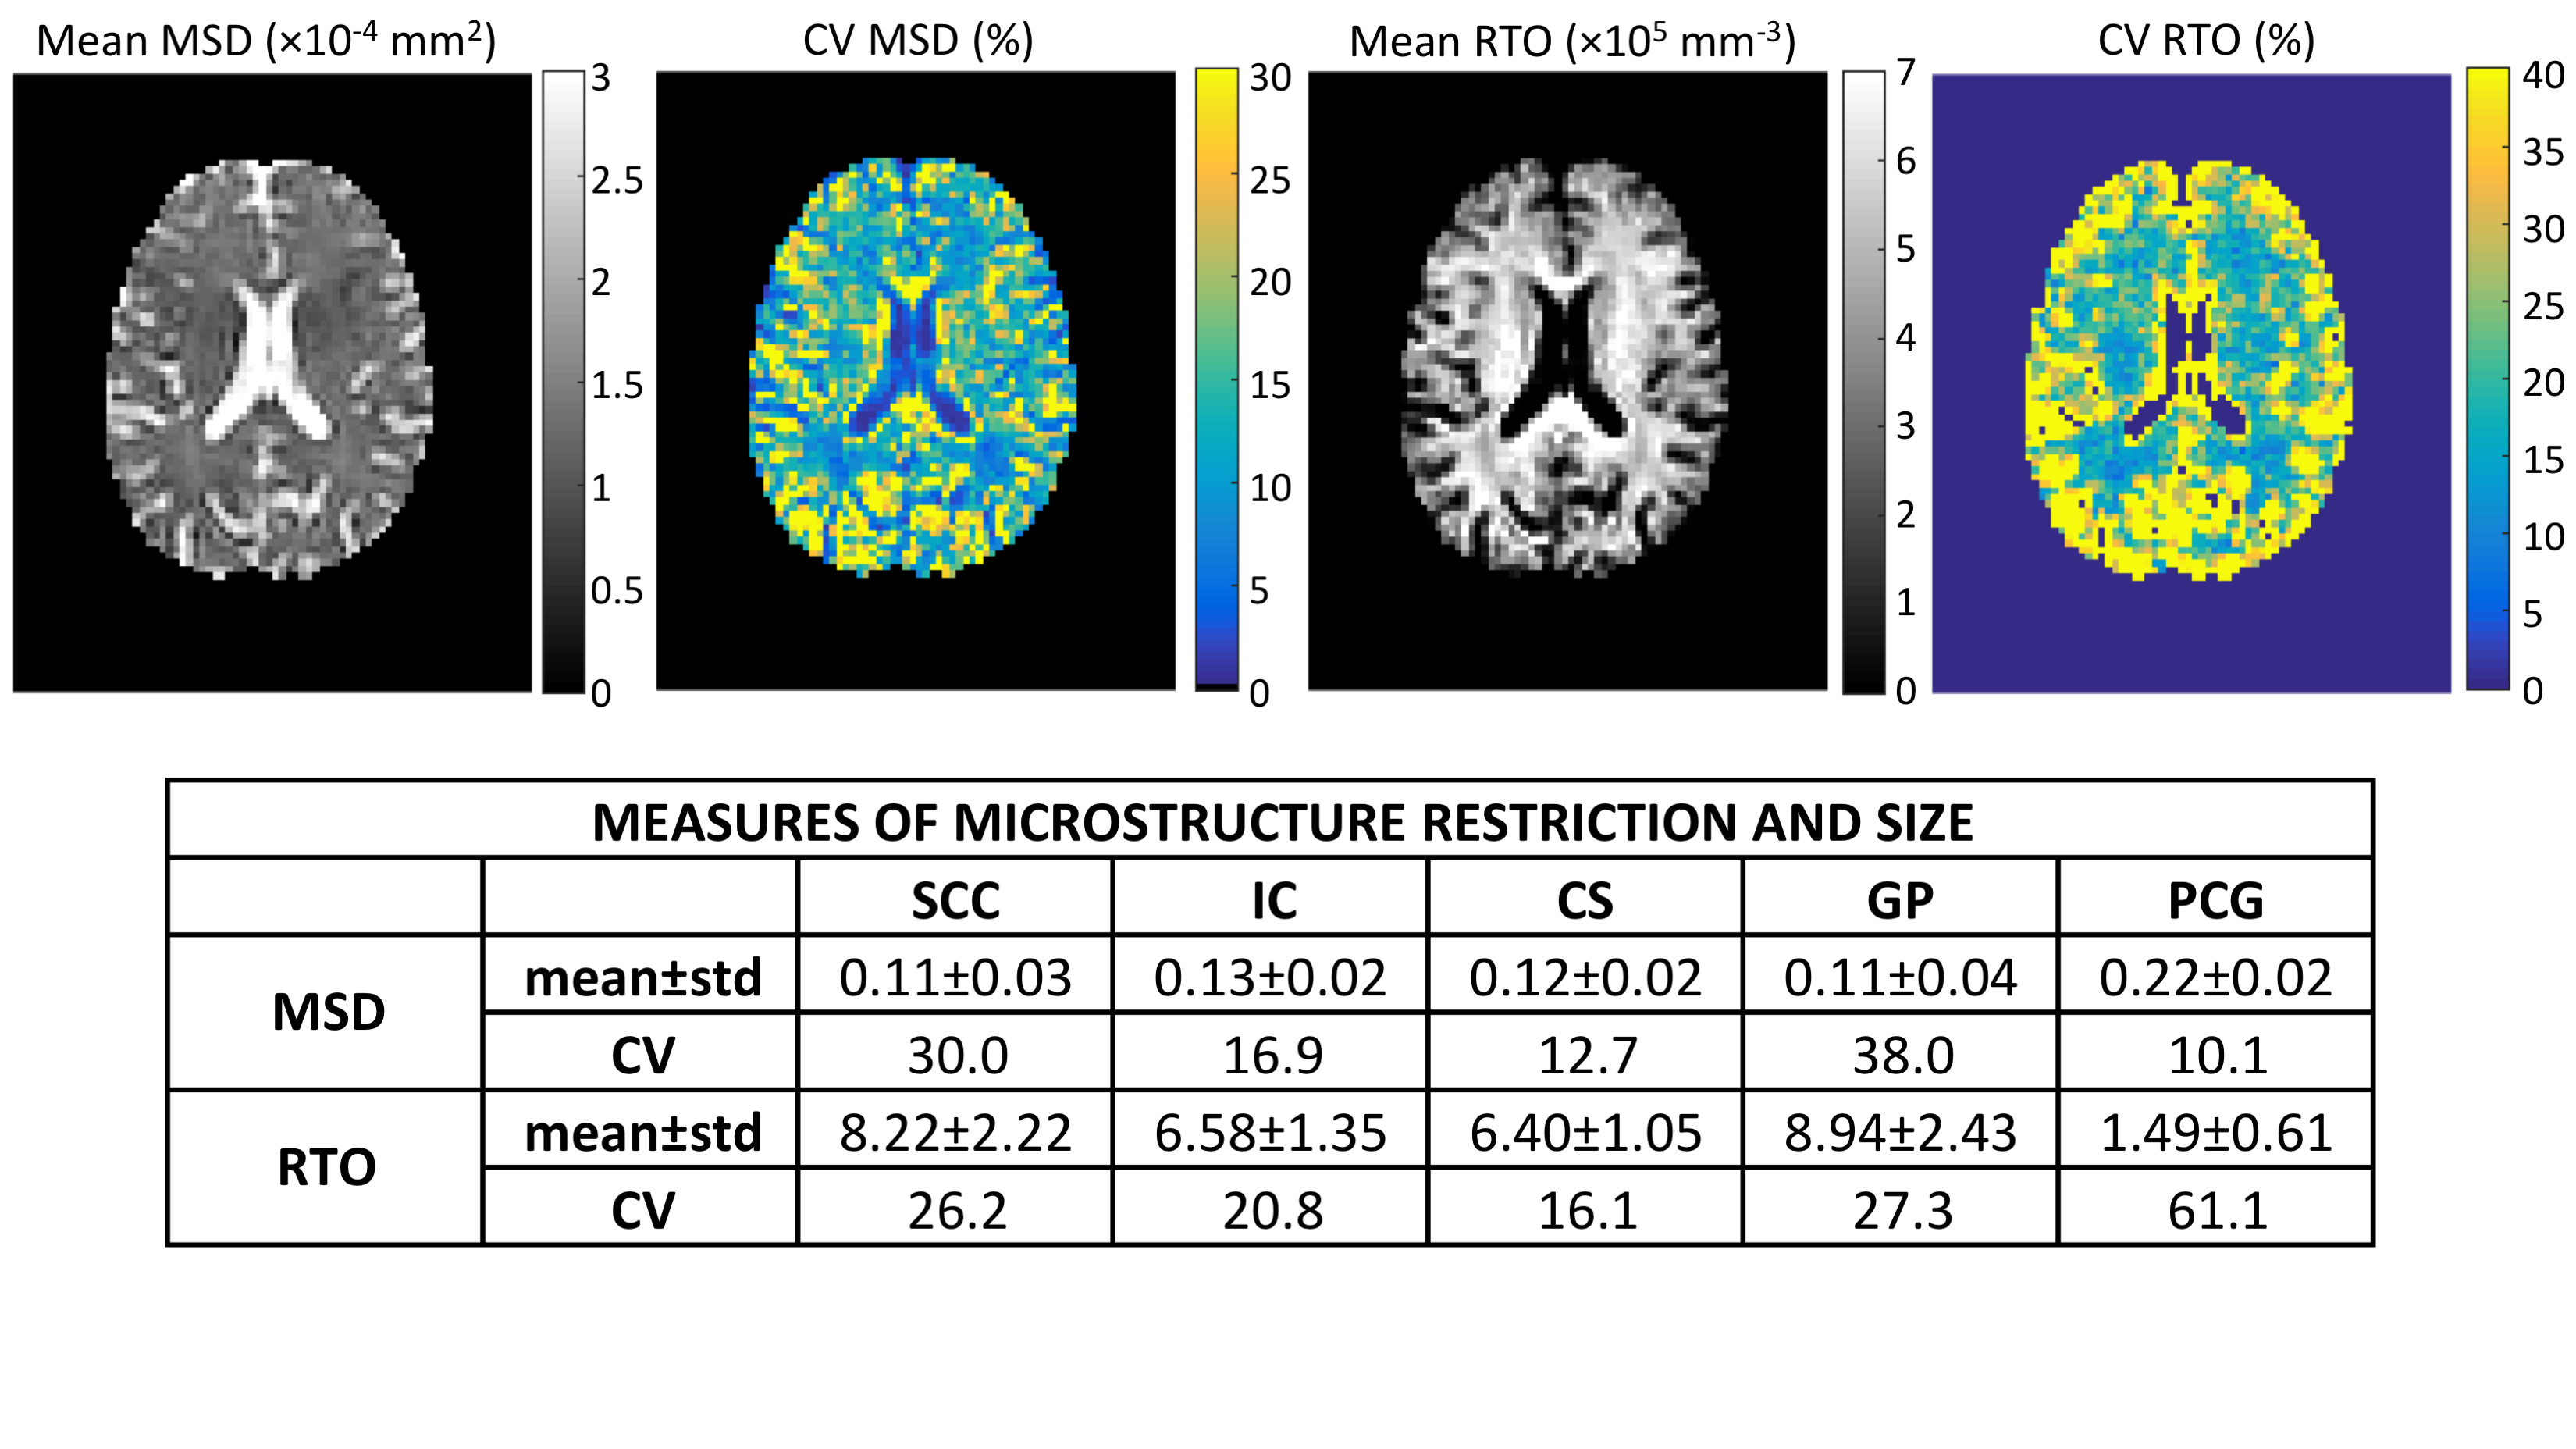
Figure 1 shows reproducibility results for the measures MSD and RTO across 11 repeats. Maps of mean and CV of the measures are shown on top, in addition to ROI-averaged mean, standard deviation, and CV in table form below. The CV for both measures is >10% in all cases (indicating a low reproducibility), with particularly high CV in the SCC and GP.
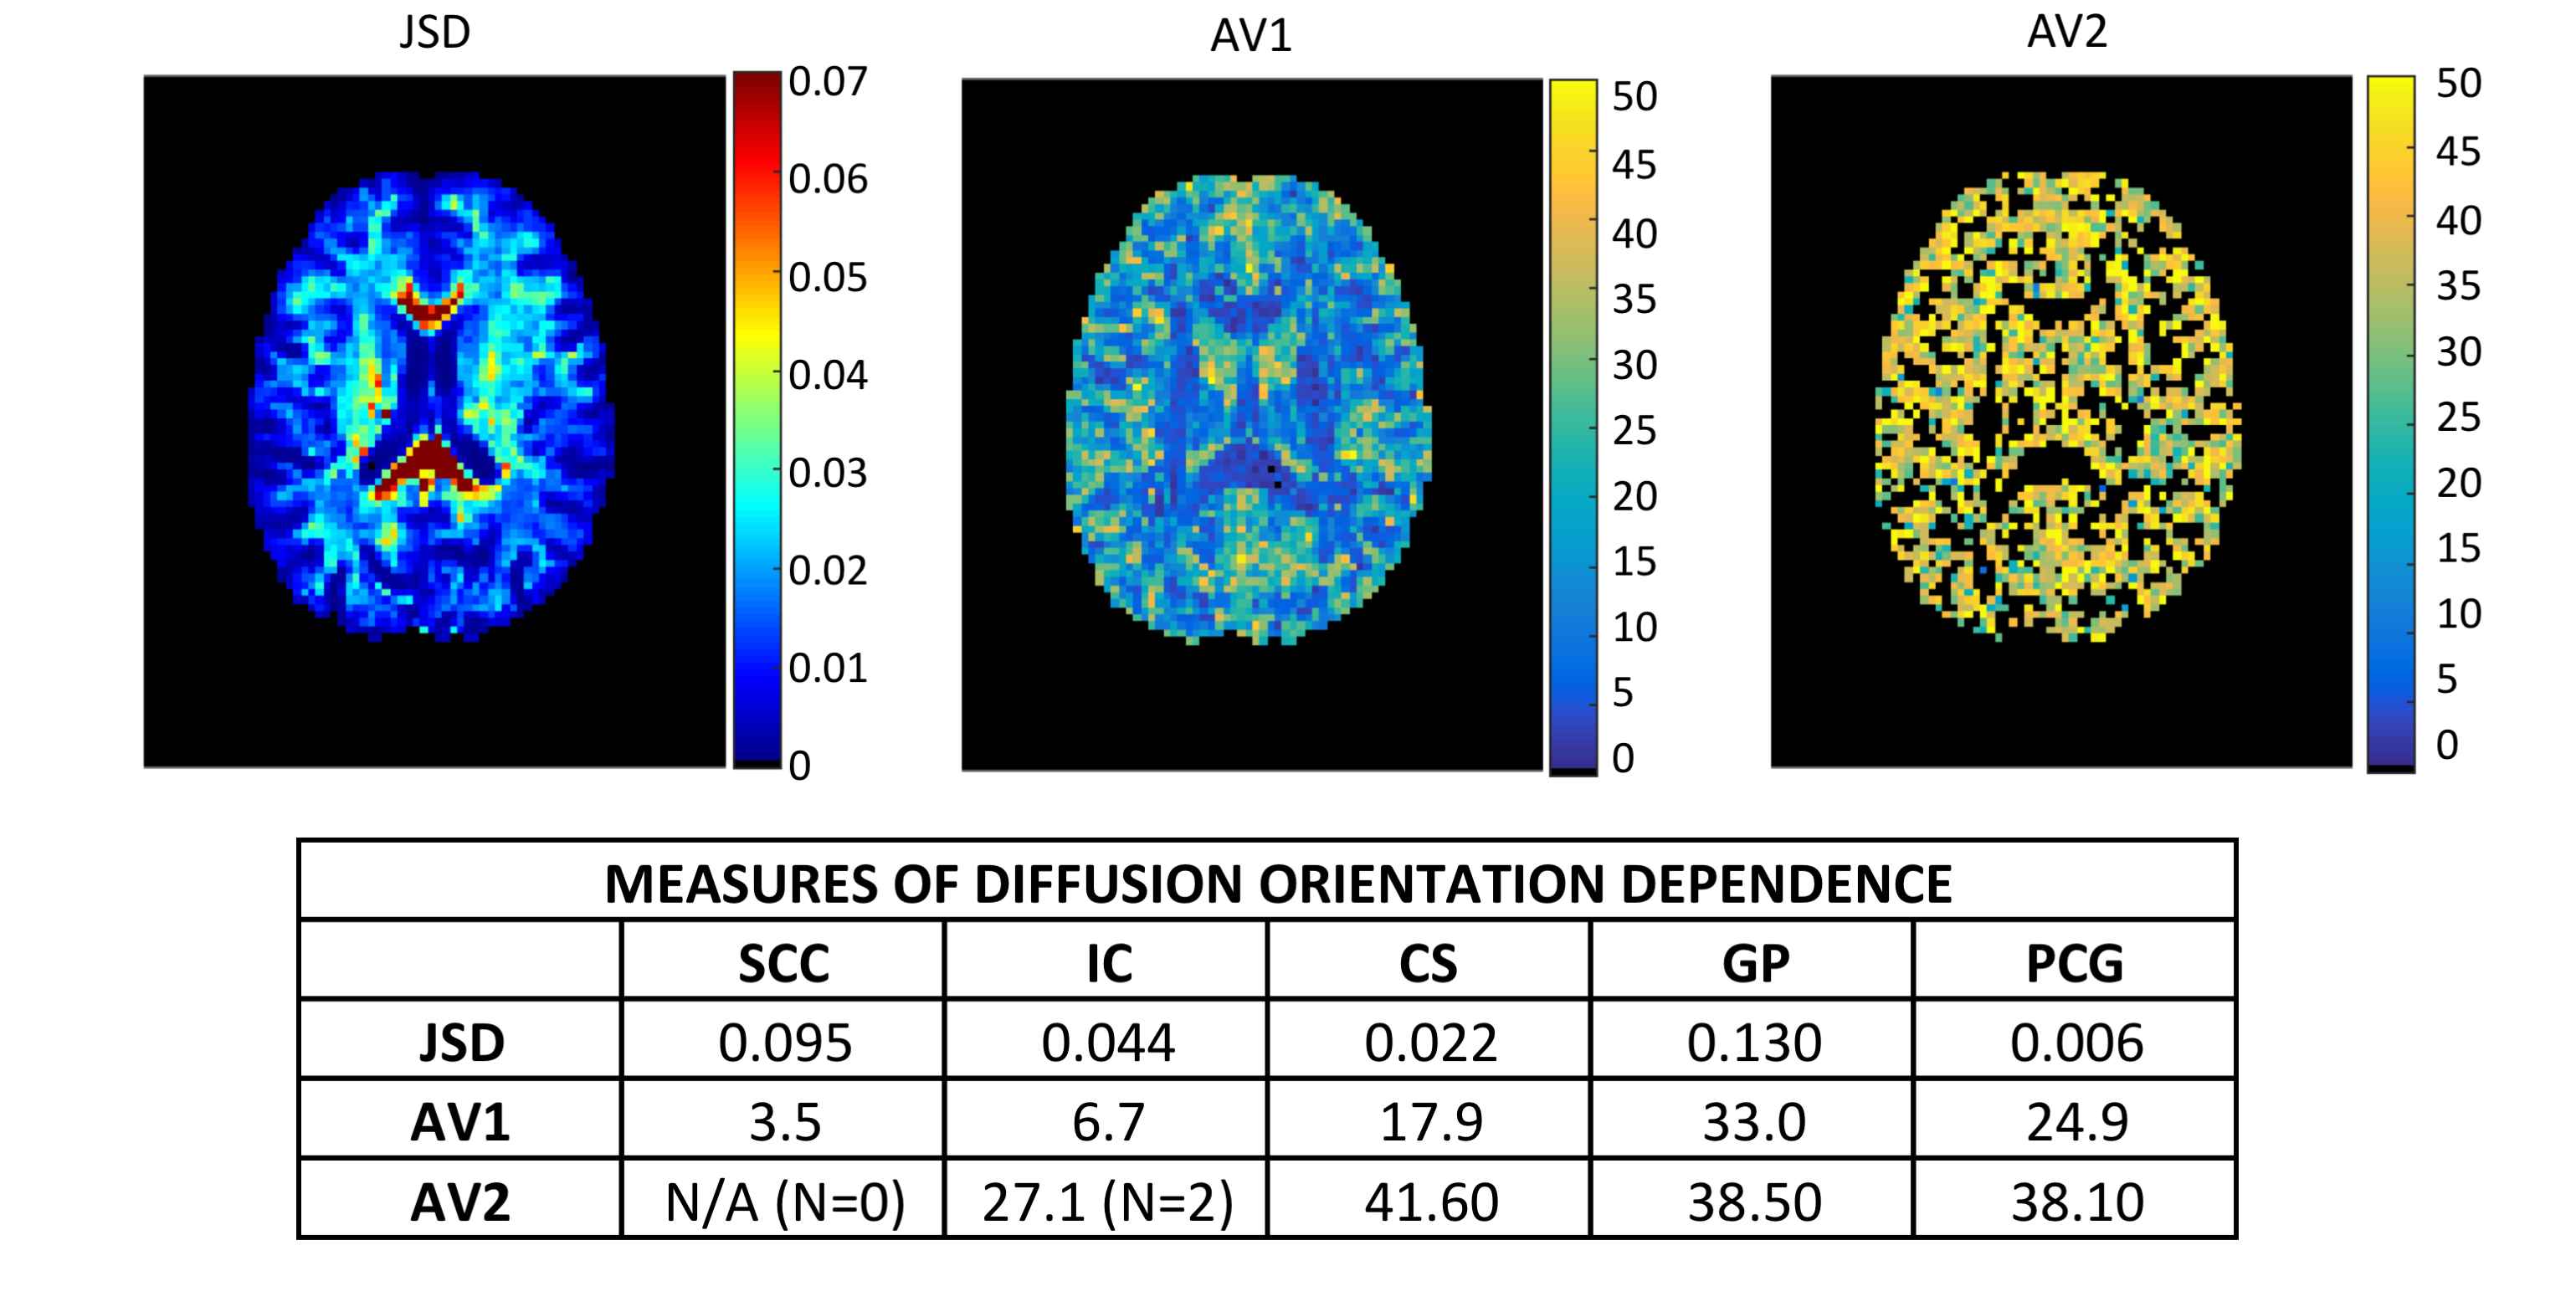
Figure 2 shows maps of JSD, AV1, and AV2 in a selected axial slice, in addition to the ROI-averaged metrics in table form. Again, the JSD is particularly high in the SCC and GP, and lower in the cortex. The AV1 is low in most WM regions (except the CS which contains multiple fiber populations), while the AV2 is consistently larger than 25°.
DISCUSSION:
On clinically realistic, low SNR datasets acquired in approximately 25 minutes, 3D SHORE measures of microstructure restriction and size show low reproducibility in both WM and GM regions. The primary diffusion orientation is generally reproducible in WM regions; however, the secondary diffusion direction is not reliably reproducible regardless of underlying microstructure. Future work should compare the derived values to the concatenation of all data on the single subject, as well as probe the effects of q-space sampling densities, maximum q-space, and angular resolution on the accuracy and precision of parameters.CONCLUSION:
This study highlights the limitations of using advanced models with empirical data. While significant progress has been made in modeling the three-dimensional EAP from the diffusion signal, care must be taken in interpreting measures made on low-SNR data, even with acquisitions including ~480 DW measurements.Acknowledgements
This work was supported by the National Institutes of Health under award numbers R01EB017230 (Landman) and R01NS058639 (Anderson). This work was conducted in part using the resources of the Advanced Computing Center for Research and Education at Vanderbilt University, Nashville, TN.References
1. Cheng J, Jiang T, Deriche R. Nonnegative definite EAP and ODF estimation via a unified multi-shell HARDI reconstruction. Med Image Comput Comput Assist Interv. 2012;15(Pt 2):313-21. PubMed PMID: 23286063. 2. Merlet SL, Deriche R. Continuous diffusion signal, EAP and ODF estimation via Compressive Sensing in diffusion MRI. Med Image Anal. 2013;17(5):556-72. doi: 10.1016/j.media.2013.02.010. PubMed PMID: 23602920. 3. Ozarslan E, Koay CG, Shepherd TM, Komlosh ME, Irfanoglu MO, Pierpaoli C, et al. Mean apparent propagator (MAP) MRI: a novel diffusion imaging method for mapping tissue microstructure. NeuroImage. 2013;78:16-32. doi: 10.1016/j.neuroimage.2013.04.016. PubMed PMID: 23587694; PubMed Central PMCID: PMCPMC4059870. 4. Zucchelli M, Brusini L, Andres Mendez C, Daducci A, Granziera C, Menegaz G. What lies beneath? Diffusion EAP-based study of brain tissue microstructure. Med Image Anal. 2016;32:145-56. doi: 10.1016/j.media.2016.03.008. PubMed PMID: 27086167. 5. Cohen-Adad J, Descoteaux M, Wald LL. Quality assessment of high angular resolution diffusion imaging data using bootstrap on Q-ball reconstruction. Journal of magnetic resonance imaging : JMRI. 2011;33(5):1194-208. doi: 10.1002/jmri.22535. PubMed PMID: 21509879; PubMed Central PMCID: PMCPMC3087444. 6. Farrell JA, Landman BA, Jones CK, Smith SA, Prince JL, van Zijl PC, et al. Effects of signal-to-noise ratio on the accuracy and reproducibility of diffusion tensor imaging-derived fractional anisotropy, mean diffusivity, and principal eigenvector measurements at 1.5 T. Journal of magnetic resonance imaging : JMRI. 2007;26(3):756-67. Epub 2007/08/31. doi: 10.1002/jmri.21053. PubMed PMID: 17729339; PubMed Central PMCID: PMCPmc2862967.Figures