1745
The Impact of Edema and Crossing Fibers on Diffusion MRI: ODF vs. DBSI1Chemistry, Washington University, St. Louis, MO, United States, 2Biology, Juniata College, Huntingdon, PA, United States, 3Center for Neuroimaging, Indiana University, Indianapolis, IN, United States, 4Center for Biomedical Imaging, Medical University of South Carolina, Charleston, SC, United States, 5Radiology and Radiological Science, Medical University of South Carolina, Charleston, SC, United States, 6Neurosciences, Medical University of South Carolina, Charleston, SC, United States, 7Biomedical Engineering, Carnegie Mellon University, Pittsburgh, PA, United States, 8Biomedical Engineering, Washington University, St. Louis, MO, United States, 9Radiology, Washington University, St. Louis, MO, United States, 10Hope Center for Neurological Disorder, Washington University, St. Louis, MO, United States
Synopsis
We quantitatively examined the effect of fiber crossing and edema on DTI metrics employing phantoms made of mouse trigeminal nerves and agarose gel. Edema mimicked by gel coating significantly impaired the accuracy of estimated crossing angles using the diffusion orientation distribution function. Diffusion basis spectrum imaging (DBSI) was able to estimate crossing angles in the presence of edema and recover individual nerve baseline diffusivity.
Introduction
Diffusion Tensor Imaging (DTI) has been widely employed in central nervous system (CNS) studies. DTI-derived axial and radial diffusivity reflects axonal and myelin injury in CNS white matter.1-3 However, confounding effects due to partial voluming, inflammation, axon, and myelin injury may alter the diffusion MRI signal and thus prohibit accurate assessment of the underlying white matter pathology by DTI. In this study, we quantitatively examined the effect of fiber crossing and edema on DTI metrics employing phantoms made of mouse trigeminal nerves and agarose gel. MR measurements were performed using various diffusion weighting schemes, including HYDI,4 LEMONADE,5 DBSI,6 and analyzed using generalized q-sampling imaging (GQI),7 Q-ball imaging,8 Diffusion Kurtosis Imaging (DKI),9,10 and DBSI.6Methods
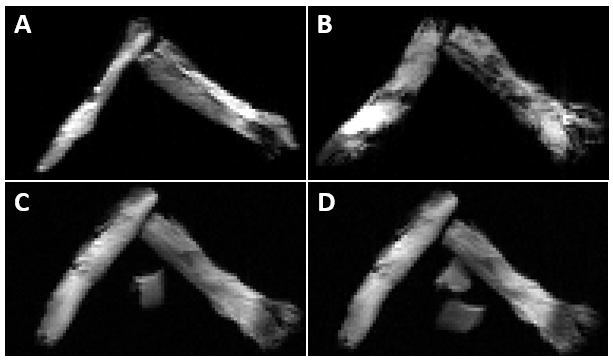
Sample preparation: Five female C57BL/6 mice were fixed and trigeminal nerves were extracted. To mimic crossing fibers of different sizes, two nerves juxtaposed tightly in parallel (forming the larger fiber) were aligned with a single nerve (Fig. 1) at various angles, i.e., 30, 60, and 90°. Edema was mimicked by coating nerves with various layers of 4% agarose gel, and including additional pieces juxtaposed to the nerve assembly.
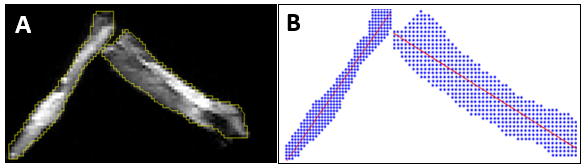
MR experiments and image analysis: Diffusion weighted MR was performed on a 4.7-T small animal Agilent DirectDrive scanner with a homemade surface coil (1-cm diameter). A multi-echo spin-echo diffusion weighted sequence was employed with the following diffusion weighting schemes: DBSI (99 diffusion encoding directions with max b-value = 3000 s/mm2); LEMONADE (325 directions with max b-value = 4000 s/mm2); and HYDI (143 directions with max b-value = 6000 s/mm2). DKI analysis was performed on LEMONADE dataset limited to b-value = 0, 1500, and 3000 s/mm2. GQI was performed on LEMONADE and HYDI data. Q-ball imaging was performed on the outer shell of the HYDI dataset. Individual nerves (nerve a, b, c, d, e and f in Table 1) were scanned and analyzed as the baseline for comparison. Proton density weighted image was obtained and used via linear regression to calculate crossing angles (Fig. 2) as the benchmark for angles obtained from DBSI, DKI, GQI and Q-Ball imaging. Diffusivity expressed as µm2/ms.
Results and Discussion
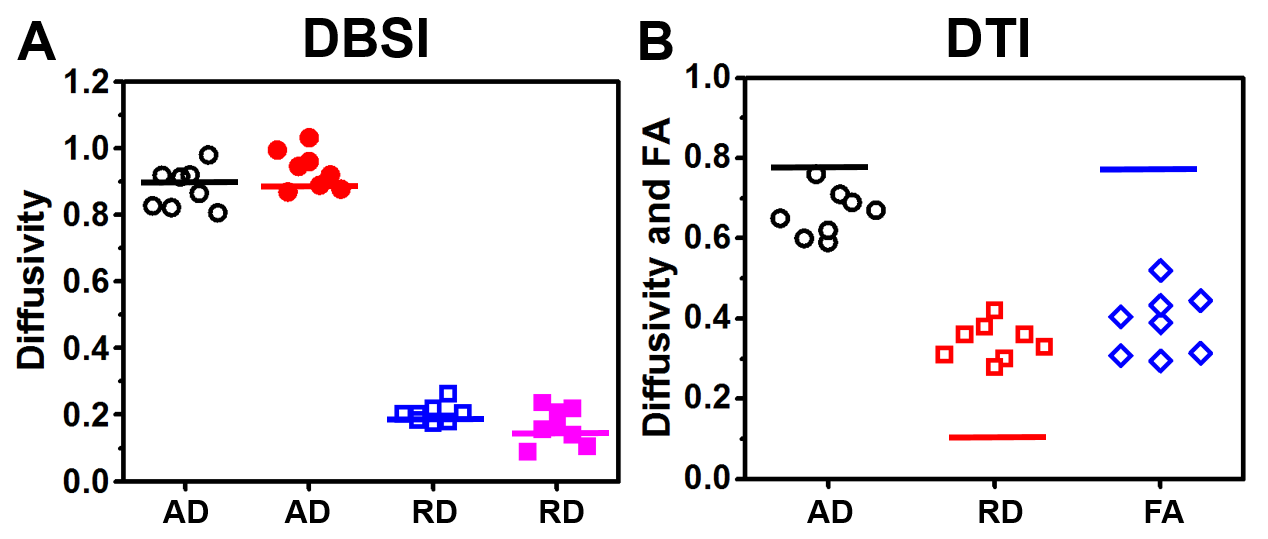
The DTI-derived axial diffusivity (AD), radial diffusivity (RD) and fractional anisotropy (FA) obtained from crossing fibers of all angles with and without gel were compared with the averaged baseline values of the nerve (Fig. 3): AD decreased (crossing vs. baseline: 0.66 ± 0.06 vs. 0.77), RD increased (0.34 ± 0.05 vs. 0.16) and FA decreased (0.39 ± 0.08 vs. 0.78). In contrast, DBSI estimated individual AD, RD, and FA (not shown) of individual component fibers closely recovered baseline values: AD (0.88 ± 0.06 vs. 0.90 and 0.94 ± 0.06 vs. 0.88), and RD (0.20 ± 0.03 vs 0.18 and 0.17 ± 0.05 vs 0.13). DKI, GQI and Q-ball imaging were not designed to estimate the diffusivity of individual fibers while resolving crossing angles. Thus, none of these methods were performed to estimate the impact of fiber crossing and edema on diffusivity. The diffusion orientation distribution function (dODF) is a widely employed method for resolving crossing fibers. DKI, GQI and Q-ball imaging all resolve fiber crossing using various forms of dODF analysis. Thus, we compared the crossing angles derived by DBSI (Fig. 4A), Q-ball imaging (Fig. 4B), DKI (Fig. 4C) and GQI (Fig. 4D). For 90-degree crossing with gel, DKI, Q-ball imaging, QGI, and DBSI all performed well. In nerve assembly of 60- and 40-degree crossing, DKI, Q-ball and GQI partially resolved angles with notably less accuracy than those obtained using DBSI.Conclusion
DBSI is able to recover individual fiber baseline diffusivity in gel-coated crossing nerves, in addition to its resolution of crossing fibers that accurately estimate crossing angles. Our results suggest that DBSI, without the use of high-b-value diffusion weighting, is sufficient to resolve crossing fibers and estimate diffusivity of individual component fibers.Acknowledgements
No acknowledgement found.References
1. Song SK, Sun SW, Ju WK, Lin SJ, Cross AH, Neufeld AH. Diffusion tensor imaging detects and differentiates axon and myelin degeneration in mouse optic nerve after retinal ischemia. NeuroImage. 2003;20(3):1714-1722.
2. Song SK, Sun SW, Ramsbottom MJ, Chang C, Russell J, Cross AH. Dysmyelination revealed through MRI as increased radial (but unchanged axial) diffusion of water. NeuroImage. 2002;17(3):1429-1436.
3. Song SK, Yoshino J, Le TQ, et al. Demyelination increases radial diffusivity in corpus callosum of mouse brain. NeuroImage. 2005;26(1):132-140.
4. Wu YC, Alexander AL. Hybrid diffusion imaging. NeuroImage. Jul 1 2007;36(3):617-629.
5. Dimitry S. Novikov IOJ, Els Fieremans. From diffusion signal moments to neurite diffusivities, volume fraction and orientation distribution: An exact solution. Paper presented at: Proccedings of International Society for Magnetic Resonance in Medincine2015.
6. Wang Y, Wang Q, Haldar JP, et al. Quantification of increased cellularity during inflammatory demyelination. Brain : a journal of neurology. Dec 2011;134(Pt 12):3590-3601.
7. Yeh FC, Wedeen VJ, Tseng WY. Generalized q-sampling imaging. IEEE transactions on medical imaging. Sep 2010;29(9):1626-1635.
8. Tuch DS. Q-ball imaging. Magnetic resonance in medicine. Dec 2004;52(6):1358-1372.
9. Glenn GR, Helpern JA, Tabesh A, Jensen JH. Optimization of white matter fiber tractography with diffusional kurtosis imaging. NMR in biomedicine. Oct 2015;28(10):1245-1256.
10. Jensen JH, Helpern JA, Tabesh A. Leading non-Gaussian corrections for diffusion orientation distribution function. NMR in biomedicine. Feb 2014;27(2):202-211.
Figures