1740
Simulating measurements of diffusion across the cell membrane with DEXSY and FEXSY1Centre for Advanced Biomedical Imaging, Division of Medicine, UCL, London, United Kingdom, 2Microstructure Imaging Group, Centre for Medical Image Computing, UCL, London, United Kingdom, 3Sir Francis CRICK Institute
Synopsis
Here, we use numerical simulations to demonstrate the feasibility of measuring diffusion exchange across the cell membrane using DEXSY (Diffusion Exchange spectroscopy) and compare it with FEXSY (Filter Exchange Spectroscopy). Simulations were carried out using the CAMINO platform, for a range of permeabilities, in a substrate chosen to model nerve tissue. The results of these simulations suggest that both DEXSY and FEXSY are capable of measuring diffusion exchange, over a physiologically meaningful range of permeabilities, and an extended range of permeabilities (0.365 to 2.008 µm/s). These results demonstrate the potential for these techniques to be used to differentiate pathology from normal tissue.
Purpose:
In this study, we use numerical simulations to assess the feasibility of using DEXSY (Diffusion Exchange Spectroscopy)[1] to measure diffusion exchange across the cell membrane, and compare the results with corresponding simulations for FEXSY (Filter Exchange Spectroscopy) [2]. Both techniques use double diffusion encoding to examine diffusion exchange. FEXSY uses a limited two compartment model of diffusion exchange, while work by Pangiotaki et al, suggests model selection favours three compartment models[3]. In DEXSY a comprehensive measurement of diffusion exchange is made using a lengthy acquisition consisting of a number of diffusion encoding steps[1].Methods:
Two simulations were carried out: one to assess the performance of the two techniques within a physiological range of permeabilities, and one to determine the range of permeabilities over which they can reasonably be used. A gamma distribution of cylinder radii was used to mimic bundles of nerve cells, with a shape parameter of 5.3316 and a scale parameter of 1.0242x10⁻⁷. 100 cylinders and a lattice size of 1.65x10⁻⁵ m were generated. These parameters were previously used by Alexander et al.[4][5] to simulate diffusion MRI measurements of the corpus callosum. MCMC simulations were performed using CAMINO[5] with 100,000 walkers, a total duration of 0.4 s, diffusivity of 2.0x10⁻⁹ m-2/s and 16,000 time steps. The probability of a walker crossing the cell membrane was set to p=0, 2.74x10⁻⁴, 3.035x10⁻⁴, and 3.83x10⁻⁴ (corresponding to a permeability of 0 µm/s, 1.0 µm/s, 1.2 µm/s and 1.4 µm/s, covering a typical physiological range)[6], for the first simulation. For the second simulation, 25 permeabilities were simulated, varying p between 0 and 0.1. The simulated DEXSY acquisition parameters were δ = 15 ms, Δ = 17 ms with a mixing time of tm = 0.1 s. Both pairs of diffusion encoding gradients were set to vary between 0-900 mT/m in 16, even increments. A DOSY[7] (Diffusion Ordered Spectroscopy) acquisition was also simulated in order to validate the diffusion measurements made by DEXSY, with δ = 15 ms, Δ = 17 ms and diffusion encoding gradients set to vary between 0-900 mT/m in 256 even increments. Finally, a FEXSY acquisition was simulated with δ = 15 ms, Δ = 17 ms, filter gradient strength of 68 mT/m and an encoding strength varying between 0-68 mT/m in 9 increments with tm = 0, 0.01, 0.1, 0.2, 0.3. All of the gradients were perpendicular to the cylinders. The results of the DEXSY and DOSY simulations were inverse Laplace transformed to give diffusion-diffusion exchange plots and diffusion spectra using software developed by P.T. Callaghan [1]. FEXSY simulation were processed to produce AXR parameter (apparent exchange rate) after the method of Åslund et al[2].Results:
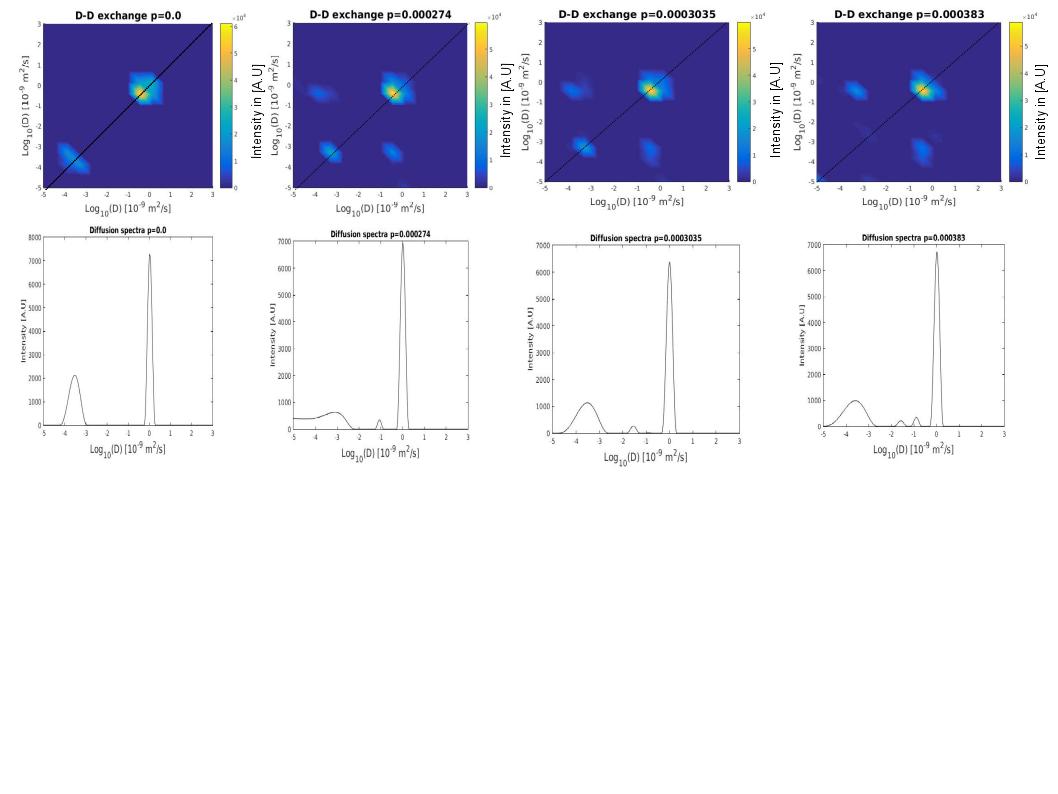
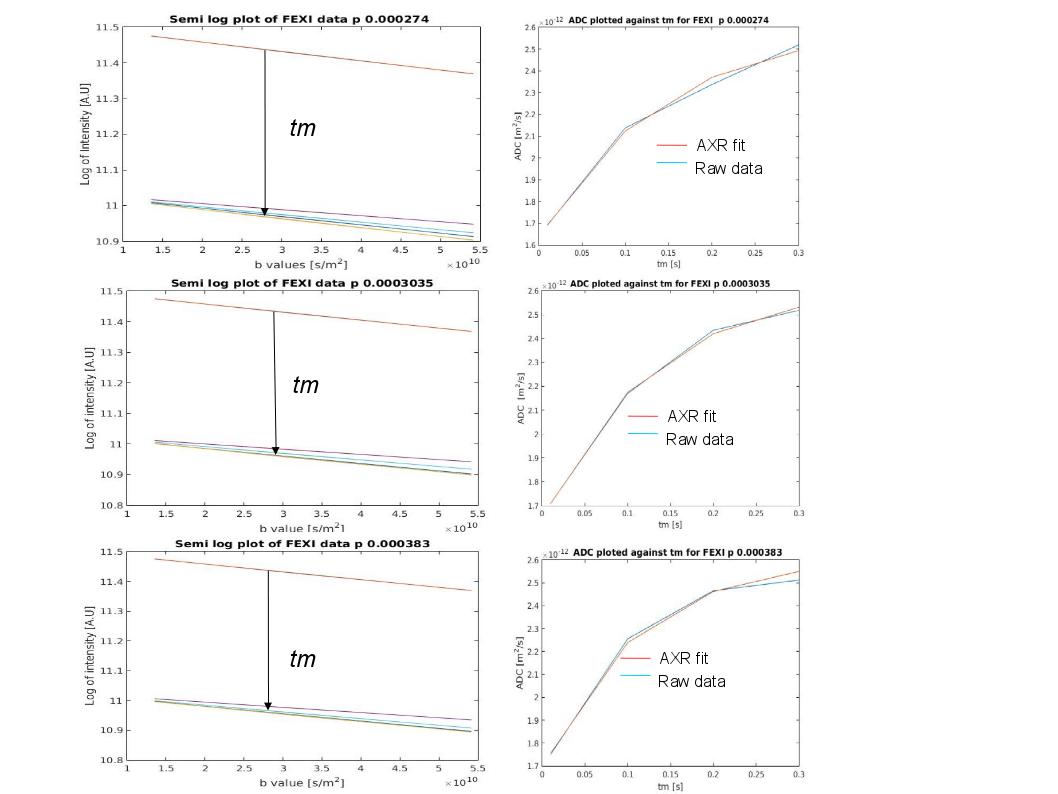
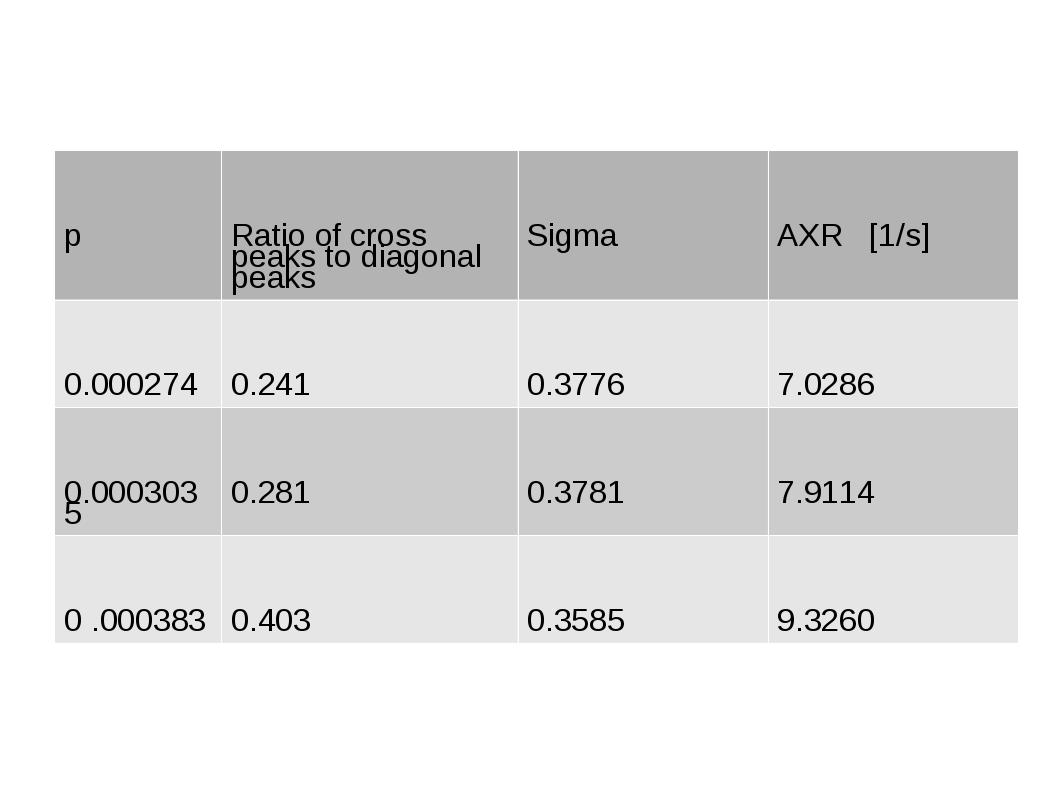
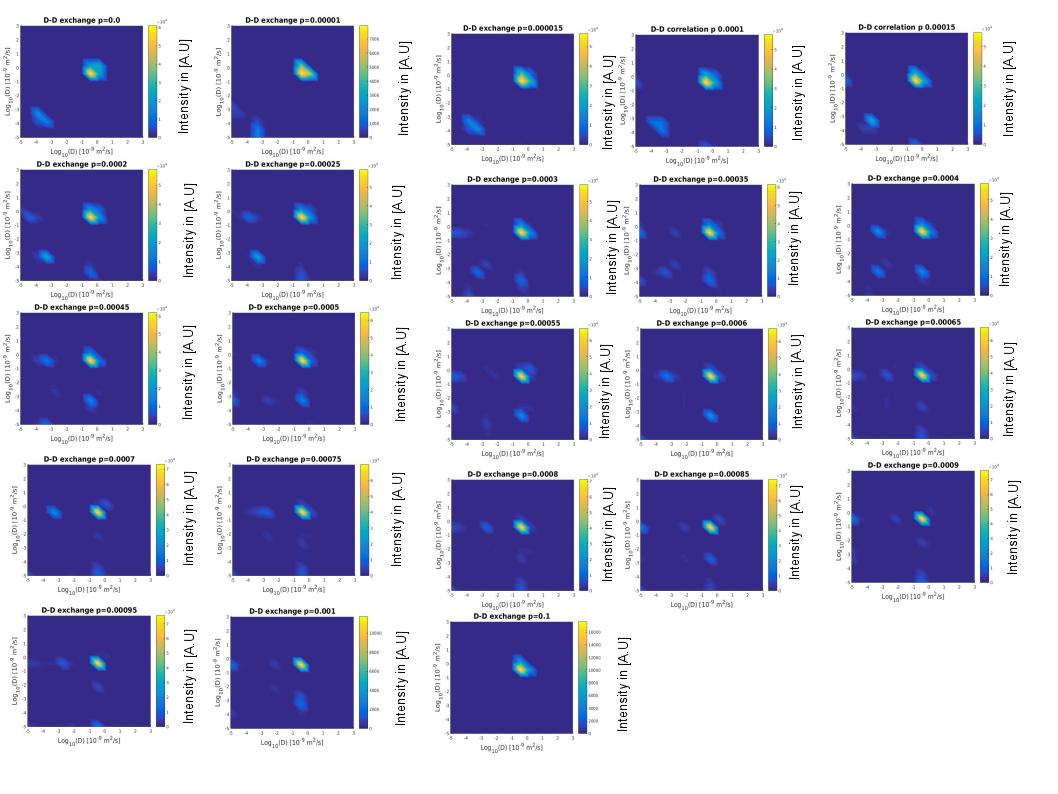
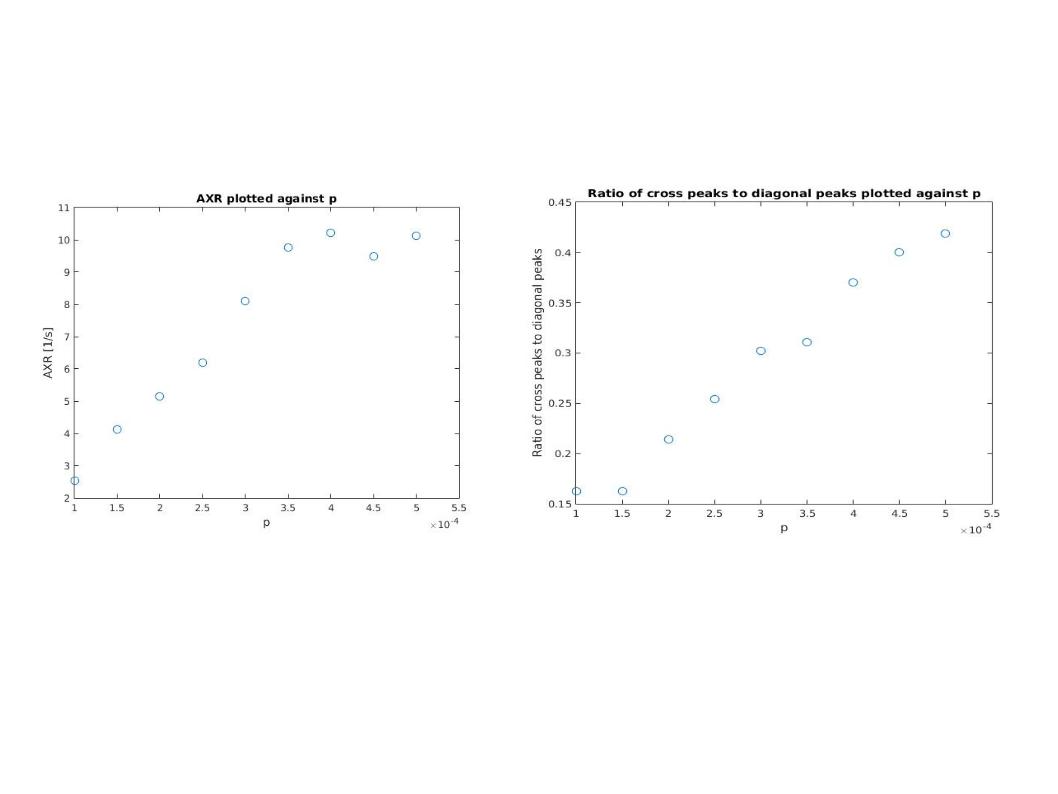
In diffusion-diffusion exchange (D-D) plots, diagonal peaks represent diffusion within different compartments (here, intracellular and extracellular) and cross peaks represent diffusion exchange between compartments. In the first simulation, diffusion-diffusion exchange plots show four clear peaks, and either two diagonal peaks and two cross peaks (where the probability of crossing the barrier is p = 2.74x10⁻⁴, 3.035x10⁻⁴) or three clear peaks with a less prominent third peak (where p= 3.83x10⁻⁴) (see figure 1). Where p=0 (no exchange), DEXSY simulations produced just two diagonal peaks in the diffusion-diffusion exchange plot, as expected. Diffusion spectra simulated for DOSY were equivalent to those measured by DEXSY where p=0. The FEXSY ADC plots show a recovery curve at all three simulated permeabilities, within the physiological range simulated, as can be seen in figure 2. Figure 3 shows a table with parameters for the first simulation. The results from the second simulation, displayed in figure 4, demonstrate that the range over which diagonal peaks and cross-peaks can be observed is approximately p=0.0001 to 0.00055, corresponding to a permeability of 0.365 to 2.008 µm/s. Below this range, only the diagonal peaks are observed and, above this range, the lower of the diagonal peaks disappears. At p = 0.1 only one peak remains, showing that the diffusion signal is indistinguishable from free exchange. Plots of FEXSY AXR and the ratio of cross peaks to diagonal peaks against p, are shown in figure 5.Discussion and conclusion:
These results suggest that both FEXSY and DEXSY are capable of measuring diffusion exchange, in simulations of nerve cell bundles, over a range of physiologically meaningful cell membrane permeabilities (1.0 µm/s-1.4 µm/s). They also suggest that diffusion exchange can be observed with DEXSY for permeabilities ranging from 0.365 µm/s to 2.008 µm/s, with DEXSY parameters showing a simpler relationship with permeability than FEXSY AXR.Acknowledgements
Cancer Research UK, King's College London and UCL Comprehensive Cancer Imaging Centre CR-UK & EPSRC and The Wellcome TrustReferences
[1] P. T. Callaghan, I Furo, Journel of Chemical Physics, 120(8):4032-4038,2004
[2]I, Aslund, S. Lasi, A. Nowacka et al, diffusion-fundementals.org 11 (2009) 69, pp 1-2
[3]E. Pangiotaki et al, NeuroImage 2012
[3] Alexander et al NeuroImage 2010
[5] Hall et al IEEE Trans. Med. Im. 2009
[6]J. Quirk et al, Magnetic Resonance in Medicine 50:493-499 (2003)
[7]K. Morris, C. Johnson, Journal of the American Chemical Society 1992
Figures