1738
Translocation of Water Molecules in Tissue1Radiology, University of Washington, Seattle, WA, United States, 2Advanced Imaging Research Center, Oregon Health and Science University, Portland, OR, United States
Synopsis
Numerical simulations of water molecule translocation are presented. The molecules execute random walks in a 3D ensemble of digital cells with density and size pertinent for biological tissue. The mean net displacements reflect “hindered” or “restricted” translocations for both extra- and intracellular water, characterized by an infinite number of exponentials. The hindrance is very sensitive to the cell membrane permeability, in the range for tissue – and controlled by active cell metabolism.
Introduction
One of biological tissue’s essences is its microscopic compartmentalization: primarily between intra- and extracellular space. Evolution has produced cell membranes relatively impermeable to water and most solute molecules. It has been long recognized that membrane permeability to many solutes is under active metabolic control. In contrast, it has been generally assumed that water molecules cross cell membranes via passive mechanisms. It has been recently recognized, however, that membrane water permeability too is dominated, and thus controlled, by an active metabolic mechanism. The equilibrium cellular water efflux rate constant, kio, a measure of the cell membrane water permeability coefficient [PW], is proportional to the cell membrane Na+,K+-ATPase [NKA] activity, one of biology’s most crucial enzymes.1
Recent numerical computer simulations of random water molecule displacements in tissue, including provision for kio, proved remarkable in describing the absolute transverse 1H2O relaxation in blood without any adjustable parameters.2 Here, we employ such simulations for the general case of water translocation in tissue.
Methods
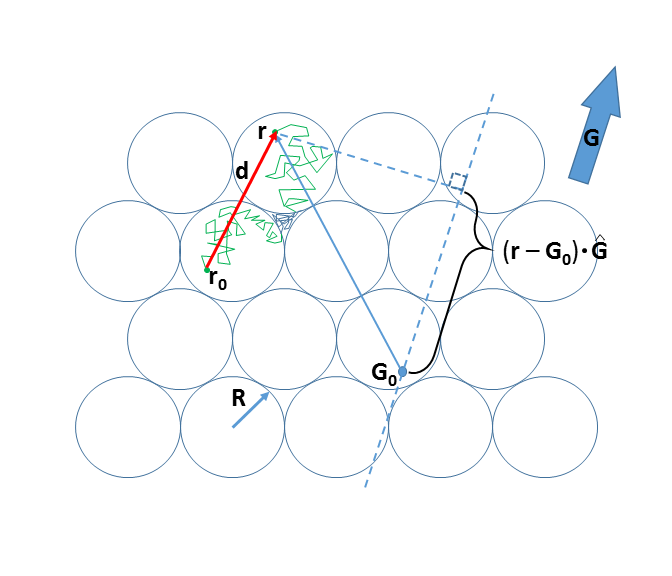
Monte Carlo simulations [Matlab] were run on a hexagonal close-packed ensemble of spheres (radius R = 15 μm, intracellular volume fraction, [vi] = 0.74). This model is diagrammed in Figure 1. That cell membranes present hindrance to displacement is evident from rejected crossings in both intra- and extracellular spaces. Simulations were carried out for a 3D ensemble of 10,648 cells. The water diffusion coefficient [D′] was set to 1.5 μm2/ms (half the 37oC pure water value2). Step duration [ts] was set to 1 μs, determining the walk root-mean-square straight line segment length [<Is>rms = (6D′ts)1/2] to be 95 nm. The purpose for D′ is to define <Is>rms; it has no other physical meaning. The digital permeability was adjusted to provide an average intracellular lifetime [τi], with kio = 1/τi. The value of PW is calculated as [(tp)D′/<Is>rms] or [2Rkio/6]; where tp is the fraction of membrane encounters having a permeation.2Results
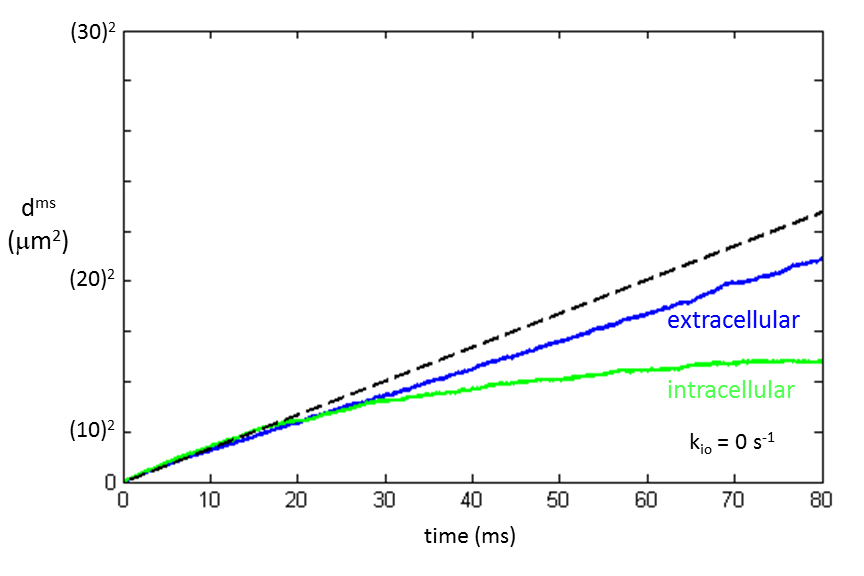
The mean squared displacement [dms ≡ <d2>] is plotted in Figure 2 for extra- and intracellular water molecules [vi = 0.74 and R = 15 µm] when no cell permeation was allowed (kio = 0 s-1). For translocation in homogeneous 3D space, the Einstein equation is: dms = 6Dt; where D is the diffusion coefficient and t is the diffusion time [duration]. In such a case, the plot of dms vs. t is a straight line with slope 6D. Neither the extra- nor intracellular Fig. 2 traces are linear. An asymptotic straight dashed line makes the blue extracellular plot nonlinearity evident.
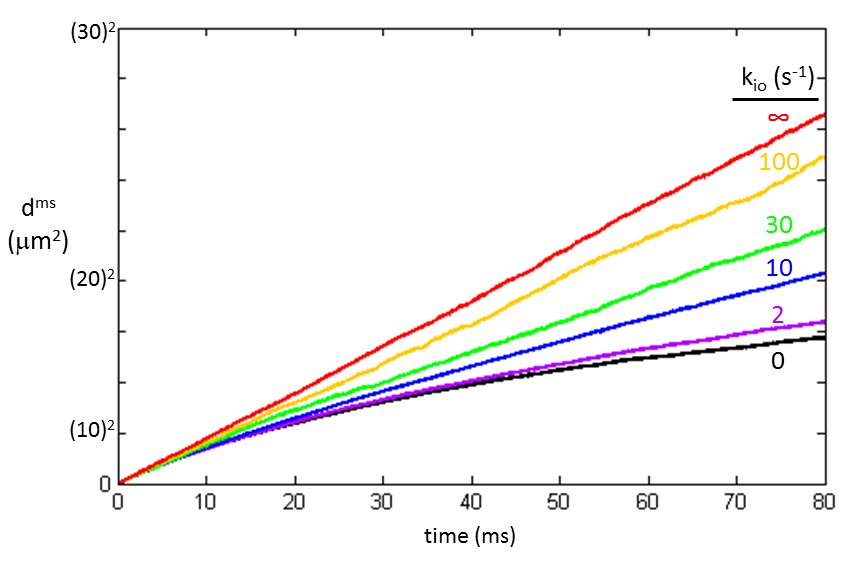
Average squared displacements were calculated for water molecule random walks through the cell ensemble [vi = 0.74 and R = 15 µm] with varying membrane permeabilities. Results spanning the known range of tissue kio values are plotted in Figure 3.1 The black curve (kio = 0 s-1) is equivalent to the volume‑weighted average [for this macromolecule-free model]: dms = [1 ‑ vi]doms + vidims; where doms and dims are the extra- and intracellular water molecule dms values, respectively [Fig. 2]. To-date, the extra- and intracellular 1H2O signals can be reliably discriminated only with sufficiently concentrated extracellular paramagnetic solute.1
Discussion
Only the red plot in Fig. 3 is linear. This is the case for “free” diffusion: slope 6D′. All the others are curved, as are the Fig. 2 plots. Such curvature is the signature of “hindered” or “restricted” diffusion.4 A straight dms vs. t plot is indicative of the single exponential nature of the Einstein equation. A continuously curved plot reflects an infinite number of exponentials; there are an infinite number of D values as the instantaneous tangent continually decreases. This is not a bi-exponential curve. A corollary is that the diffusion coefficient, D, is defined only for “free” diffusion [slope/6].
Our results indicate D is not defined for water translocation in tissue – either intra- or extracellular. This has important implications, as much of the D-weighted MRI literature has been concerned with differences of D values for intra- and extracellular water molecules.5 This new insight into the membrane permeability dependence of tissue water displacement may lead to novel methods for detecting cell metabolic activity.
Acknowledgements
Grant Support: NIH: UO1-CA154602; R44-CA180425.References
1. Springer, Li, Tudorica, Oh, Roy, Chui, Naik, Holtorf, Afzal, Rooney, Huang, NMR Biomed (2014) 27:760-773.
2. Wilson, Springer, Bastawrous, Maki, MRM (2016) Epub, doi: 10.1002/mrm.26284.
3. Submitted to this meeting.
4. Le Bihan, Turner, Moonen, Pekar, JMRI (1991) 1:7-28.
5. Ackerman, Neil, NMR Biomed (2010) 23:725-733.
Figures