1737
Substantial Error in MD Estimation Introduced by Trace Imaging1Radiology, University of Gothenburg, Goteborg, Sweden, 2Radiation Physics, University of Gothenburg, Sweden, 3Radiology, Brigham and Women's Hospital, Harvard Medical School, Boston, MA, United States
Synopsis
Since the single compartment diffusion tensor model does not reflect all contributions in diffusion signal, subsequent implications also may not hold in practice. One of the implications proven wrong here, is that mean diffusivity (MD) maps, which result from diffusion measurements along three orthogonal directions (trace imaging), are independent of the direction of the applied orthogonal gradient triplet. Simulation results with anisotropic multi-compartment diffusion models and human nerve fiber data confirm that the MD measured by trace imaging, which is typically used for rapid stroke delineation, is substantially dependent on the direction of the applied orthogonal gradient triplet and b-value.
Introduction
Mean diffusivity (MD) is often measured by performing
diffusion measurements along only three orthogonal gradient directions. This is also called trace imaging, as MD is assumed to equal one-third of the trace of the diffusion tensor. Trace imaging is a fast and useful approach for quick delineation of areas affected by stroke and is also routinely applied in body
MRI to detect tumor growth [1]. Assuming a second order diffusion tensor, MD is independent of the applied gradient directions. However, it is well-accepted that DTI does not provide a full picture of all contributions to the diffusion attenuated MR signal. Thus in practice, MD values are expected to be dependent on applied gradient directions. This study aims to quantify MD dependency on gradient directions at different b-values in human brain.
Methods and Results
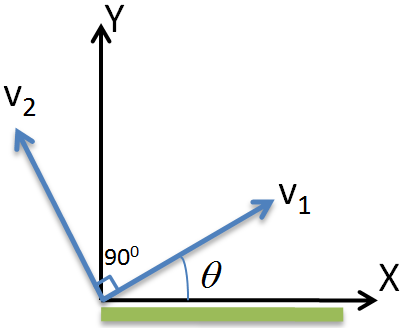
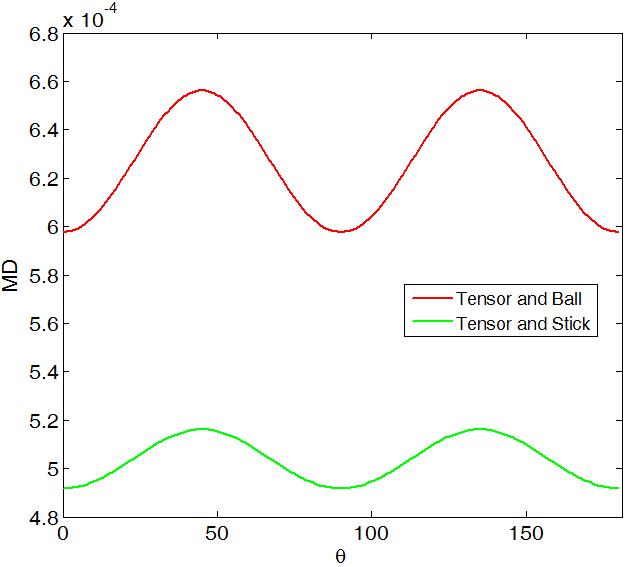
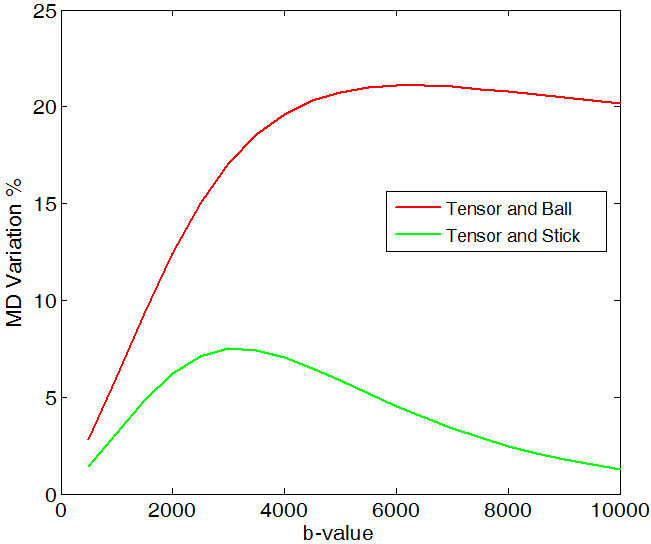
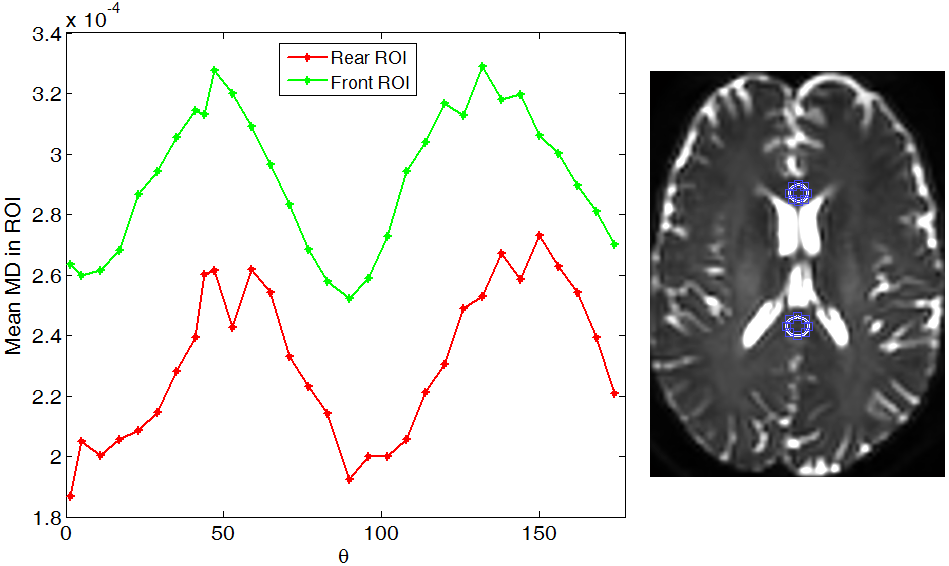
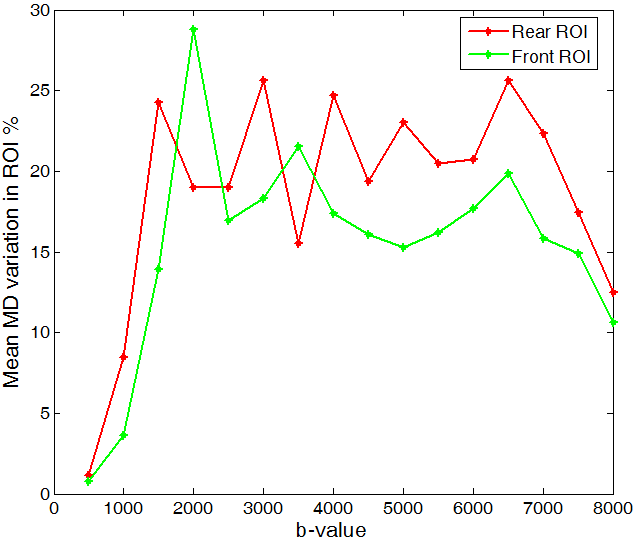
To theoretically investigate MD variation, we used two two-compartment models namely, 'tensor and ball' and 'tensor and stick' and the trace imaging protocol as illustrated in Fig. 1. Both models have the following form:$$S(\mathbf{g})=S_0(f~exp(-b\mathbf{g}^T\mathbf{D}_1\mathbf{g})+(1-f) exp(-b\mathbf{g}^T\mathbf{D}_2\mathbf{g}))$$ where $$$\mathbf{g}$$$ is the gradient encoding direction and $$$\mathbf{D}_1=diag([a~c~c])\times 10^{-3}~mm^2/s$$$ and $$$\mathbf{D}_2=diag([d~d~d])\times 10^{-3}~mm^2/s$$$ (for the 'tensor and ball' model [2]) or $$$\mathbf{D}_2=diag([e~0~0])\times 10^{-3}~mm^2/s$$$ (for the 'tensor and stick' model [3]) and $$$f$$$ determines occupation fraction for each compartment. These models are proposed to provide more realistic/detailed understanding of biological tissues examined by diffusion MRI. We simulate the diffusion signal using these models and then we estimate MD as: $$$MD=\frac{-1}{3b}\sum_{i=1}^{3}\ln(\frac{S(\text{v}_i)}{S_0})$$$. Simulation results show that the MD substantially changes depending on $$$a,~b,~c,~d,~e,~f$$$ and $$$\theta$$$. Here, we study its dependency on $$$\theta$$$ and b-value. Figure 2 shows that for both models MD is a periodic function of $$$\theta$$$ reaching a maximum at $$$\theta=45^o$$$ and a minimum at $$$\theta=0^o$$$ (one can prove this mathematically). Note that for $$$f=0$$$ or $$$f=1$$$ both models break down to DTI and thus MD variation is zero.We measure MD variation as $$$200\frac{MD_{max}-MD_{min}}{ MD_{max}+MD_{min}}$$$. As shown in Fig. 3, MD variation is also dependent on b-value. The two models behave differently at high b-values and both predict a linear increase of MD variation at low b-values (below $$$b=3000~s/mm^2$$$). The 'tensor and ball model' predicts a higher MD variation for all b-values. More specifically it exceeds 10 % for b-values above 1500$$$~s/mm^2$$$. To figure out if the substantial MD variation (up to 17 % at $$$b=3000$$$) generalizes to human brain tissue, we acquired diffusion-weighted brain images in a healthy subject (33 years old male) at 2 mm isotropic spatial resolution on a 3 Tesla system: one set at $$$b=5000~s/mm^2$$$ with $$$\theta$$$ varying from $$$0^o$$$ to $$$180^o$$$ and a step size of $$$6^o$$$, and the other set with $$$\theta=0^o,~45^o$$$ and b-values ranging from 500 to 8000$$$~s/mm^2$$$ with step size of 500$$$~s/mm^2$$$. To study MD dependence on $$$\theta$$$, we selected two ROIs with a coherent population of neural fibers oriented along the direction [1 0 0] on the first dataset (as shown in Fig. 4-right). The ROIs are located in the middle of the genu and splenium of the corpus callosum. The average MD on both ROIs follows the same pattern suggested by our theoretical models (Fig. 4-left). To study MD dependence on b-value, we selected approximately the same ROIs as above. The average variation of MD for these ROIs is similar and more in agreement with the pattern suggested by 'tensor and ball' (see figure 5). In other words, MD variation rises with increasing b-value up to a saturation point after which MD variation is constant (approximately 20 %). However, the saturation b-value occurs in practice at 2000$$$~s/mm^2$$$, i.e. at a considerably lower value than predicted by the theoretical model (6000$$$~s/mm^2$$$).
Conclusion
The extended diffusion models suggest that MD maps derived from only three orthogonal measurements are strongly dependent on fiber orientation. The amount of error in the MD estimation introduced by trace imaging along different directions is dependent on the b-value. MD variation in a clinical setting can be as high as 20 %, which means fast brain/whole body trace imaging should be used cautiously. Also 'tensor and ball' model provides a more reliable prediction than 'ball and stick'. It is expected that the error is not only governed by the multi-compartment nature of the diffusion environment, but also by the presence of Rician noise.Acknowledgements
This study was supported in part by ALFGBG-374871 and NIH grant R01 EB010195.References
[1] M Gianelli et al. 'On the use of trace-weighted images in body diffusional kurtosis imaging', MRI, 34:502–507, (2016) .
[2] S. E Maier et al. 'Biexponential Diffusion Tensor Analysis of Human Brain Diffusion Data', MRM, 51:321–330, (2004).
[3] T. E. J. Behrens et al. 'Characterization and propagation of uncertainty in diffusion-weighted MR imaging', MRM, 50:1077–1088 (2003).
Figures