1735
A modified tri-exponential model for multi-b-value diffusion-weighted imaging to detect the strictly diffusion-limited compartment and its initial application in grading and differential diagnosis of gliomas1Department of Neurosurgery, Second Affiliated Hospital of Zhejiang University College of Medicine, Hangzhou, People's Republic of China, 2Department of Radiology, Second Affiliated Hospital of Zhejiang University College of Medicine, Hangzhou, People's Republic of China, 3Department of Neurology, Second Affiliated Hospital of Zhejiang University College of Medicine, Hangzhou, People's Republic of China
Synopsis
In this study, we focused on the strictly diffusion-limited compartment with extremely low ADC. Because of the negligible signal attenuation of this compartment, the ADC of this compartment was set as zero. By adding this compartment to the two-compartment model, we presented a modified tri-exponential model. The AICcs of this model were found to be lower than the bi-exponential model and the conventional tri-exponential model, indicating this model is the best. Additionally, the parameters derived from this model, especially the fraction of the strictly diffusion-limited compartment (f0), showed potential clinical value in distinguishing the grade of malignancy of tumors.
Introduction
In order to detect the real distribution of water diffusion in tissues, many models have been developed 1-3, including multi-compartment models. Both the two-compartment model and models with more compartments face many challenges 4-10. Previous studies have indicated the existence of the strictly diffusion-limited compartment with extremely low ADC in tissues and even cells 10-14. However, the existing models do not contain this compartment. The signal attenuation of this compartment is negligible at normal b-values. Hence, the ADC of this compartment could be set to zero mathematically. By adding this compartment to the two compartments model and setting the ADC of this compartment as zero, we developed a modified tri-exponential model (see equation [1]). According to our hypothesis, the strictly diffusion-limited compartment represents water molecules strictly limited in microstructures, such as intracellular organelles and myelin sheath. Hence, f0 represents the volume fraction of these microstructures. Our first study was to compare this new model with the bi-exponential model and the conventional tri-exponential model. Secondly, we also performed an initial study to apply this model in grading and differential diagnosis of gliomas.
S=S0*(f0+fslow*e-ADCslow*b+ffast*e-ADCfast*b) [1]
where f0+fslow+ffast=1, f0 is the fraction of the strictly diffusion-restricted compartment, and fslow and ffast are corresponding fractions of ADCslow and ADCfast.
Methods
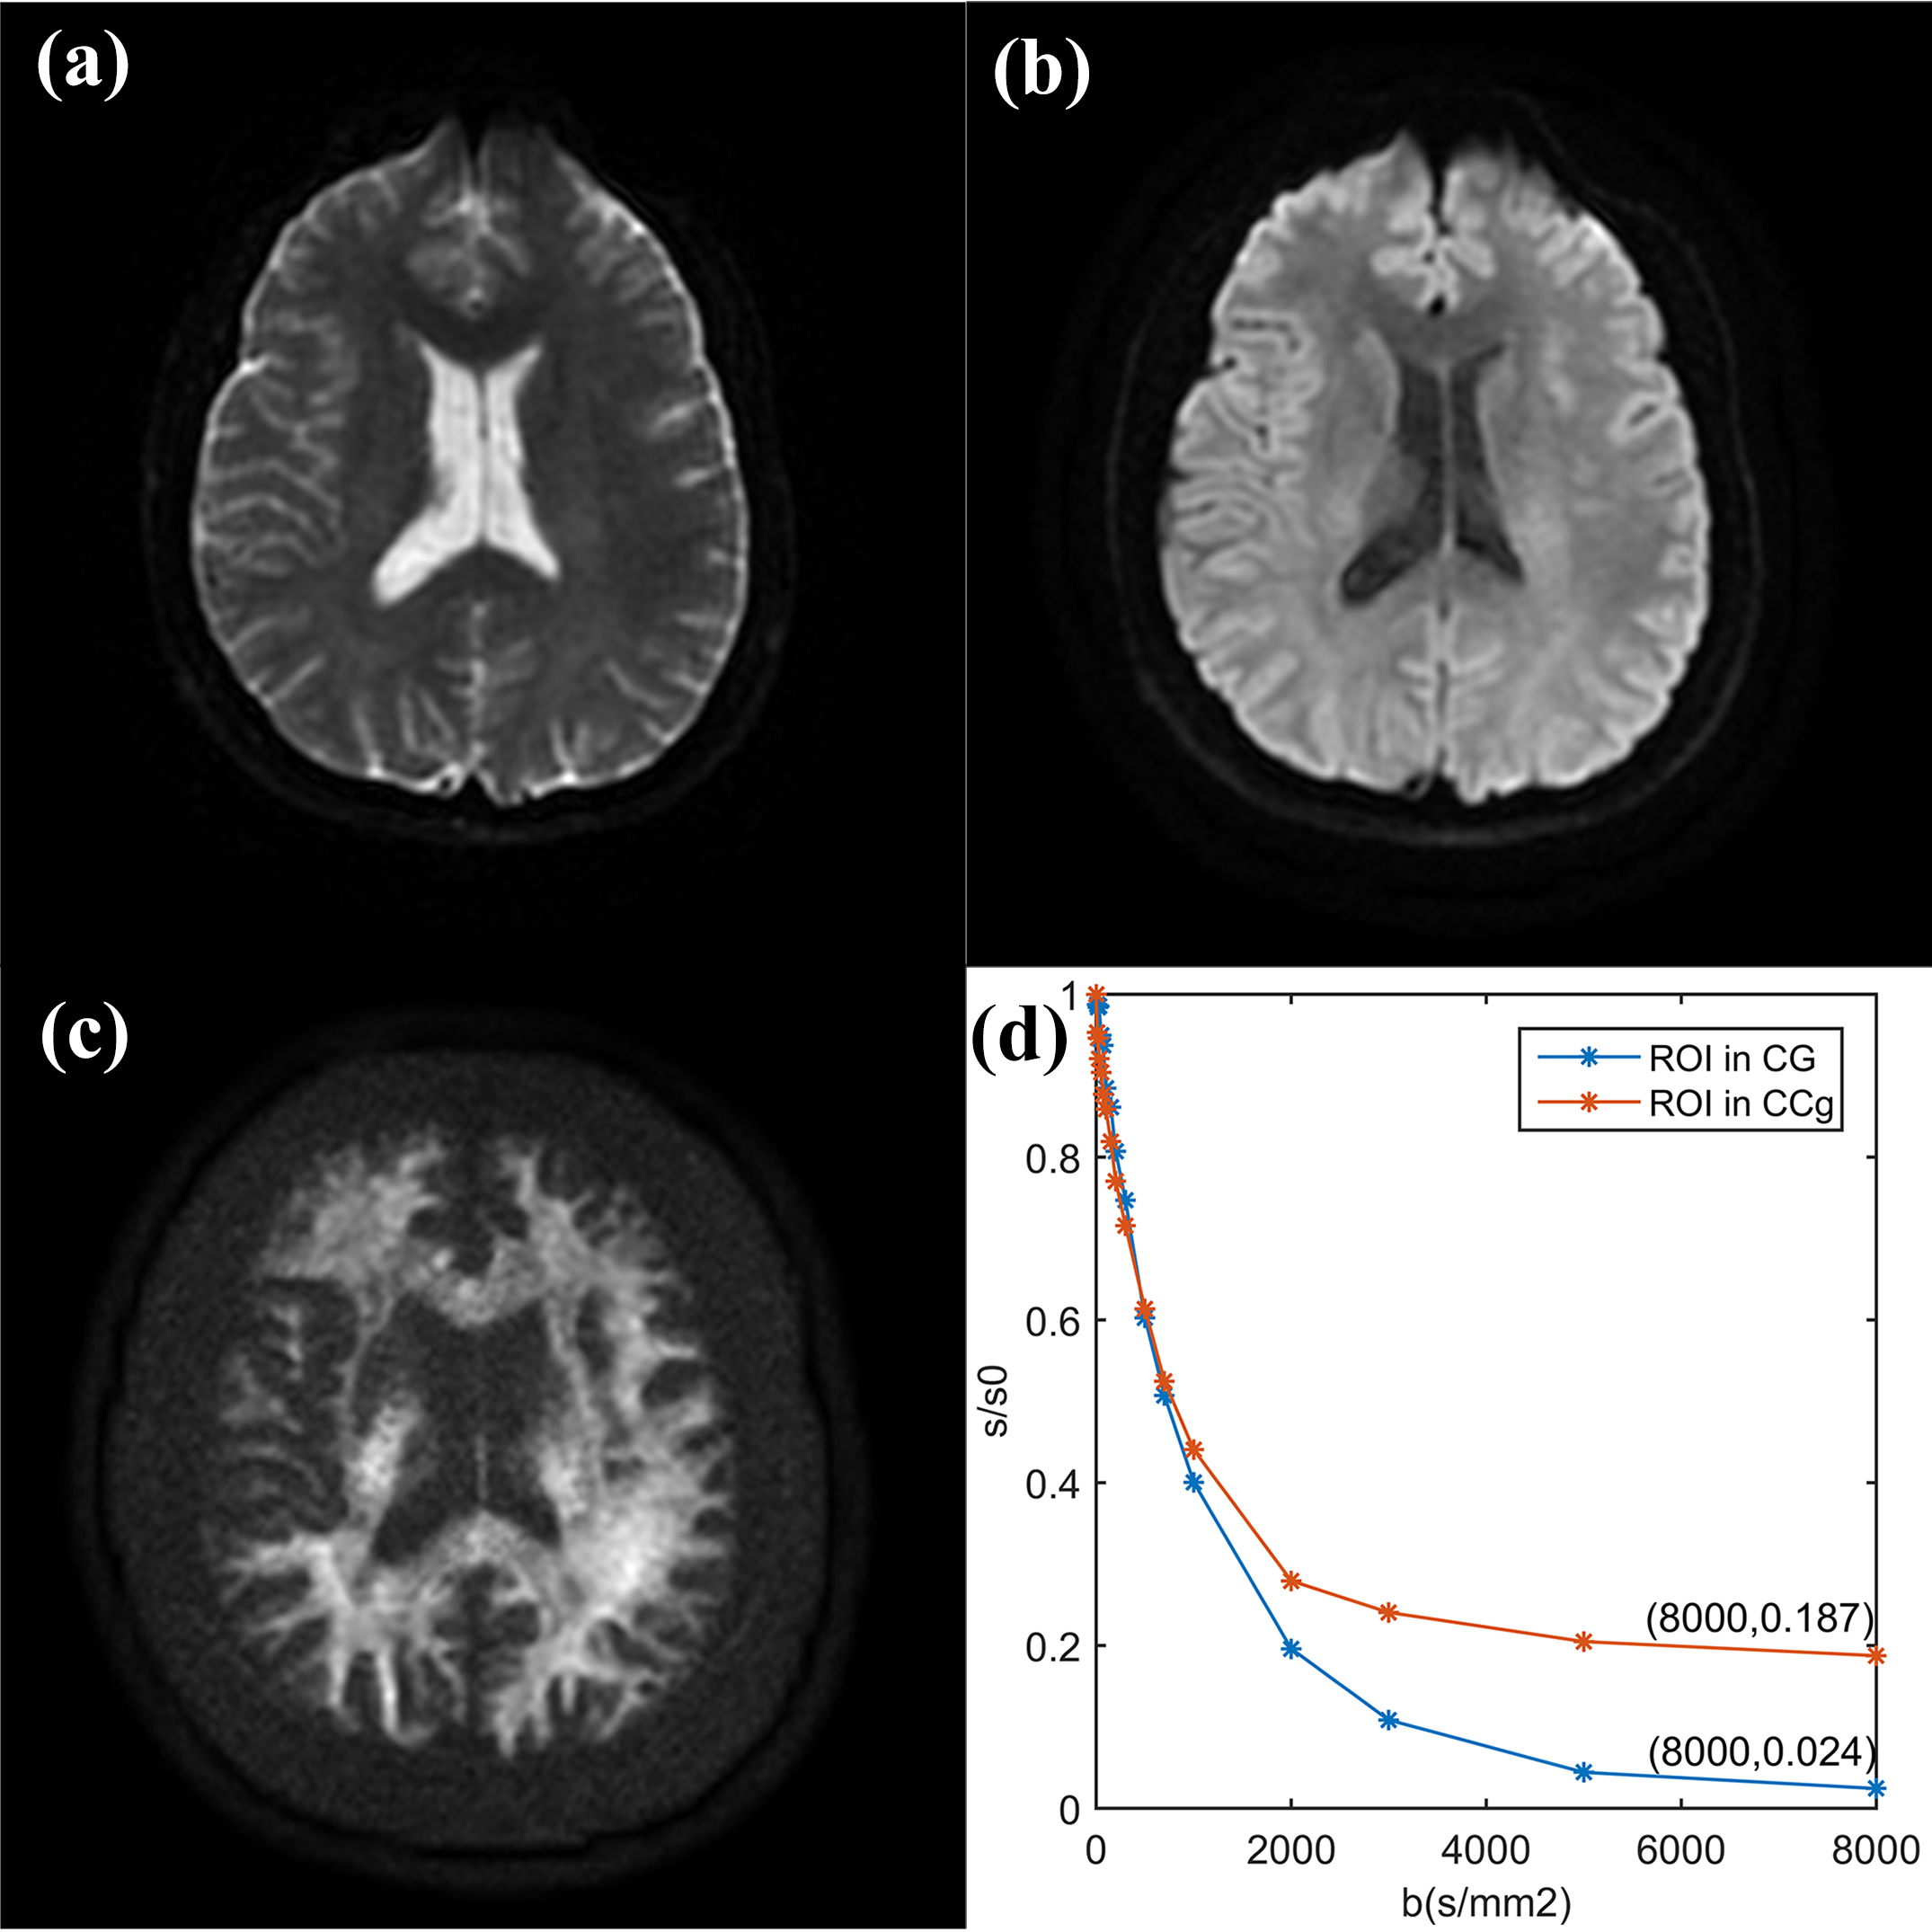
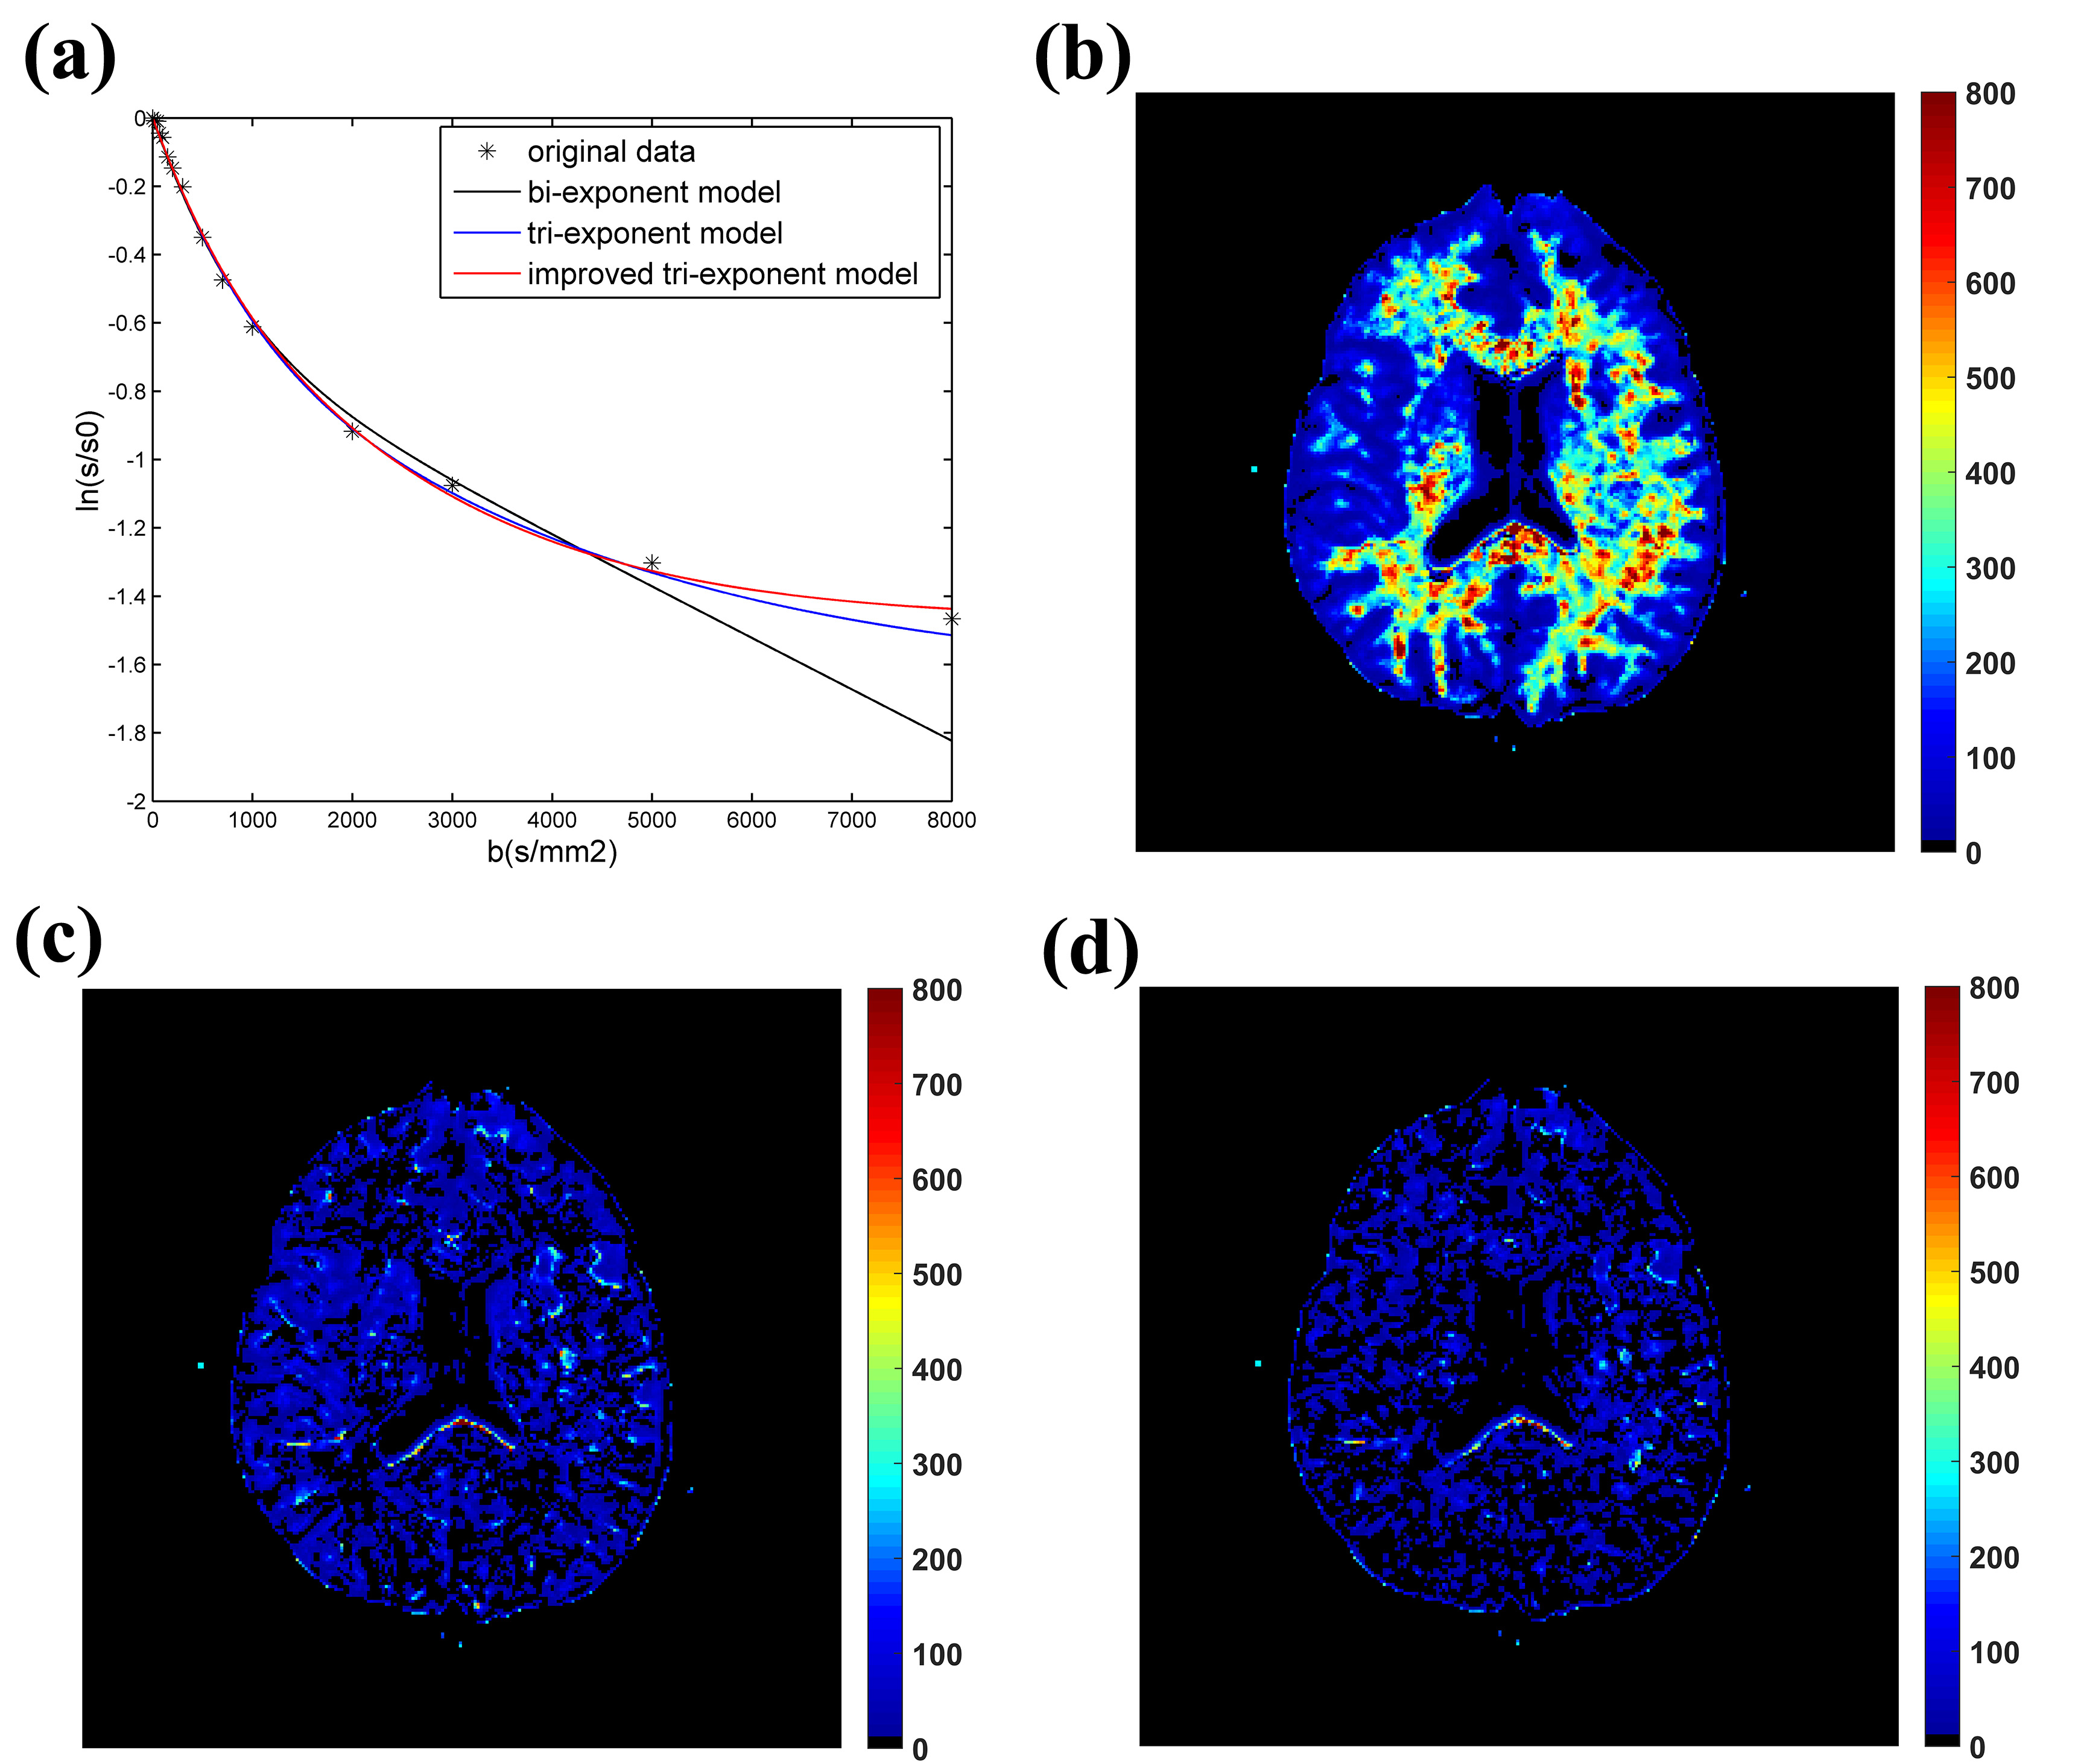
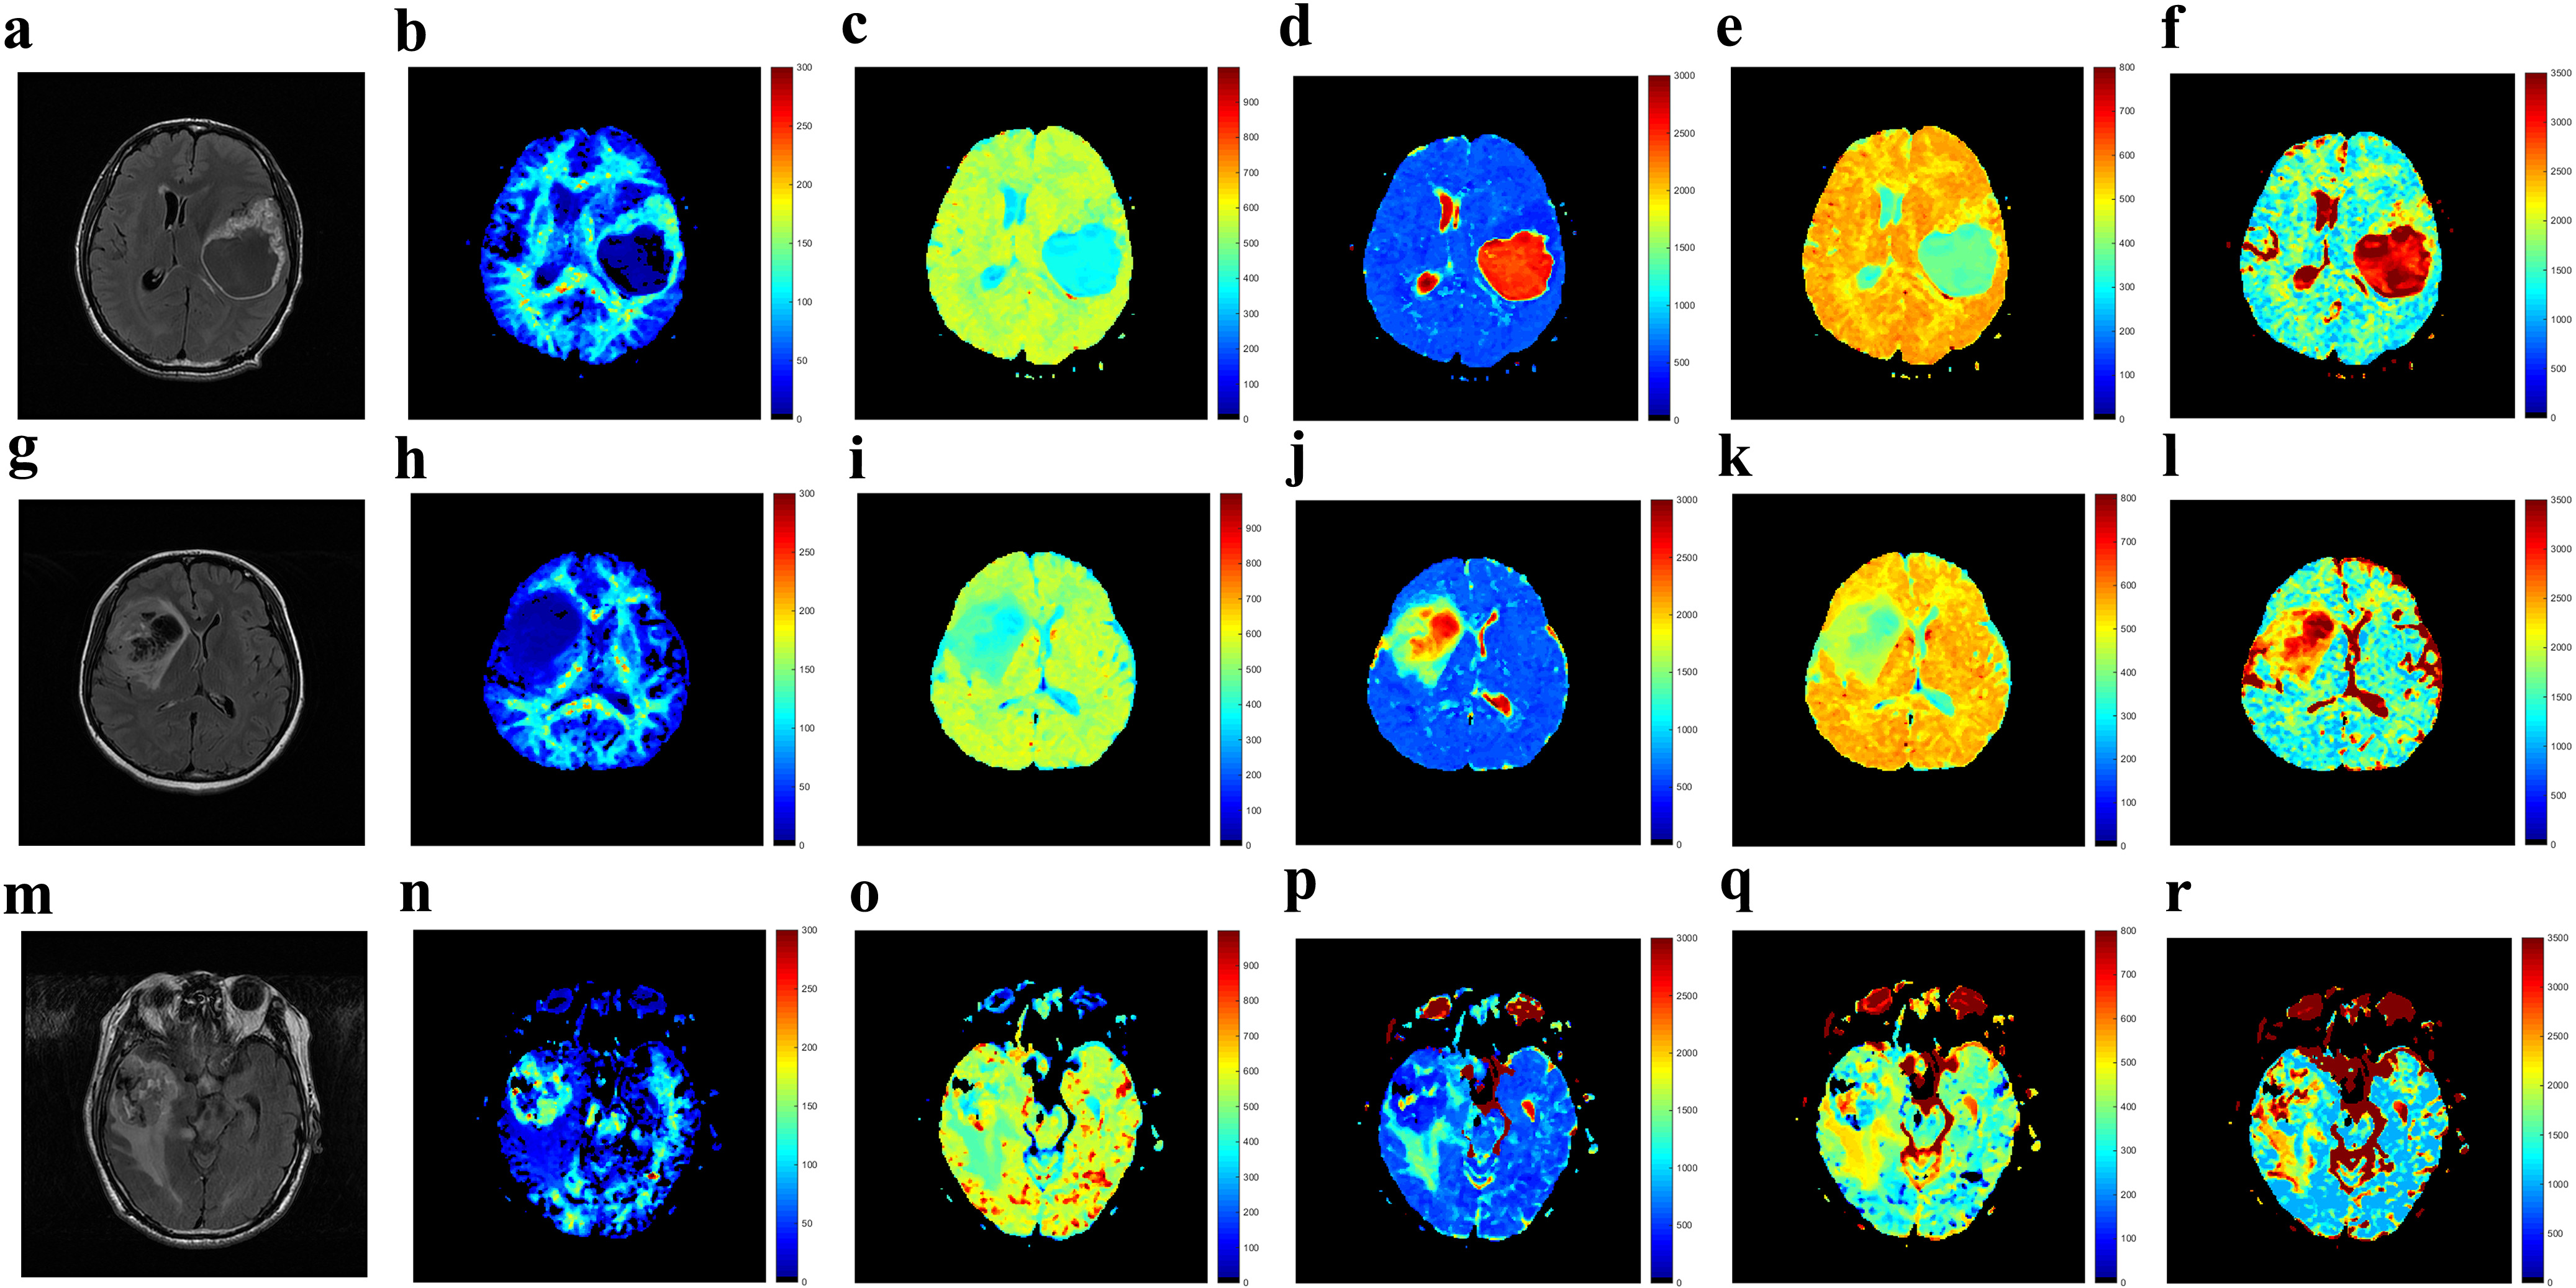
Firstly, multi-b-value diffusion-weighted imaging (DWI) with 17 b-values up to 8000 s/mm2 were achieved from 6 volunteers. The DWI images with the first 16 b-values were used for curve fitting. The corrected Akaike information criterions (AICcs) were calculated to determine the best model. Then the signal intensities at b = 8000 s/mm2 were predicted, and the errors between the predicted and measured values were squared to form the squared predicted errors (SPEs). This index was used to identify whether models could accurately predict the signal attenuation at ultra-high b-value. Secondly, we performed a retrospective study based on our prospectively collected database for gliomas. 18 low-grade gliomas (LGG), 45 high-grade gliomas (HGG) and 5 primary central nervous system lymphomas (PCNSL), who underwent a pre-operative DWI with 9 b-value up to 3000 s/mm2, were enrolled in this study. Parametric maps were derived from the modified tri-exponential model. The receiver operating characteristic and the Pearson rank correlation were used for statistical analysis.Results
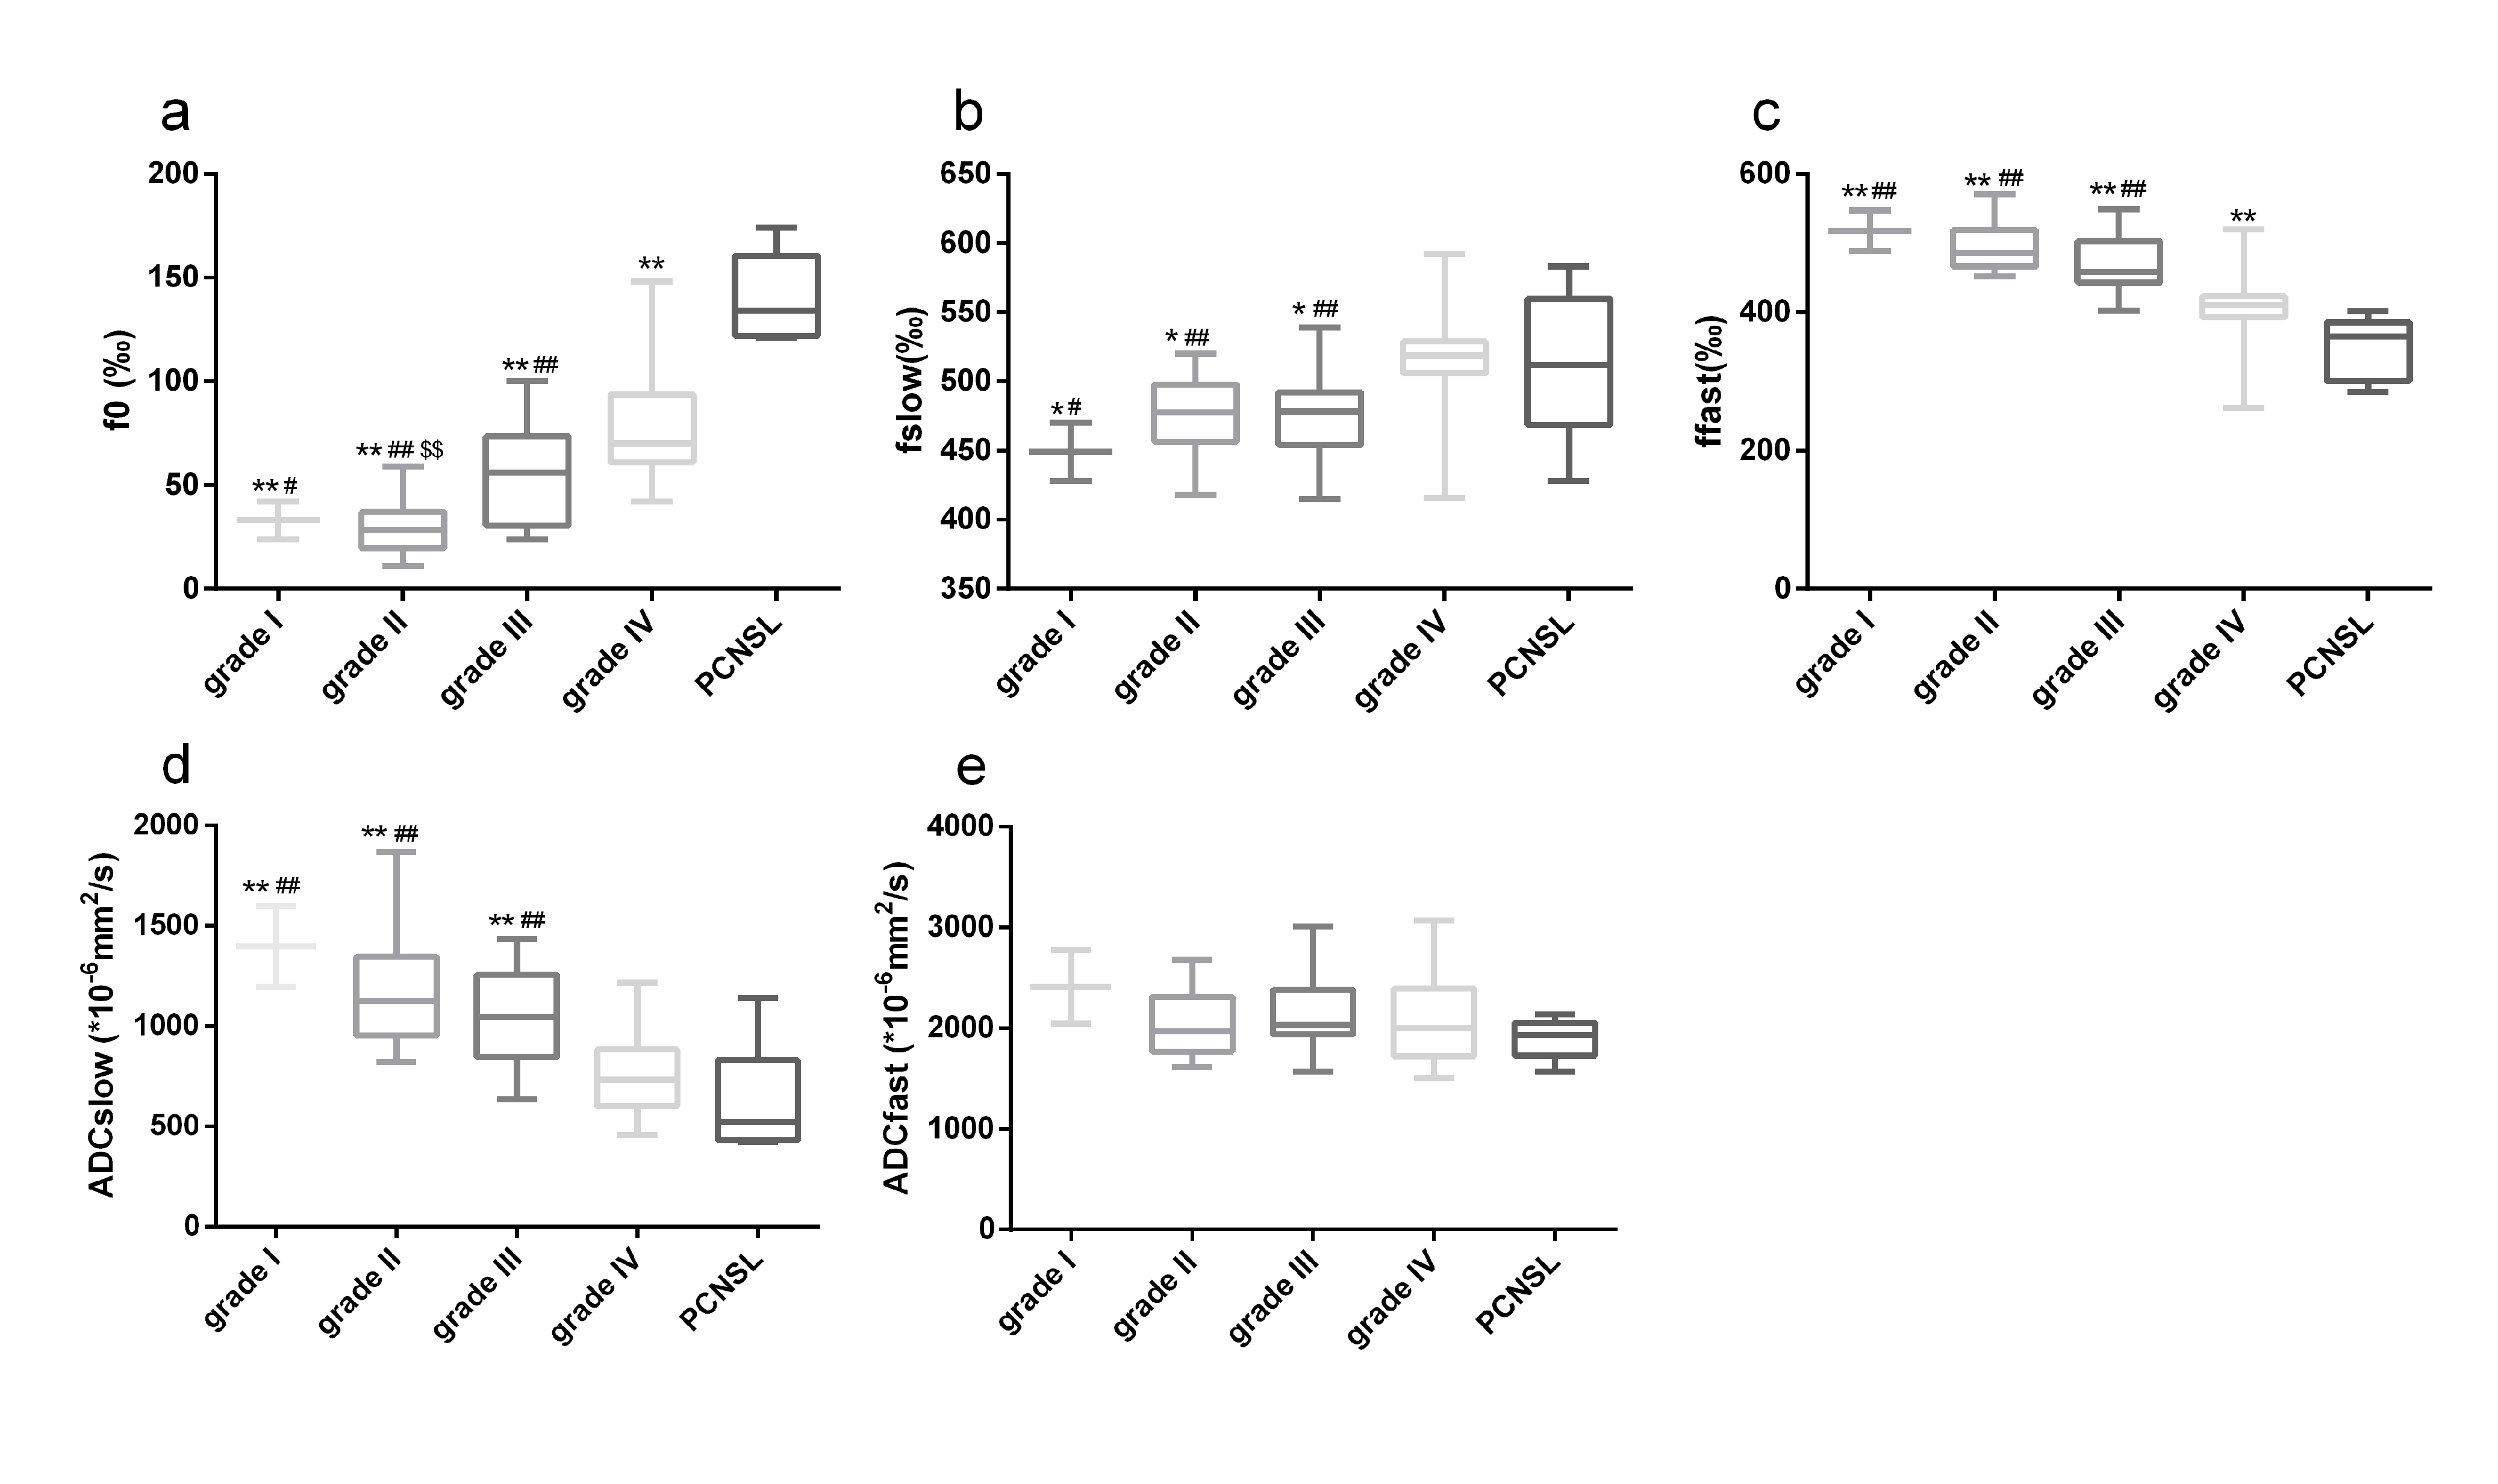
For the first study, in all white matter ROIs: the AICcs of the modified tri-exponential model were the lowest (p < 0.05, except for one ROI); the SPEs of the bi-exponential model were the highest (p < 0.05). The mean f0, fvery-slow and ADCvery-slow values were ranging 11.9 - 18.7%, 11.9 – 18.3% and 1 – 7 × 10⁻⁶ mm2/s respectively in white matter ROIs, and 1.2 - 2.7%, 11.9 - 15.7% and 251 – 445 × 10-6 mm2/s respectively in gray matter ROIs. For the second study, the mean f0 values for PCNSL, HGG and LGG were 13.98%, 6.98% and 3.14% respectively. Four parameters (f0, fslow, ffast and ADCslow) showed ability in distinguishing HGG from LGG (AUC = 0.901, 0.720, 0.829 and 0.813 respectively) and PCNSL from gliomas (AUC = 0.981, 0.652, 0.943 and 0.844 respectively), and showed moderate correlation with the Ki-67 index (r = 0.638, 0.444, -0.595 and -0.518 respectively). Among these parameters, f0 showed the highest clinical value.Discussion
Firstly, the f0 values were large in white matter, PCNSL and HGG, suggesting the strictly diffusion-limited compartment is a significant component in white matter and high malignant tumors, and the existence of this compartment cannot be explained only by noise. The modified tri-exponential model with lowest AICc is considered as the best among three models. The bi-exponential model was found to be an over-fitting model, while the convention tri-exponential model was found to be an over-fitting model. Besides, ADCvery-slow values were much higher in gray matter than in white matter, which demonstrates that the biological implication for the ADCvery-slow compartment differs among tissues. Models with more compartments may also face this critical limitation. The f0 was consistence with the fraction of myelin sheath in white matter (10 - 20%) 15,16. Higher malignant tumors associate with higher cell density. Besides, swollen organelles have been detected in high malignant tumors 17-20, which may be due to vigorous metabolism and relatively hypoxia. Accordingly, the volume fraction of organelles may have positive correction with tumor malignancy. This may explain why f0 has ability in distinguishing the grade of malignancy of tumors.Conclusion
The modified tri-exponential model is the best among these three models. The fraction of the strictly diffusion-limited compartment (f0) derived by the new model has important biological implication, and has potential value in distinguishing the grade of malignancy of tumors.Acknowledgements
This work was supported by the Natural Science Foundation of Zhejiang (Grant number:LY13H180006) and the Medicine and Health Research Foundation of Hangzhou (Grant number: 20140633B25). The authors thank the participants, as well as the MR technicians of our center for necessary modifications to the sequence.References
1. Bennett KM, Schmainda KM, Bennett Tong R, Rowe DB, Lu H, Hyde JS. Characterization of continuously distributed cortical water diffusion rates with a stretched-exponential model. Magn Reson Med. 2003;50(4):727-734.
2. Le Bihan D, Breton E, Lallemand D, Aubin ML, Vignaud J, Laval-Jeantet M. Separation of diffusion and perfusion in intravoxel incoherent motion MR imaging. Radiology. 1988;168(2):497-505.
3. Jensen JH, Helpern JA, Ramani A, Lu H, Kaczynski K. Diffusional kurtosis imaging: The quantification of non-gaussian water diffusion by means of magnetic resonance imaging. Magn Reson Med. 2005;53(6):1432-1440.
4. Bisdas S, Koh TS, Roder C, et al. Intravoxel incoherent motion diffusion-weighted MR imaging of gliomas: feasibility of the method and initial results. Neuroradiology. 2013;55(10):1189-1196.
5. Koh D-M, Collins DJ, Orton MR. Intravoxel incoherent motion in body diffusion-weighted MRI: reality and challenges. AJR Am J Roentgenol. 2011;196(6):1351-1361.
6. Steier R, Aradi M, Pál J, et al. A biexponential DWI study in rat brain intracellular oedema. Eur J Radiol. 2012;81(8):1758-1765.
7. Schwarcz A, Bogner P, Meric P, et al. The existence of biexponential signal decay in magnetic resonance diffusion-weighted imaging appears to be independent of compartmentalization. Magn Reson Med. 2004;51(2):278-285.
8. Lin Y, Li J, Zhang Z, et al. Comparison of Intravoxel Incoherent Motion Diffusion-Weighted MR Imaging and Arterial Spin Labeling MR Imaging in Gliomas. Biomed Res Int. 2015;2015(5):234245–10.
9. Bourne R, Panagiotaki E. Limitations and Prospects for Diffusion-Weighted MRI of the Prostate. Diagnostics 2016, Vol 6, Page 21. 2016;6(2):21.
10. Grant SC, Buckley DL, Gibbs S, Webb AG, Blackband SJ. MR microscopy of multicomponent diffusion in single neurons. Magn Reson Med. 2001;46(6):1107-1112.
11. Sen PN, Basser PJ. A model for diffusion in white matter in the brain. Biophys J. 2005;89(5):2927-2938. 12. Baxter GT, Frank LR. A computational model for diffusion weighted imaging of myelinated white matter. NeuroImage. 2013;75:204-212.
13. Ling X, Zhang Z, Zhao Z, et al. Investigation of Apparent Diffusion Coefficient from Ultra-high b-Values in Parkinson's Disease. Eur Radiol. 2015;25(9):2593-2600.
14. Niendorf T, Dijkhuizen RM, Norris DG, van Lookeren Campagne M, Nicolay K. Biexponential diffusion attenuation in various states of brain tissue: Implications for diffusion-weighted imaging. Magn Reson Med. 1996;36(6):847-857.
15. Lancaster JL, Andrews T, Hardies LJ, Dodd S, Fox PT. Three-pool model of white matter. J Magn Reson Imaging. 2003;17(1):1-10.
16. Whittall KP, MacKay AL, Graeb DA, Nugent RA, Li DK, Paty DW. In vivo measurement of T2 distributions and water contents in normal human brain. Magn Reson Med. 1997;37(1):34-43.
17. Duffell D, Farber L, Chou S, Hartmann JF, Nelson E. Electron Microscopic Observations on Astrocytomas. The American Journal of Pathology. 1963;43(4):539-545.
18. Arismendi-Morillo G. Electron microscopy morphology of the mitochondrial network in gliomas and their vascular microenvironment. Biochimica et Biophysica Acta (BBA) - Bioenergetics. 2011;1807(6):602-608.
19. Machado CML, Zorzeto TQ, Bianco JER, et al. Ultrastructural characterization of the new NG97ht human-derived glioma cell line using two different electron microscopy technical procedures. Microscopy Research and Technique. 2009;72(4):310-316.
20. Arismendi-Morillo GJ, Castellano-Ramirez AV. Ultrastructural mitochondrial pathology in human astrocytic tumors: potentials implications pro-therapeutics strategies. J Electron Microsc (Tokyo). 2008;57(1):33-39.
Figures