1734
White Matter Structural Differences among Subjects with Obstructive Sleep Apnea after Persistent CPAP-Treatment: A Non-Gaussian Diffusion MR Study with TBSS1Center for MR Research, University of Illinois at Chicago, Chicago, IL, United States, 2Department of Radiology, Tongji Hospital, Huazhong University of Science and Technology, Wuhan, People's Republic of China, 3College of Nursing, University of Illinois at Chicago, Chicago, IL, United States, 4Department of Bioengineering, University of Illinois at Chicago, Chicago, IL, United States, 5Departments of Radiology, Neurosurgery, and Bioengineering, University of Illinois at Chicago, Chicago, IL, United States
Synopsis
Obstructive sleep apnea (OSA) can result in brain white matter (WM) injuries due to the hypoxic exposure. Continuous positive airway pressure (CPAP) is a common method for treating OSA patients. However, it is unclear why some patients respond to the treatment whereas others do not. In this study, we employ a non-Gaussian diffusion MRI method using a continuous-time random-walk (CTRW) model with TBSS analysis to investigate the WM microstructural variations among OSA patients who responded differently to identical CPAP-treatment. Our results have shown that CTRW-related parameters in some WM tracts exhibited significant difference between the responders and non-responders.
Introduction:
Obstructive sleep apnea (OSA) can
result in intermittent hypoxemia, which triggers oxidative stress and
ischemia-reperfusion injuries in the brain white matter (WM), leading to cognitive
and functional deficits1,2. Continuous positive airway pressure
(CPAP) is the primary treatment for OSA patients. However, it remains intriguing why only some
patients with persistent CPAP usage respond to the treatment as measured by
daytime somnolence. A recent DTI study3 has demonstrated the difference
in MD and radial diffusivity between responders and non-responders, suggesting
a possible mechanism of irreversible injuries in several WM tracts. Recent
advent in non-Gaussian diffusion imaging has considerably expanded the ability
to probe tissue microstructural changes beyond DTI. In this study, we employ a non-Gaussian
diffusion MRI method, the continuous-time random-walk
(CTRW) model4, with a tract-based
spatial statistics (TBSS) analysis5
to gain additional insights into the WM microstructural variations among OSA
patients who respond differently to identical CPAP-treatment.Materials and Methods:
Subjects:
Twenty-seven male patients (age: 30-55 years) with severe OSA were enrolled in the study. All patients received CPAP as the only treatment (CPAP≥6h/night for at least 30 days). Based on the post-treatment Psychomotor Vigilance Task (PVT) results6, the patients were divided into a non-sleepy group (i.e., responders; PVT lapse ≤5; n=18) and sleepy group (i.e., non-responders; PVT lapse>5; n=9).
Image Acquisition:
All subjects underwent MRI scans with a customized multi-b-value DWI sequence as well as a commercial DTI sequence on a 3 Tesla GE MR750 scanner. The multi-b-value DWI data were acquired with: TR/TE=4200/91.2ms, FOV=24×24cm2, matrix size=128×128, slice thickness=3mm, 14 b-values=01, 101, 501, 1001, 2001, 4001, 7001, 10002, 15002, 20002, 25002, 30002, 35002, and 40002 s/mm2 (the subscript indicates the number of averages), and the scan time=4 min 20 secs. At each non-zero b-value, trace-weighted images were used to minimize the effect of diffusion anisotropy. The DTI protocol was detailed in reference3.
Image and Statistical Analyses:
In the CTRW model, the diffusion-attenuated signal follows a Mittag-Leffler function4:
$$M(b)=M_{0}E_{\alpha}(-(bD_{m})^{\beta})$$
where Dm is an anomalous diffusion coefficient, α and β correspond to temporal and spatial diffusion heterogeneity, respectively. Using this equation, the CTRW model was fit to the multi-b-value diffusion images, producing Dm, α, and β maps.
A TBSS analysis was performed on the DTI dataset to generate an averaged FA skeleton. Diffusion maps based on α, β, and Dm were projected onto the FA skeleton and then evaluated for differences between the two patient groups by using FSL permutation test with a statistical significance set at 0.05.
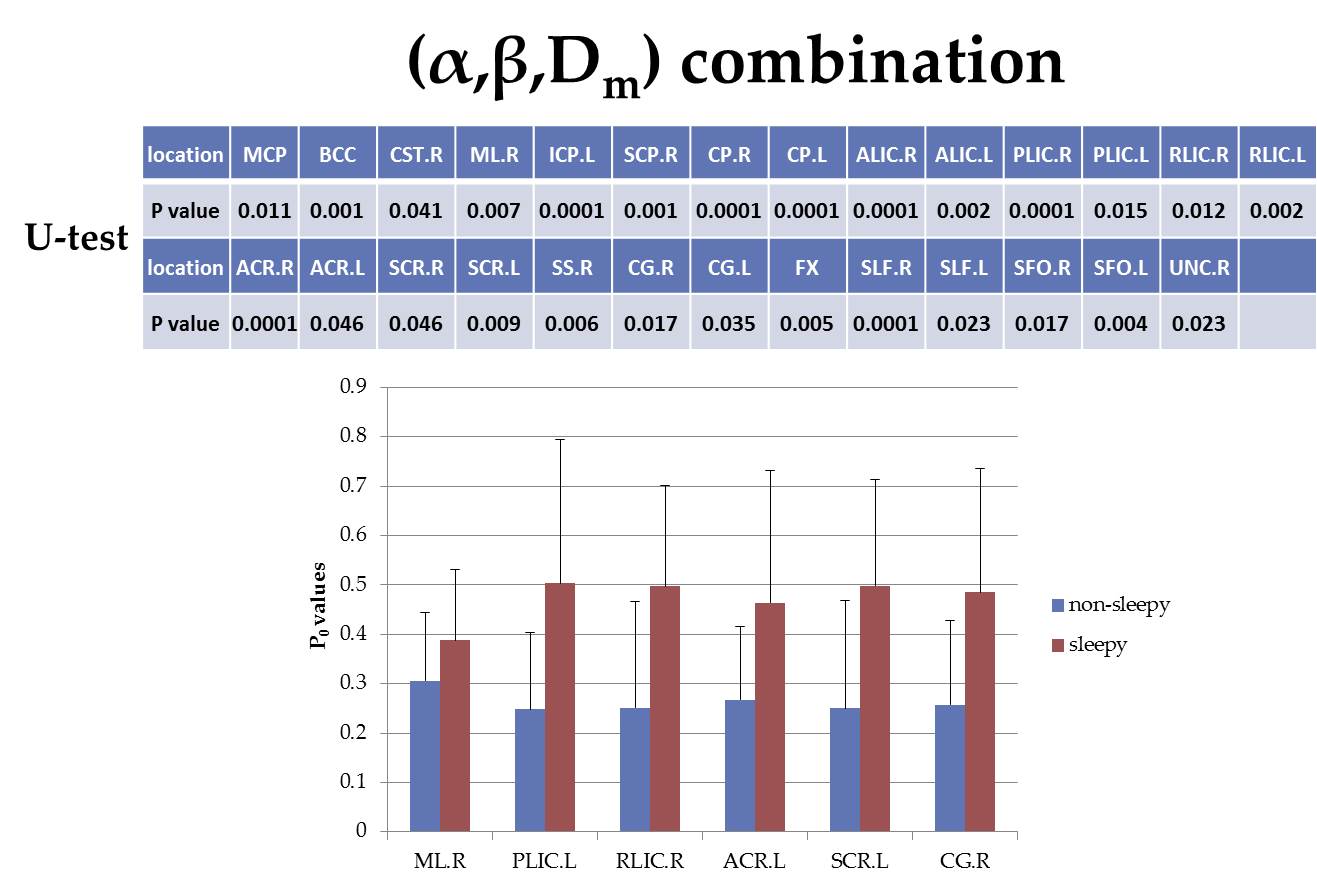
In addition to the whole-brain analysis above, a regional WM analysis was also performed using 1mm JHU-ICBM labels7 to produce 48 fiber tract regions. For each region, the average α, β, and Dm were calculated and compared between the sleepy and non-sleepy groups. The combination of all three CTRW parameters (α, β and Dm), represented by a probability P0, was also compared using a binary logistic regression8. Mann-Whitney U-test was used in all comparisons between the two groups with a statistical significance set at 0.05.
Results:
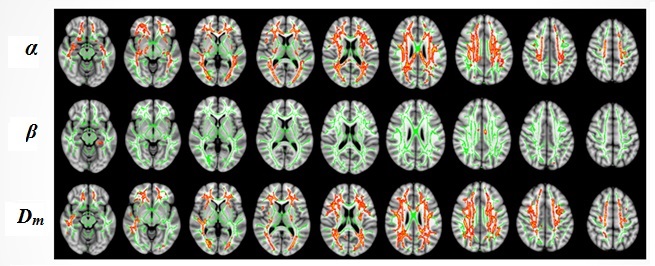
In the whole-brain analysis, the OSA patients with residual sleepiness showed higher α in 20.3% and Dm in 18.96% of the WM skeletons when compared to the non-sleepy subjects (Figure 1), whereas no significant difference in β was observed (p>0.05).
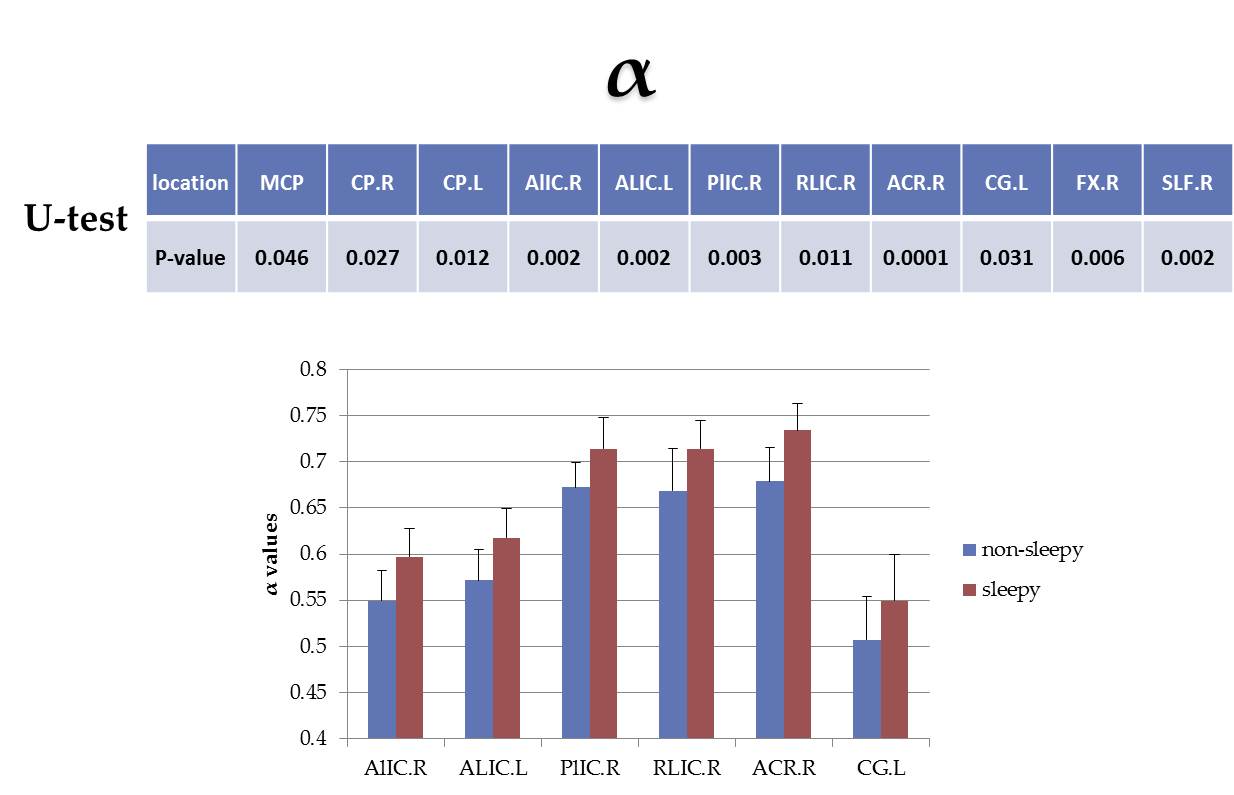
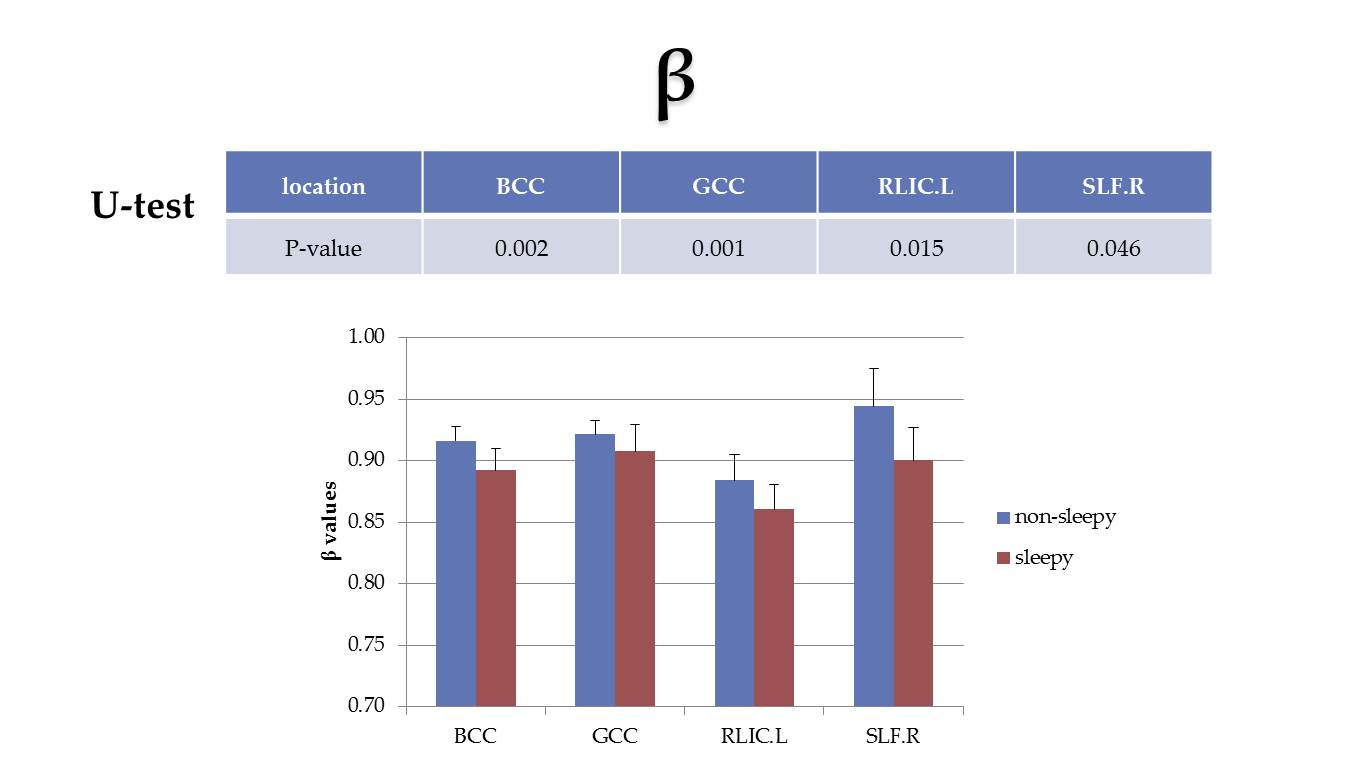
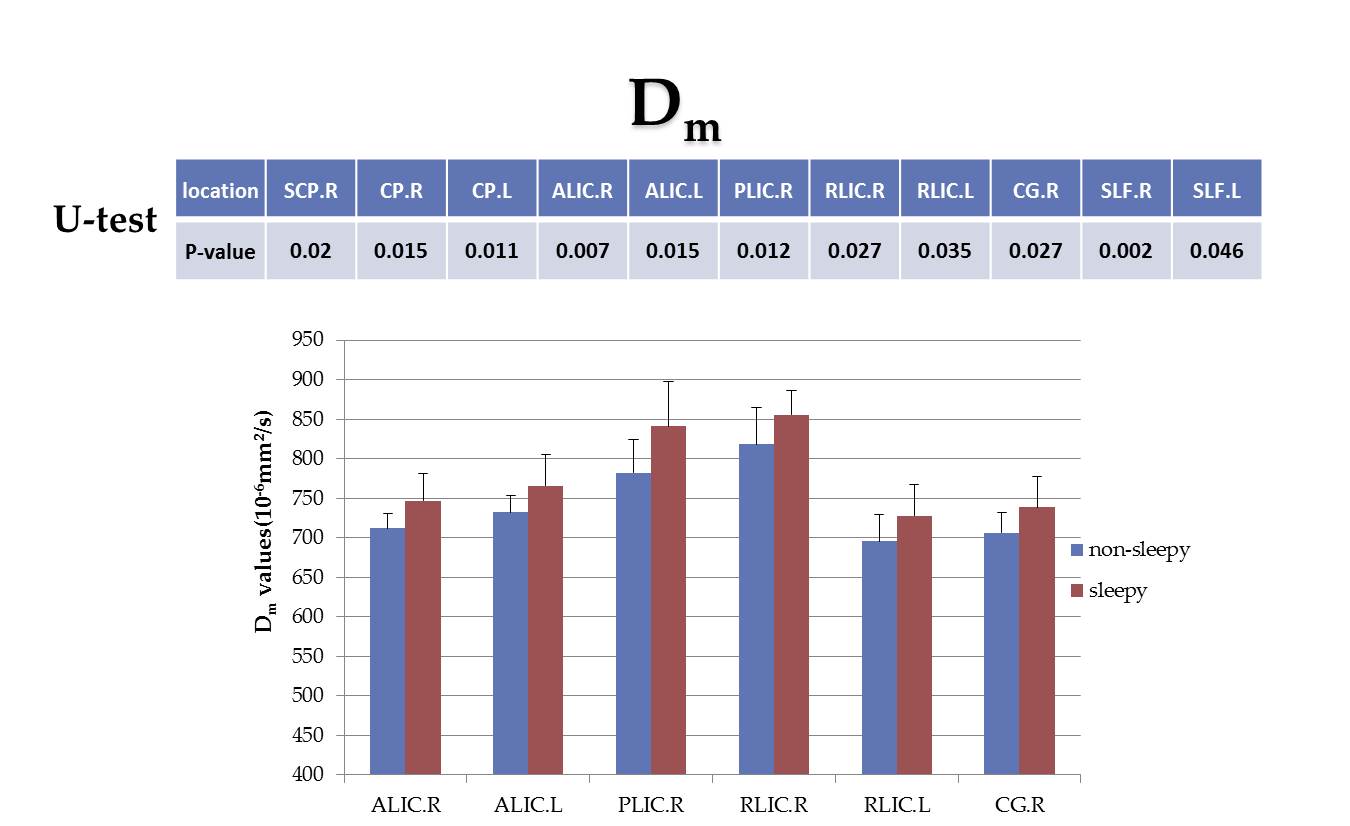
Figures 2-5 summarize the results from the regional fiber analysis, illustrating the individual fiber tracts that exhibited significant difference in α, β, Dm, and P0, respectively. The sleepy group showed a higher α and Dm, but lower β than the non-sleepy group in specific fiber tracts.
Discussion and Conclusion:
According to a previous study4, an elevated α value can be associated with a decrease in tissue heterogeneity, which can be an indication of tissue injury. The increased Dm is consistent with the elevated MD that was reported previously3. The results from both whole brain and regional fiber analyses substantiated these findings. Additionally, a decrease in β was observed in the sleepy group in several fiber tracts such as body of corpus callosum (BCC) and genu of corpus callosum (GCC) suggesting an increased fiber coherence and structural complexity (i.e., the axonal fiber structures become less uniform). This suggests that fiber structural changes in the sleepy group may be responsible for the lack of response to CPAP-treatment.
In conclusion, using a novel non-Gaussian diffusion model and a TBSS analysis, we have observed significant difference in WM both globally and regionally between the somnolent and non-somnolent patients with OSA following high-level CPAP-treatment. These new findings are expected to be useful in guiding the development of more effective treatments for OSA.
Acknowledgements
This work was supported in part by TEVA Pharmaceuticals, Inc. (TEW) and NIH-1S10RR028898 (XJZ). We thank Hagai Ganin for technical assistance and Drs. Kejia Cai, Rong-wen Tain, Liping Qi for valuable discussions.References
1. Jelic S, et al. Inflammation, oxidative stress, and repair capacity of the vascular endothelium in obstructive sleepapnea. Circulation. 2008; 117:2270–2278.
2. Castronovo V, et al. White matter integrity in obstructive sleep apnea before and after treatment. SLEEP. 2014; 37:1465–1475.
3. Xiong Y, et al. Brain White Matter Changes in CPAP-Treated Obstructive Sleep Apnea Patients With Residual Sleepiness. J Magn Reson Imaging. 2016; 00:000–000.
4. Karaman MM, et al. Differentiating low- and high-grade pediatric brain tumors using a continuous-time random-walk diffusion model at high b-values. Magn Reson Med. 2016; 76(4):1149-57.
5. Smith SM, Jenkinson M, Johansen-Berg H, et al. Tract-based spatial statistics: voxelwise analysis of multi-subject diffusion data. Neuro- image 2006; 31:1487–1505.
6. Basner M, et al. Maximizing sensitivity of the psychomotor vigilance test (PVT) to sleep loss. SLEEP. 2011; 34(5):581-591.
7. Mori S, et al. Stereotaxic white matter atlas based on diffusion tensor imaging in an ICBM template. Neuroimage. 2008; 40:570–582.
8. Menard SW. Applied Logistic Regression Analysis. Thousand Oaks, California: Sage Publications; 2001:1–120.
Figures