1733
Monte-Carlo Analysis of Quantitative Diffusion Measurements Using Motion-Compensated Diffusion Weighting Waveforms1Medical Physics, University of Wisconsin, Madison, Madison, WI, United States, 2Radiology, University of Wisconsin, Madison, Madison, WI, United States, 3Laboratorio de Procesado de Imagen, Universidad de Valladolid, Valladolid, Spain
Synopsis
Advanced diffusion MRI acquisition strategies based on motion-compensated diffusion-encoding waveforms have been proposed to reduce the signal voids caused by tissue motion. However, quantitative diffusion measurements obtained from these motion-compensated waveforms may be biased relative to standard monopolar gradient waveforms. This study evaluated the effect of different diffusion encoding gradient waveforms on the signal decay and diffusion measurements, using Monte-Carlo simulations with different microstructures and several reconstruction signal models. The results show substantial bias in observed signal decay and quantitative diffusion measurements in the same microstructure across different gradient waveforms, in the presence of restricted diffusion.
Target Audience
MR physicists and clinicians interested in quantitative diffusion imaging.Introduction
Diffusion encoding in MRI is typically performed using monopolar diffusion gradient waveforms, ie: by applying a gradient lobe before and after a refocusing RF pulse. However, this monopolar diffusion weighting waveform is known to be sensitive to cardiac and respiratory bulk motion, which induces signal voids in diffusion-weighted images as well as bias and variability in quantitative diffusion measurements1. In order to overcome this challenge, several diffusion weighting waveforms using gradient moment nulling have been proposed, including bipolar diffusion encoding2 and more recently the convex optimized diffusion encoding (CODE) method3. These motion-compensated gradient waveforms are designed to null the phase accumulation of spins moving with constant velocity (first order moment) or constant acceleration (second order moment). These waveforms, which have very different shape compared to the standard monopolar waveform, have been shown to produce diffusion-weighted images free of signal voids in moving tissue (eg: heart and liver). However, it is unknown whether these motion-compensated gradient waveforms will produce unbiased diffusion measurements compared to the standard monopolar waveform, particularly in the presence of non-Gaussian (eg: restricted) diffusion in biological tissue4. Therefore, the purpose of this work is to characterize the bias of diffusion measurements relative to standard monopolar gradient waveform across different motion-compensated diffusion encoding waveforms using Monte-Carlo simulations.Method
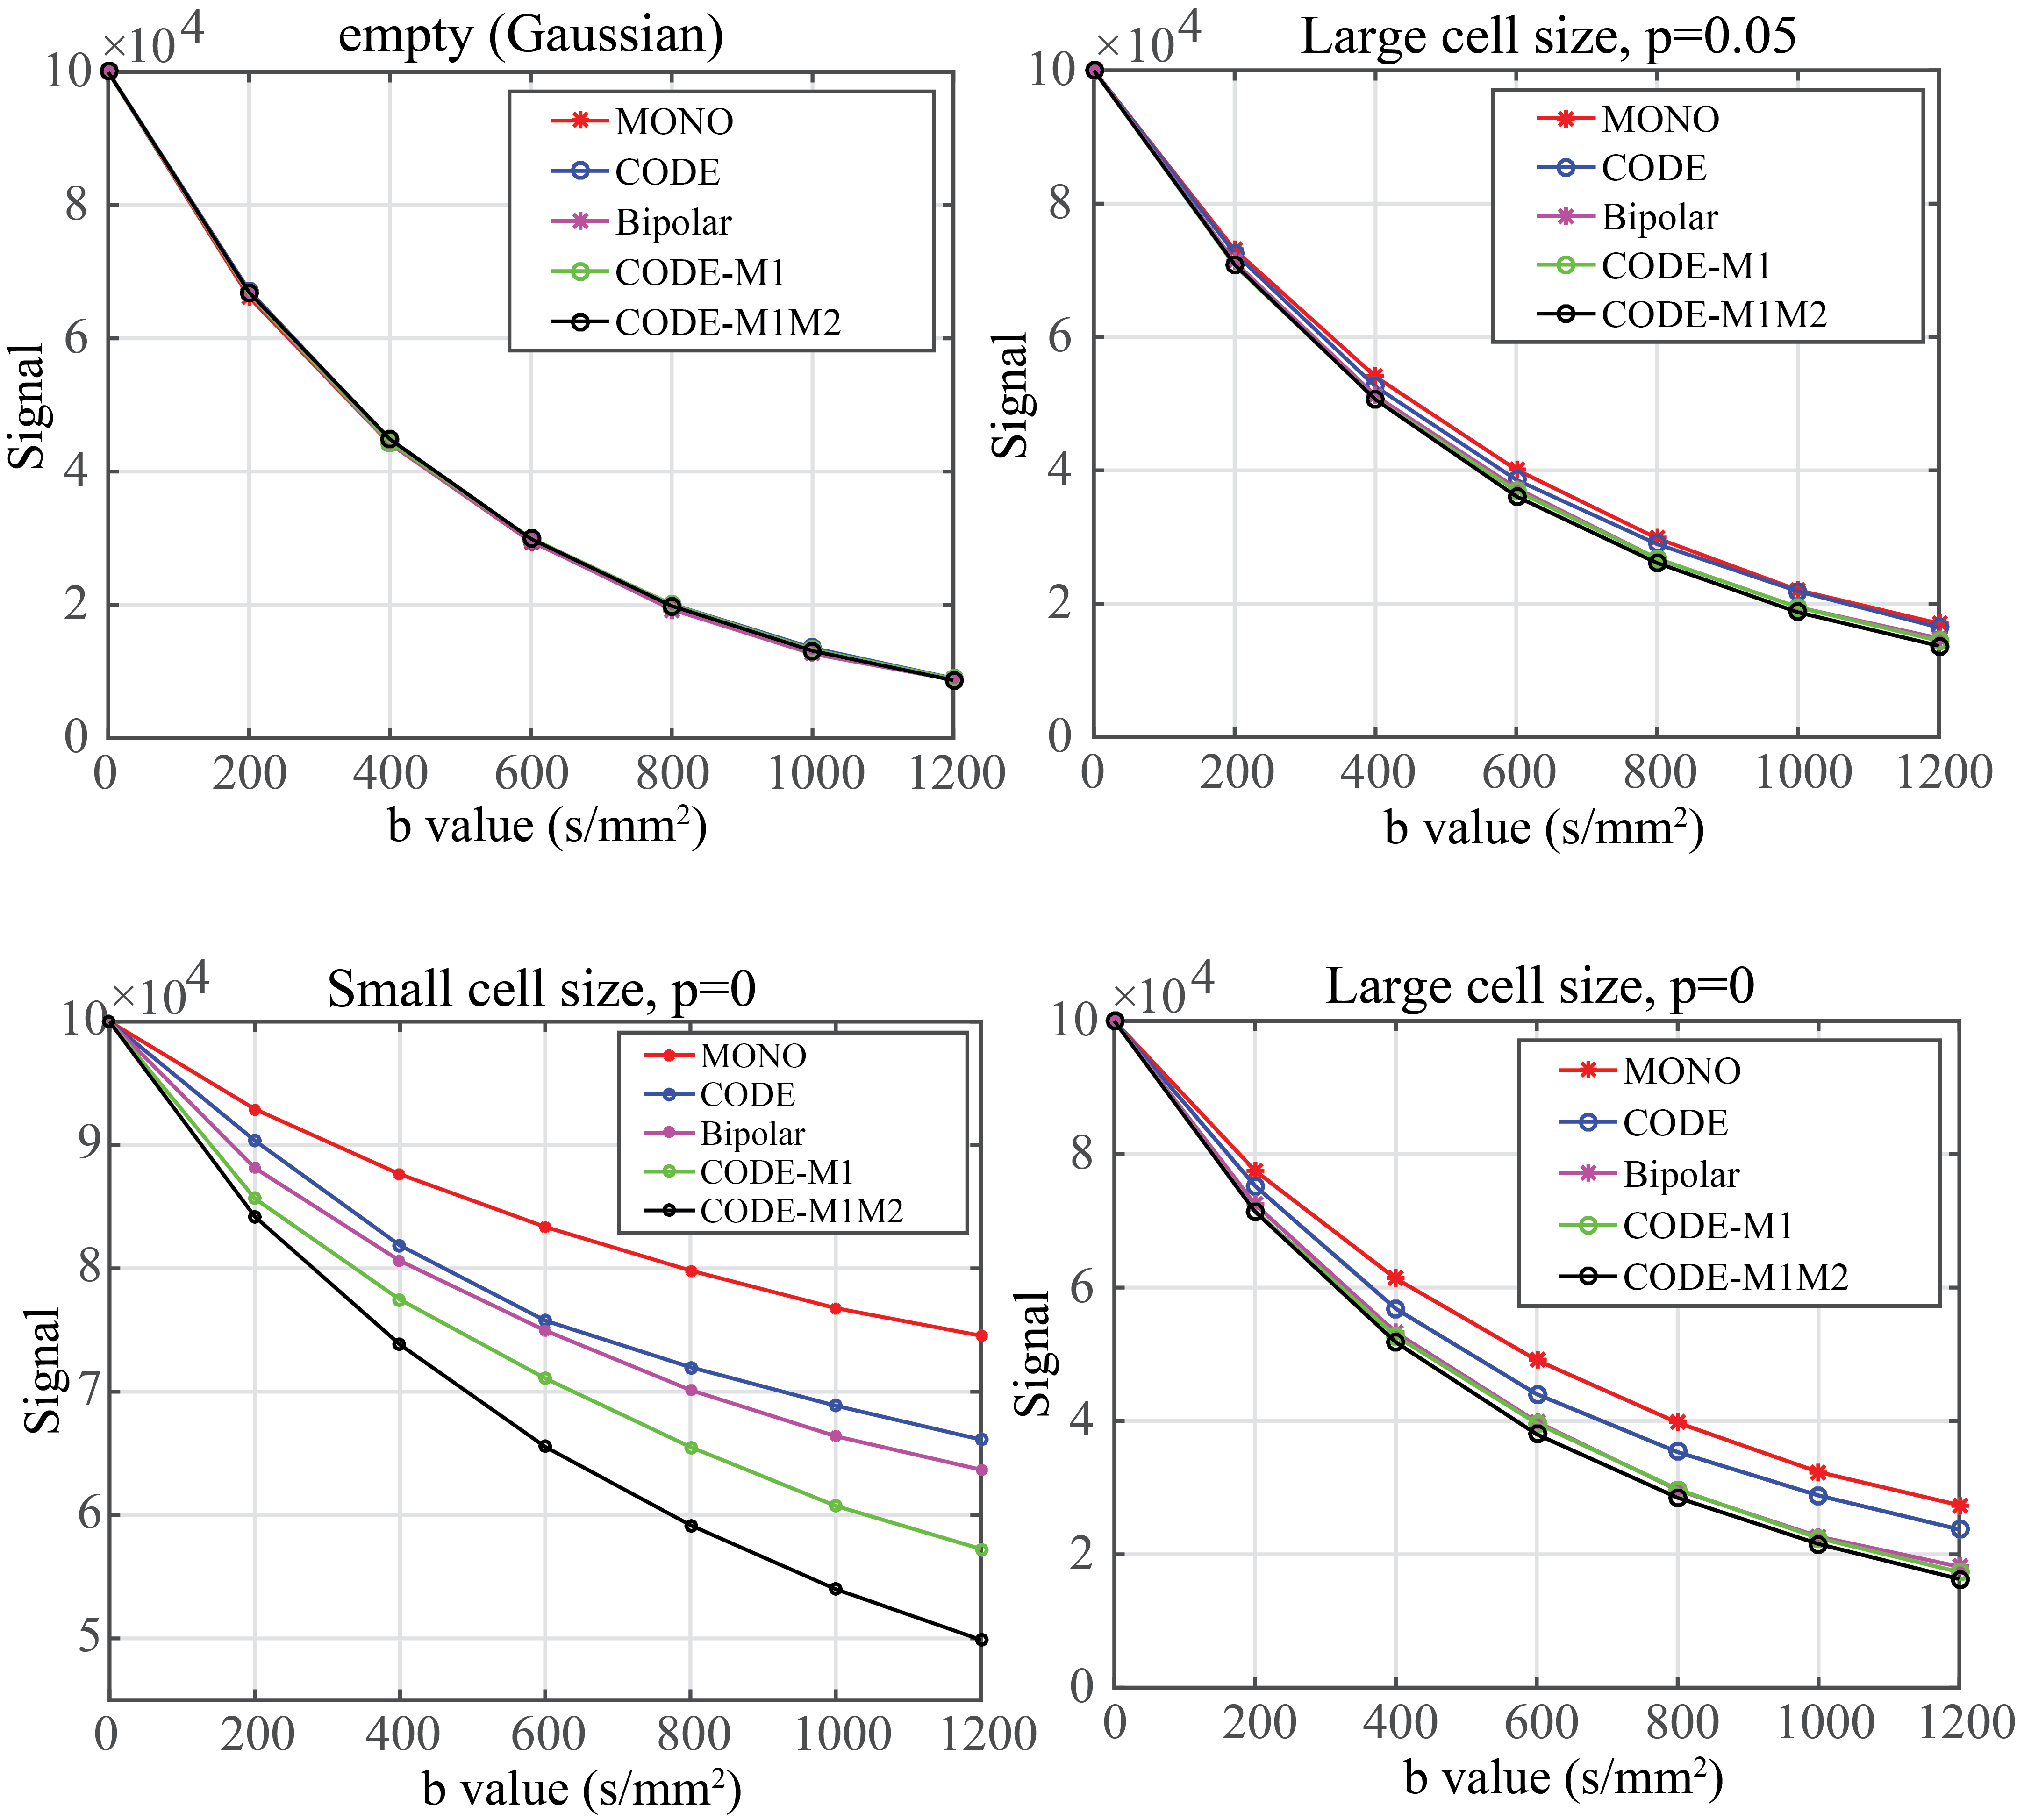
Monte-Carlo simulations were performed based on the CAMINO package5. Different tissue microstructures were simulated with different cell size (diameter=20$$${\mu{m}}$$$, separation=42$$${\mu{m}}$$$ for large cell and diameter=5$$${\mu{m}}$$$, separation=11$$${\mu{m}}$$$ for small cell size) and varying permeability of the cell boundaries. Permeability in this simulation was defined as the probability that a spin would pass through the cell membrane, ranging from p=0 (pure restricted intra-cellular diffusion) to p=1 (pure unrestricted Gaussian diffusion).
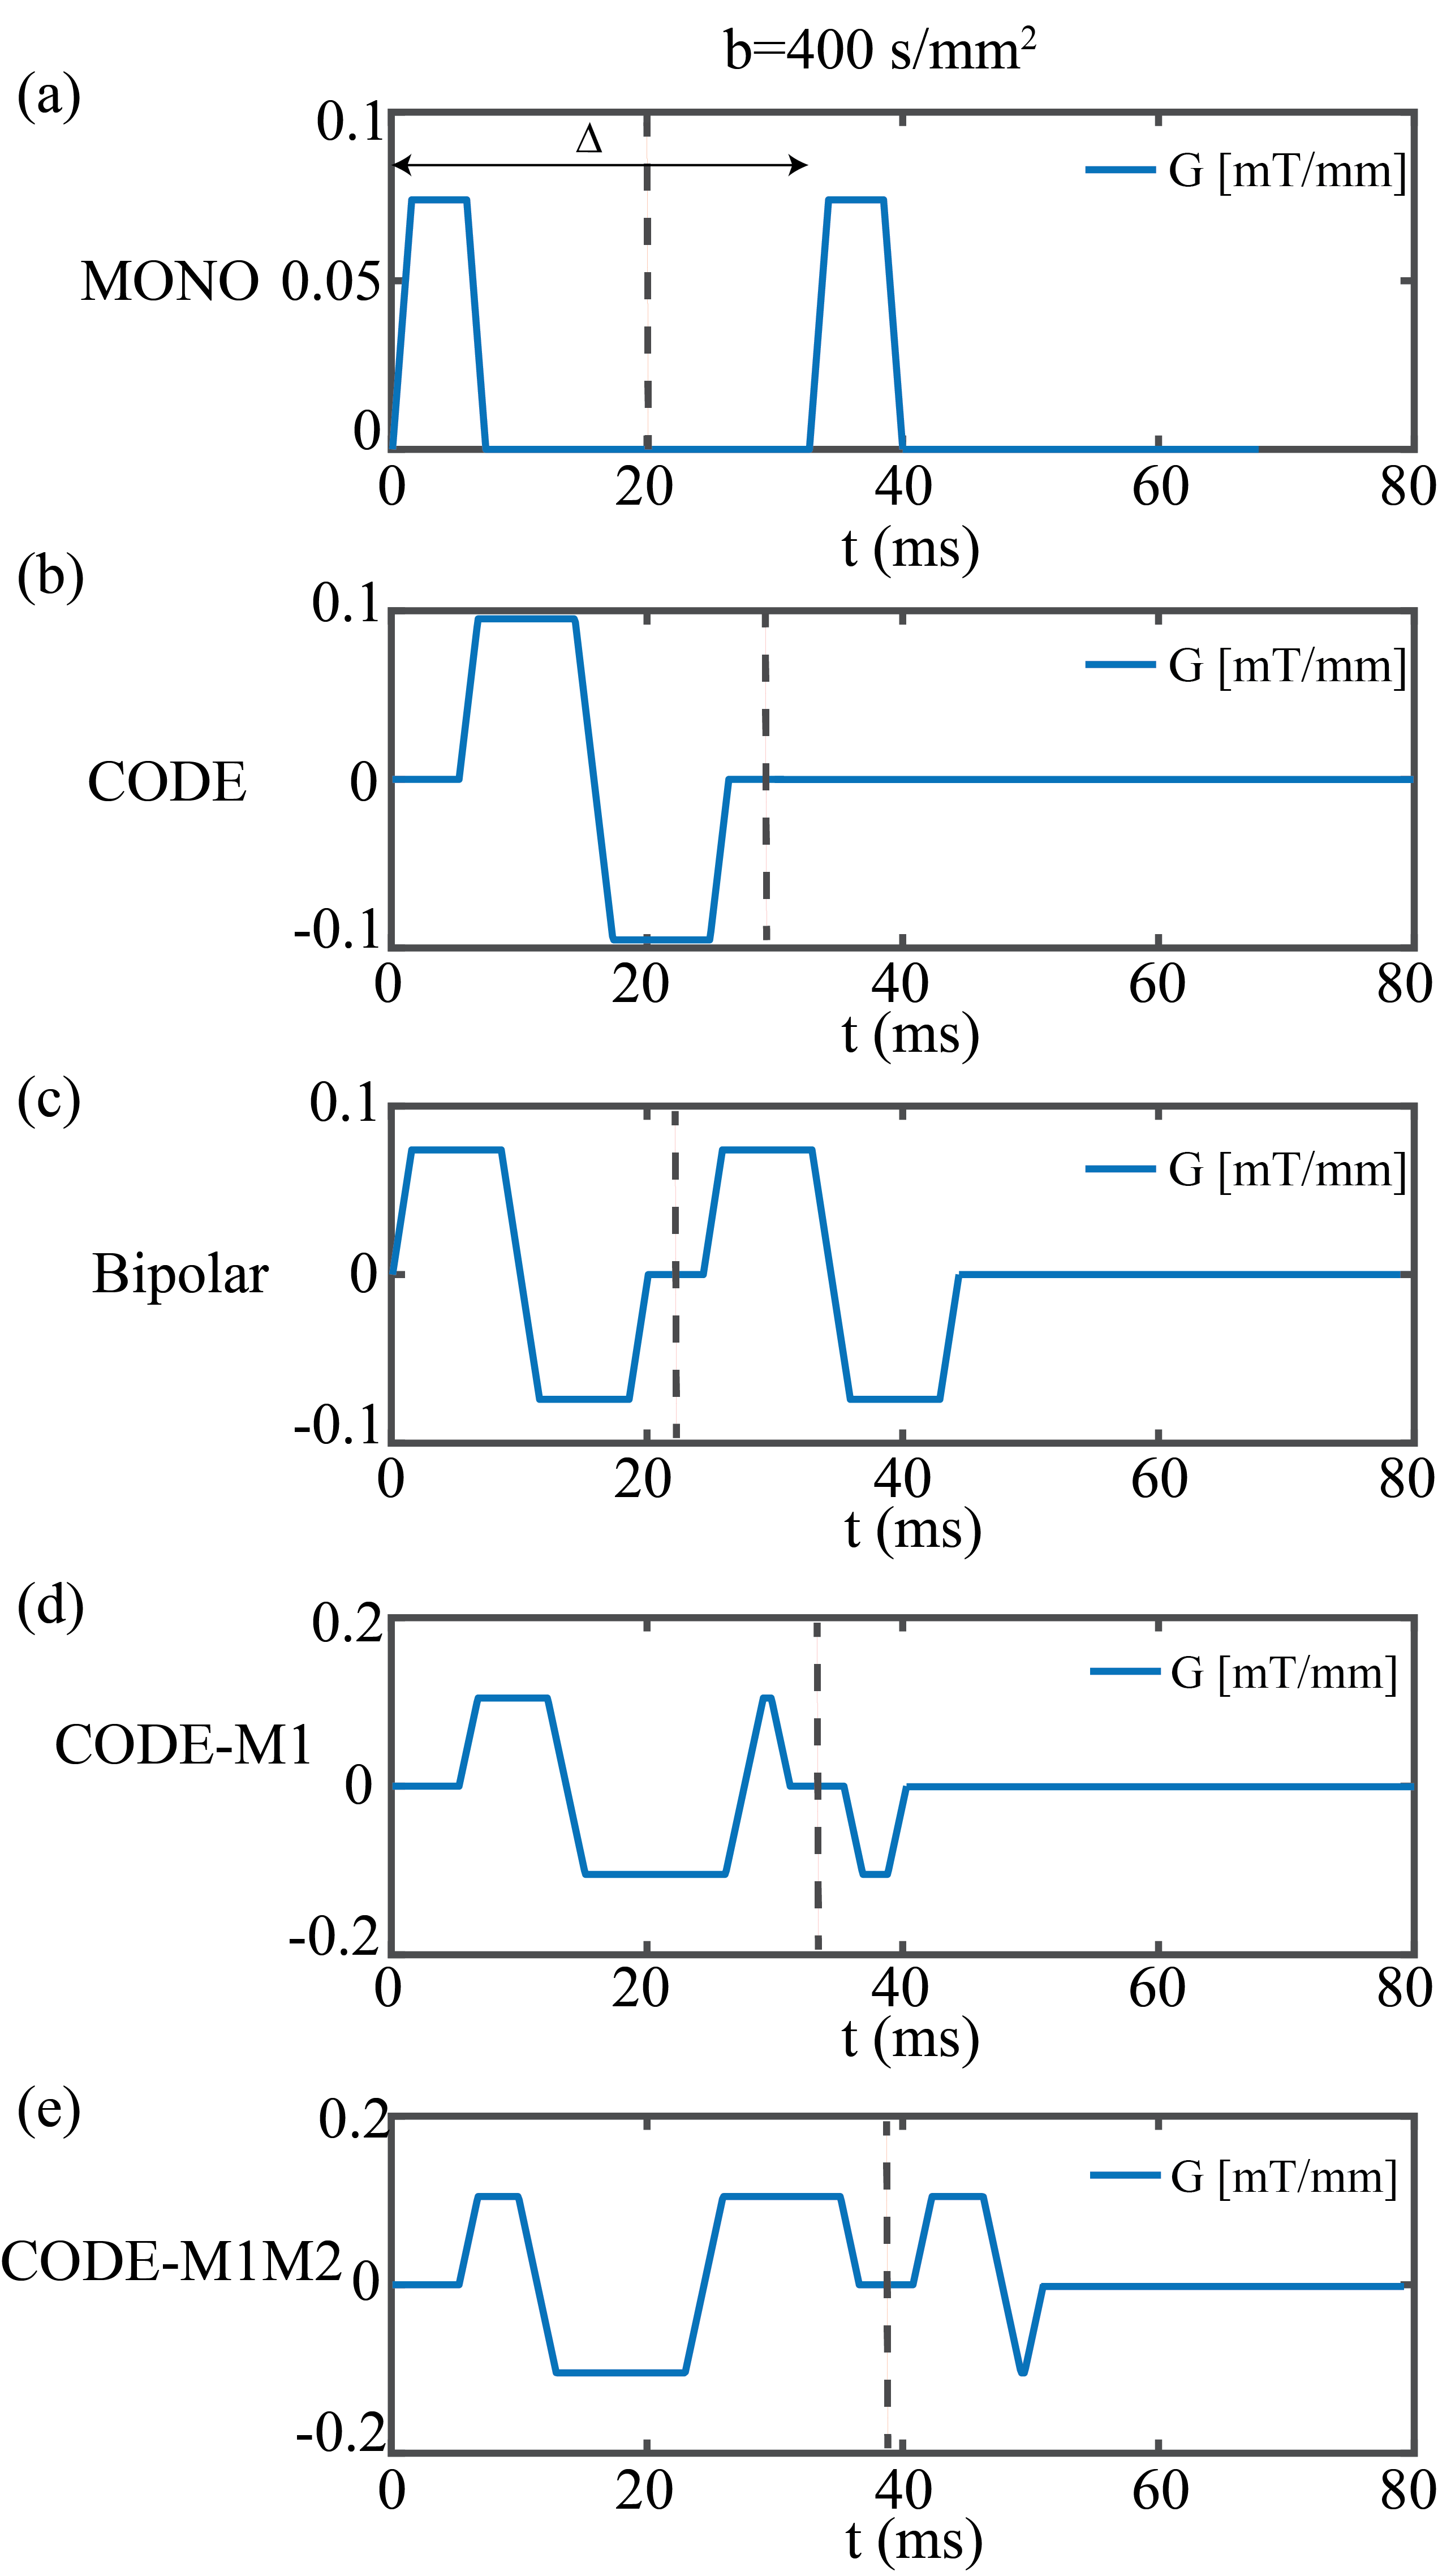
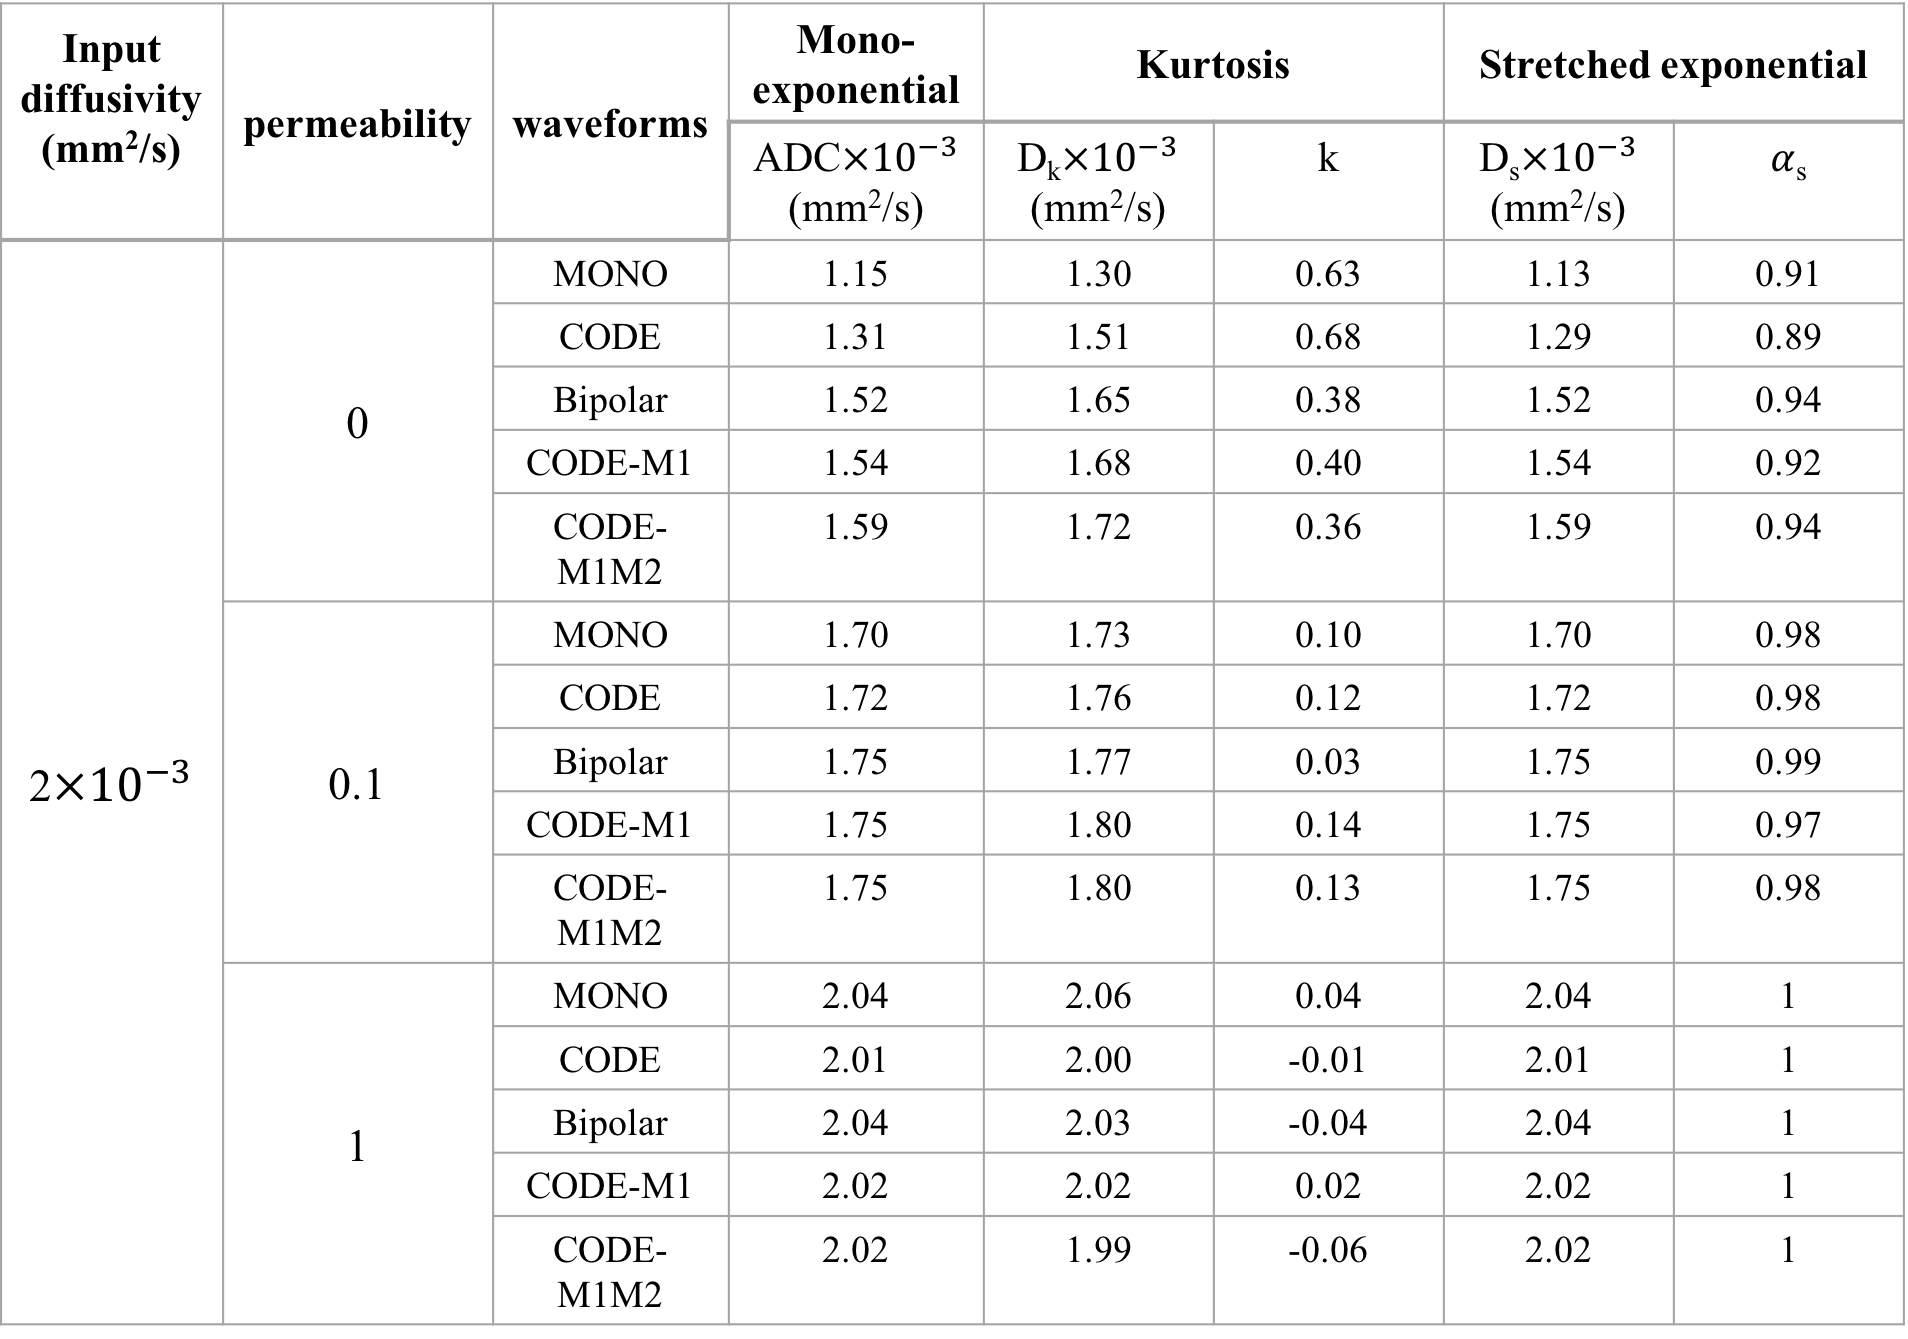
Five different diffusion gradient waveforms with the same set of b-values and the same diffusivity (2$$${\times}$$$10-3$$${mm^{2}/s}$$$) and initial spins (105) were applied to each microstructure. The five waveforms (Fig.1) were designed with monopolar diffusion gradient (MONO), no motion-compensation CODE (CODE)3, first moment nulling bipolar gradient (Bipolar)2, first moment nulling CODE (CODE-M1) and both first and second moment nulling CODE (CODE-M1M2), respectively.
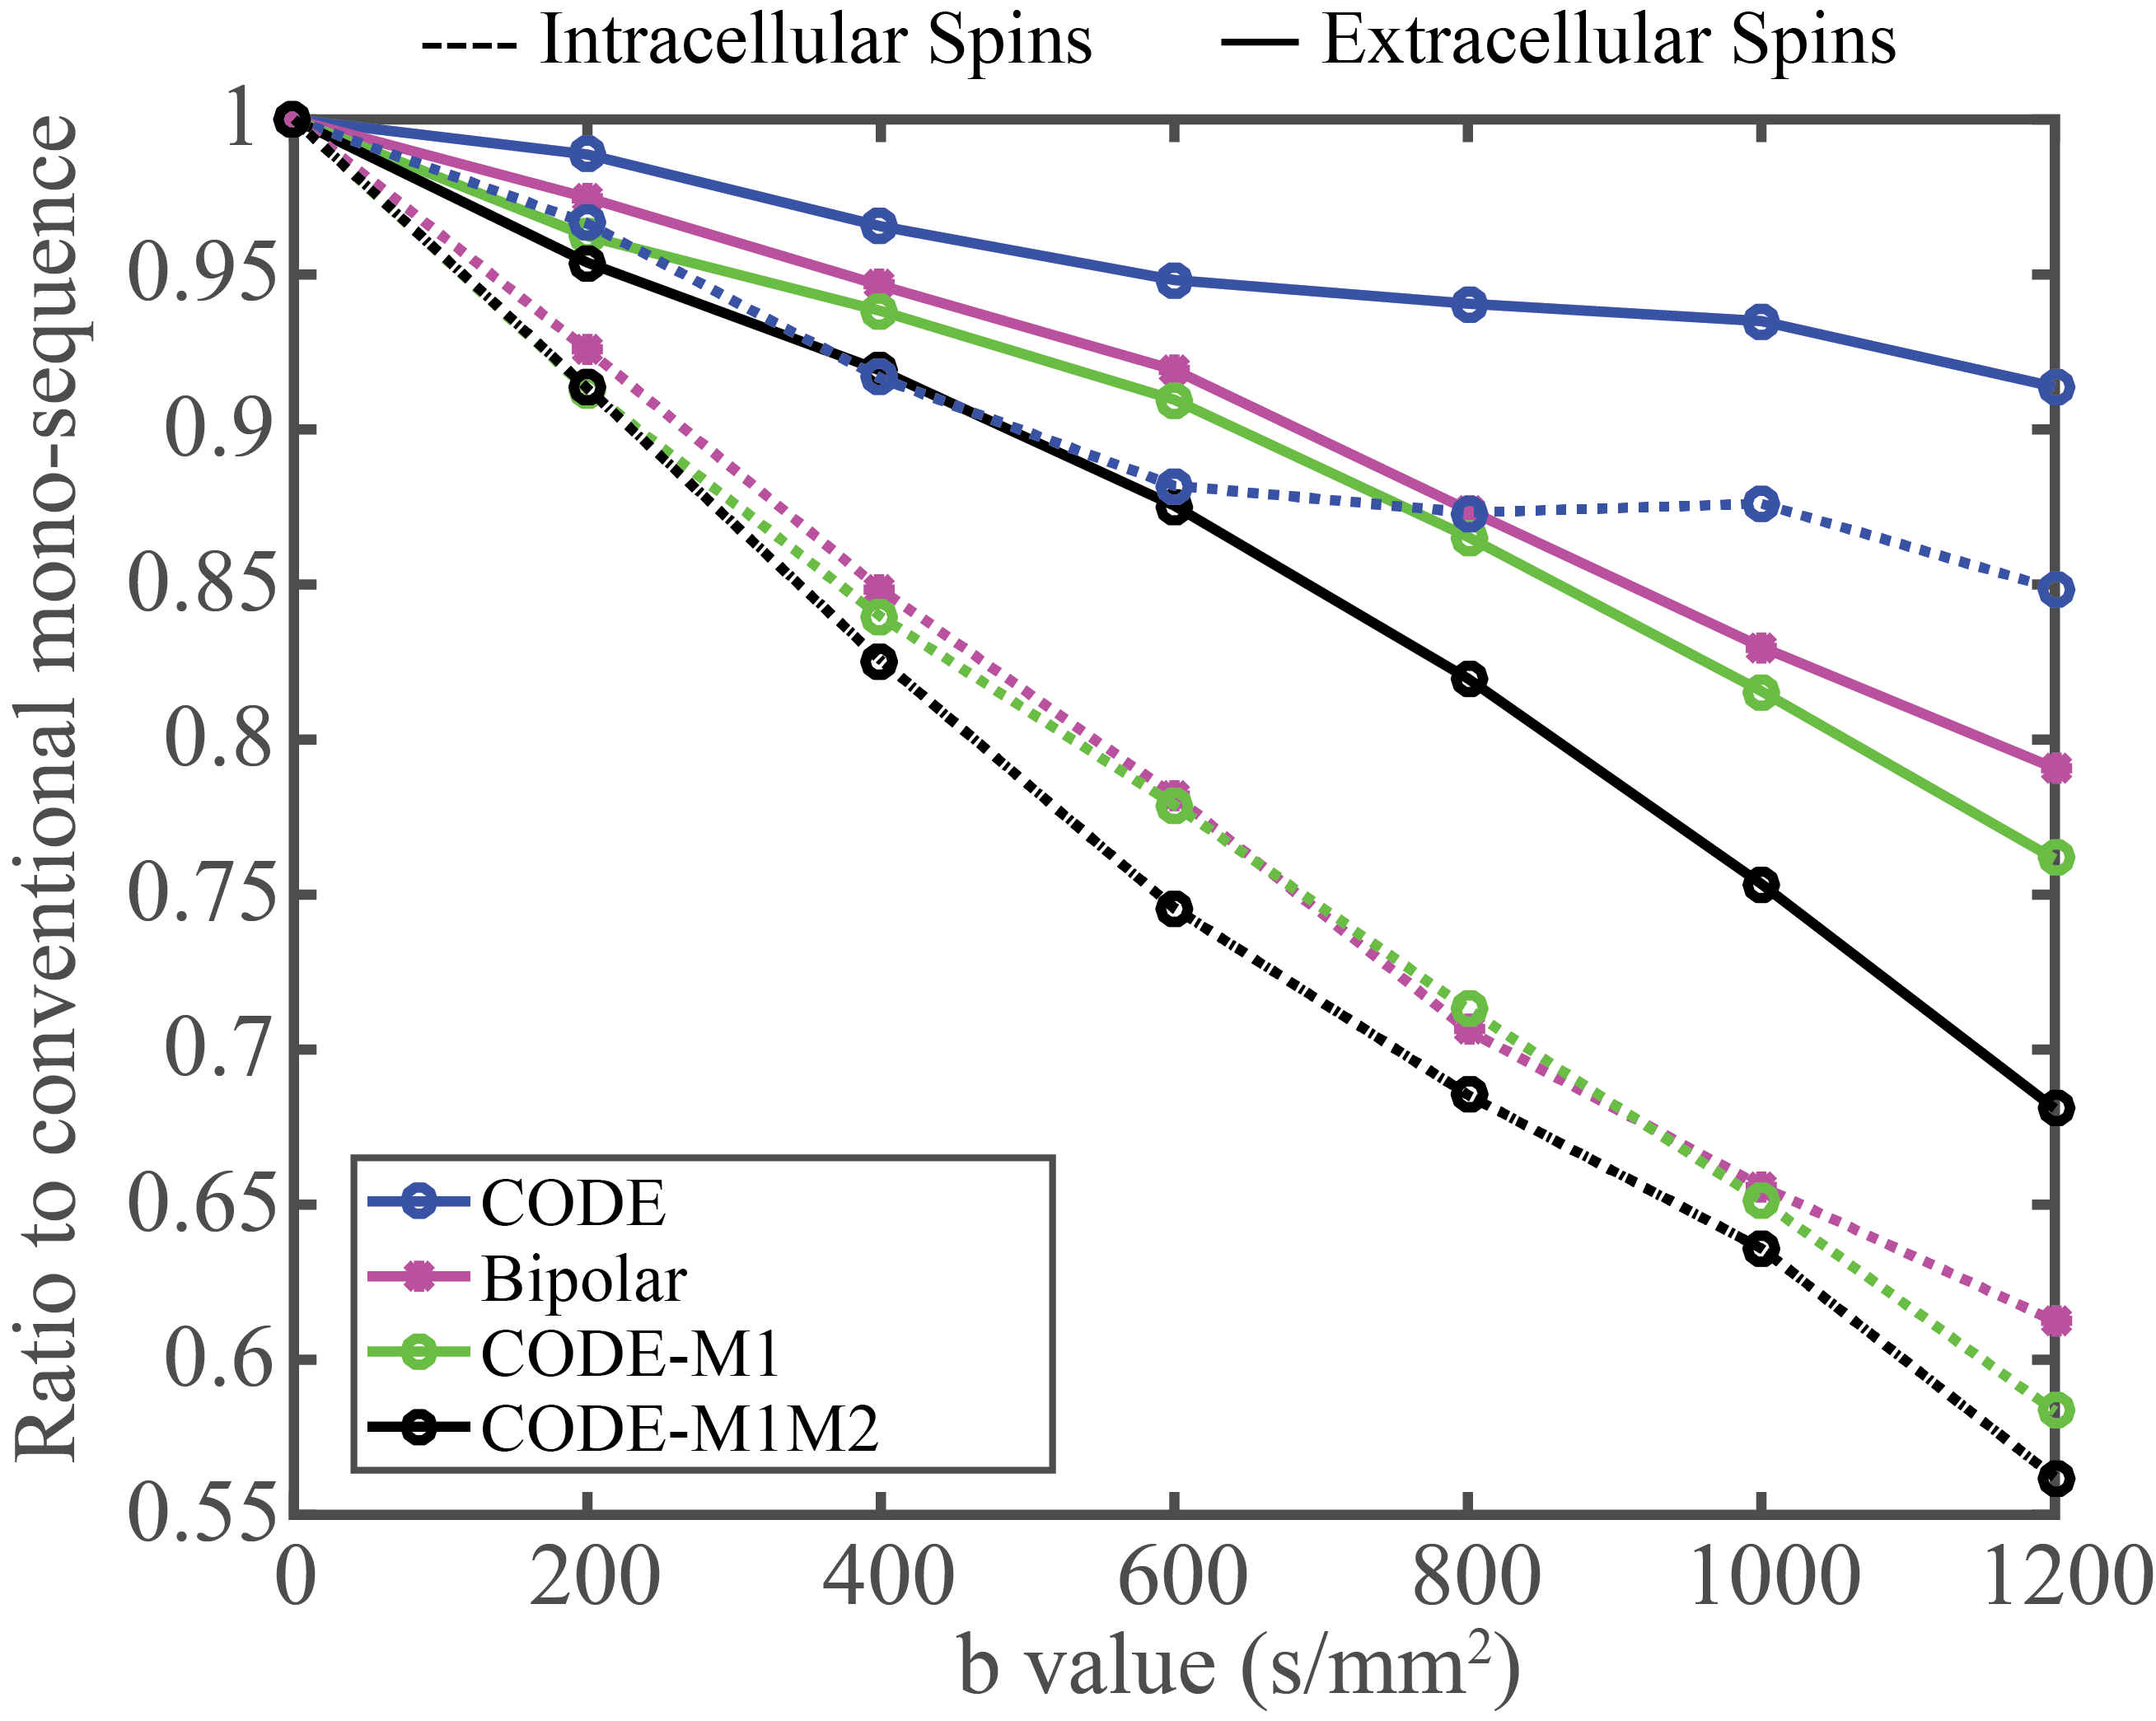
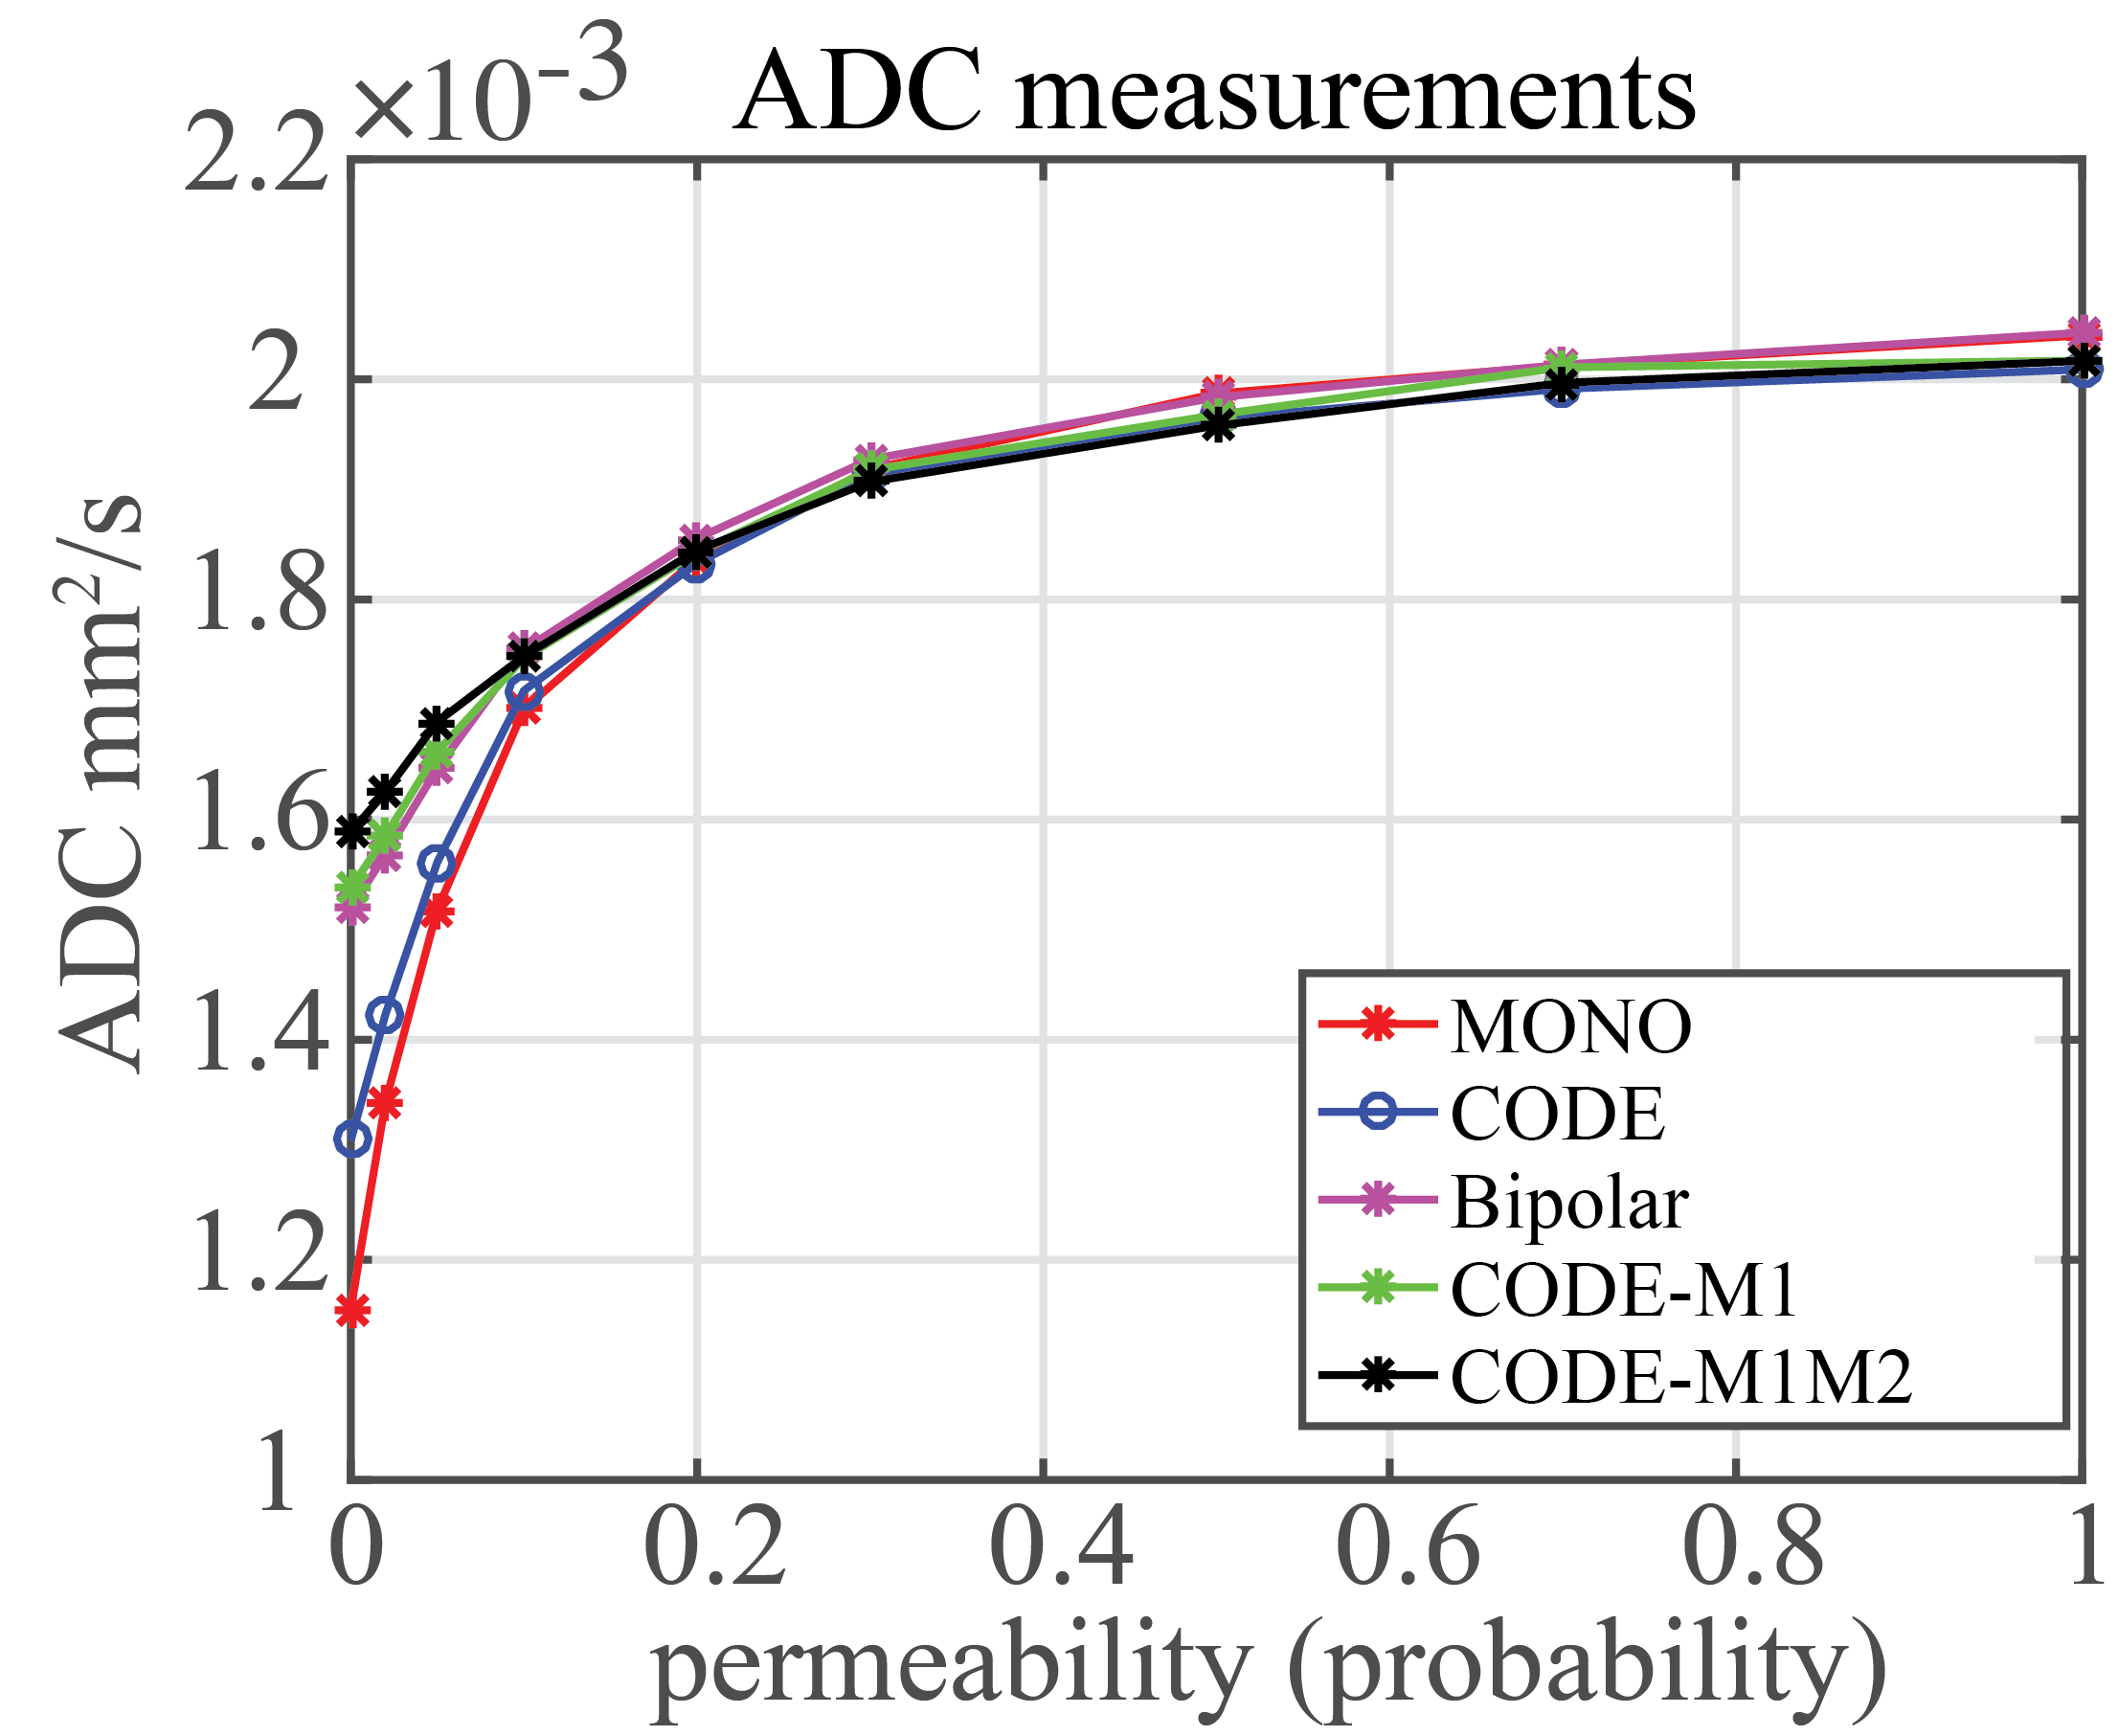
Signal with increasing b-values for each combination of microstructure and gradient waveform was simulated with CAMINO. To illustrate the different effects of diffusion waveforms on intra-cellular and extra-cellular spins with restricted diffusion, the signal ratio was calculated for both intra-cellular and extra-cellular spins with uniformly distributed large cell structure (p=0).$$R=\frac{Signal\,of\,intra-\,(or\,extra-)\,cellular\,spins\,with\,each\,waveform}{Signal\,of\,intra-\,(or\,extra-)\,cellular\,spins\,with\,monopolar\,diffusion\,sequence}.$$To compare the resulting quantitative diffusion measurements, diffusion parameters were estimated by least-squares fitting using three different diffusion MRI signal models: mono-exponential, kurtosis6, and stretched exponential7, respectively.
Results
Fig.2 shows the signal decay with different microstructure and pulse sequence combinations. The effects of different waveforms to intra-cellular and extra-cellular spins are illustrated in Fig.3. ADC values estimated from five different sequences are plotted for varying permeability of the cell membranes (Fig.4). Other diffusion parameters estimated with mono-exponential model (ADC), kurtosis model ($$${D_k}$$$,$$$k$$$) and stretched exponential model ($$$D_s$$$,$$${\alpha_{s}}$$$) for three values of cell membrane permeability (p=0, p=0.1 and p=1), are listed in Table 1.Discussion
This study demonstrated bias in signal and quantitative diffusion measurements with different models in the same microstructure across different gradient waveforms, in the presence of restricted diffusion. As shown in previous studies, cell permeability is typically very small, ie: diffusion inside cells is highly restricted8. Therefore, the bias observed in this work may have important consequences for the clinical accuracy and reproducibility of quantitative diffusion MRI performed with different diffusion waveforms. Previous studies9-11 have reported significantly lower diffusivity measurements using monopolar diffusion waveforms than bipolar waveforms. These results are in good qualitative agreement with our Monte-Carlo results. Importantly, the different sensitivity of various diffusion waveforms to microstructres might have application to the characterization of non-Gaussian diffusion in healthy and diseased tissue.
This study had several limitations. In addition to the shape of the waveforms themselves, moderate differences in diffusion times (within 15ms) across gradient waveforms may contribute to the observed variability in quantitative diffusion parameters. Although it is challenging to separate the effects of waveform shape and diffusion time, the variability observed in this work suggests that applying different waveforms results in different observed quantitative diffusion parameters in the presence of restricted diffusion. In addition, the Monte-Carlo simulation did not model micro-perfusion effects, eg: intra-voxel incoherent motion. Future Monte-Carlo studies including micro-perfusion effects are needed, as the quantification of these effects might be affected substantially by the choice of diffusion encoding waveform.
Conclusion
In this study, quantitative diffusion measurements demonstrate substantial bias across various motion-compensated diffusion weighting waveforms relative to the standard monopolar waveform.Acknowledgements
No acknowledgement found.References
[1] Murphy, P., Wolfson, T., Gamst, A., Sirlin, C., & Bydder, M. (2013). Error model for reduction of cardiac and respiratory motion effects in quantitative liver DW-MRI. Magnetic resonance in medicine, 70(5), 1460-1469.
[2] Stoeck, C. T., Von Deuster, C., Genet, M., Atkinson, D., & Kozerke, S. (2015). Second-order motion-compensated spin echo diffusion tensor imaging of the human heart. Magnetic resonance in medicine.
[3] Aliotta, E., Wu, H. H., & Ennis, D. B. (2016). Convex optimized diffusion encoding (CODE) gradient waveforms for minimum echo time and bulk motion–compensated diffusion-weighted MRI. Magnetic resonance in medicine.
[4] Helpern, J.A., Ordidge, R.J and Knight RA. (1992). The effect of cell membrane water permeability on the apparent diffusioncoefficient of water. 11th ISMRM.
[5] Cook, P. A., Bai, Y. Nedjati-Gilani, et. al. (2006). Camino: open-source diffusion-MRI reconstruction and processing. In 14th scientific meeting of the international society for magnetic resonance in medicine (Vol. 2759). Seattle WA, USA.
[6] Jensen, J. H., Helpern, J. A., Ramani, A., Lu, H., & Kaczynski, K. (2005). Diffusional kurtosis imaging: The quantification of non-gaussian water diffusion by means of magnetic resonance imaging. Magnetic Resonance in Medicine, 53(6), 1432-1440.
[7] Bennett, K. M., Schmainda, K. M., Rowe, D. B., Lu, H., & Hyde, J. S. (2003). Characterization of continuously distributed cortical water diffusion rates with a stretched-exponential model. Magnetic resonance in medicine, 50(4), 727-734.
[8] Stanisz, G. J. (2003). Diffusion MR in biological systems: tissue compartments and exchange. Israel journal of chemistry, 43(1-2), 33-44.
[9] Rosenkrantz, A. B., Geppert, C., Kiritsy, M., Feiweier, T., Mossa, D. J., & Chandarana, H. (2015). Diffusion-weighted imaging of the liver: comparison of image quality between monopolar and bipolar acquisition schemes at 3T. Abdominal imaging, 40(2), 289-298.
[10] Dyvorne, H. A., Galea, N., Nevers, T., Fiel, M. I., Carpenter, D., Wong, E., ... & Babb, J. S. (2013). Diffusion-weighted imaging of the liver with multiple b values: effect of diffusion gradient polarity and breathing acquisition on image quality and intravoxel incoherent motion parameters—a pilot study. Radiology, 266(3), 920-929.
[11] Kyriazi, S., Blackledge, M., & Collins, D. J. (2010). Optimising diffusion-weighted imaging in the abdomen and pelvis: comparison of image quality between monopolar and bipolar single-shot spin-echo echo-planar sequences. European radiology, 20(10), 2422-2431.
Figures