1730
Hybrid Modeling for Perfusion Quantification Using Intravoxel Incoherent Motion MRI1Human Brain Research Center, Kyoto University Graduate School of Medicine, Kyoto, Japan, 2Training Program of Leaders for Integrated Medical System, Kyoto University, Kyoto, Japan, 3Neurospin, Gif-sur-Yvette, France
Synopsis
IVIM-MRI has been used to estimate perfusion-relative parameters. To increase signal fitting robustness in case of limited SNR, an asymptotic method was recommended. Hence, with the asymptotic method, a threshold b-value should be determined above which flow contamination is deemed negligible. Various diffusion models and a wide range of values for this threshold can be found in the literature. These two effects on quantification were investigated using both computer simulations and human brain data. The results showed that the choice of the model and the threshold critically influenced the quantitative parameters. We proposed a hybrid-modeling method to minimize systematic errors.
Introduction
Intravoxel Incoherent Motion (IVIM) MRI has been used to estimate perfusion-relative parameters. To increase signal fitting robustness in case of limited signal-to-noise ratio(SNR), a two-step asymptotic method was recommended, one for the diffusion part of the signal (higher b values), the other for the IVIM part (lower b values) 1,2. Hence, with the asymptotic method, a threshold b-value (bth)should be determined above which flow contamination is deemed negligible. Various diffusion modelings and a wide range of values for this threshold can found in the literature 3-6. In this study, we proposed a hybrid modeling method for perfusion quantification. The effect and the reproducibility of this threshold b-value on the physiological parameter estimates were investigated using both computer simulations and human brain data.
Methods and Materials
The IVIM/non Gaussian diffusion MRI signals were modeled by using a two-compartment model,
S(b) = S0 [(1-f) E(b) + f F(b)] [1]
,where S is the MRI signal, f is the flowing blood fraction, E and F are the extra- and intra- vascular components, respectively. In this study, F was modeled by using a monoexponential function of exp[-b (Db+Dp)] where Db is the virtual apparent diffusion coefficient of blood (=1.7 × 10⁻³ mm2 /s) and Dp is the pseudodiffusion coefficient associated to flowing blood. To model the extravascular component, a non-Gaussian model based on a gamma distribution of diffusion coefficients was used 6:
E(b) =(1+bDtK/3)-3/K [2]
where K is the kurtosis and Dt is the virtual apparent diffusion coefficient of tissue when b approaches 0. The E(b) can be expanded to approximate two frequently used diffusion models by Taylor series:
E(b) ≈ exp(-bDt) [3]
and
E(b) ≈ exp(-bDt + b2Dt2 K/6) [4].
Signals were simulated using the following b-values: 0,10,30,50,100,200,300,400,500,600,700,800,1000,1200,1400,1600,1800,2000,2250,2500s/mm2. The SNR of 210 were simulated by adding Rician noise to the signal. One thousand repeats of each condition were performed with the following parameter values: f=0.1, Dp=10μm2/ms, Dt=1μm2/ms, and K=1. Experimental data were obtained on Six healthy volunteers (one female) using a 3.0T scanner (Trio, Siemens) with a 12-channel phase array head coil. The IVIM/diffusion weighted images were obtained with same b-values as the simulation study with the following parameters: TR/TE=2,500/67 ms; flip angle=90 degrees; pixel size, 3.4375x3.4375mm² ; matrix=64x 64; slice thickness=5mm; 22slices, gap=6mm. Ten sets were acquired for each subject to assess the reproducibility and for averaging. The bth of 100 to 800 s/mm2 were used to estimate Dt, K, and f, simultaneously. Then Dp was evaluated by using all b-values from the residual signal obtained by subtracting the fitted diffusion signals from the raw DWI signals. Physiological parameters were calculated using Eq.[1] with three different diffusion models (Eq.[2-4]). The corrected Akaike information criterion (AICc) was used to rank results obtained using each threshold b-value 7. Based on the AICc information, a hybrid modeling method was applied. The hybrid maps were generated by combining voxels with the lowest AICc in the three models.
Results
The simulation showed that low threshold b-values could yield underestimations of f (Fig 1a), and overestimations of Dp (Fig 1b), Dt (Fig. 1c), and K (Fig. 1d). The COV increased by increasing bth due to decreasing the candidate data of the first step of the asymptotic analysis (Fig. 1 e-g). The results of experimental ROI analysis demonstrated a similar tendency with the simulations (Figure 2). In the experimental data, the Gamma model (Eq.[2]) showed lower AICc in gray matter and higher AICc in white matter compared with the Kurtosis model (Eq.[4]) (Fig.3 a). The Gaussian model (Eq.[3]) showed highest AICc compared with other two models (Fig.3 b, c). Figure 4 showed the parametric maps of one subject analyzed with bth = 800, s/mm2. The hybrid modeling combined the results of the Gamma model (gray matter) and the Kurtosis model (white matter) based on the optimal AICc. Figure 5 summarized the quantification results of gray matter and white matter of the six subjects using the hybrid modeling method. The AICc over all showed minimum values with bth of 800s/mm2 (Fig 5 e).Discussion
Inappropriate threshold b-values may cause large estimation errors from IVIM flow contamination and noise when using the asymptotic fitting method in IVIM/non Gaussian diffusion MRI. To avoid under/overestimation of IVIM/diffusion parameters high threshold b-values should be preferred. However, the noise level and the number of remaining b values above threshold would limit the precision of the estimated parameters. For quantification, the proposed hybrid modeling method provided a region specific analysis to minimize systematic errors from the inappropriate model.Acknowledgements
No acknowledgement found.References
1. Wirestam R, Borg M, Brockstedt S, Lindgren A, Holtås S, Ståhlberg F. Perfusion-related parameters in intravoxel incoherent motion MR imaging compared with CBV and CBF measured by dynamic susceptibilitycontrast MR technique.Acta Radiol. 2001 Mar;42(2):123-8.
2. Cho GY, Kim S, Jensen JH, Storey P, Sodickson DK, Sigmund EE. A versatile flow phantom for intravoxel incoherent motion MRI. Magn Reson Med. 2012 Jun;67(6):1710-20
3. Koh DM, Collins DJ, Orton MR. Intravoxel Incoherent Motion in Body Diffusion-Weighted MRI: Reality and Challenges. AJR Am J Roentgenol. 2011 Jun;196(6):1351-61
4. Iima M, Yano K, Kataoka M, Umehana M, Murata K, Kanao S, Togashi K, Le Bihan D. Quantitative Non-Gaussian Diffusion and Intravoxel Incoherent Motion Magnetic Resonance Imaging Differentiation of Malignant and Benign Breast Lesions. Invest Radiol. 2015 Apr;50(4):205-11
5. Suo S, Lin N, Wang H, Zhang L, Wang R, Zhang S, Hua J, Xu J. Intravoxel Incoherent Motion Diffusion-Weighted MR Imaging of Breast Cancer at 3.0 Tesla: Comparison of Different Curve-Fitting Methods. J Magn Reson Imaging. 2015 Aug;42(2):362-70.
6. Jens H. Jensen, and Joseph A. Helperna, MRI quantification of non-Gaussian water diffusion by kurtosis analysis. NMR Biomed. 2010 Aug;23(7):698-710. doi: 10.1002/nbm.1518.
7. Akaike. A New Look at the Statistical Model Identification. IEEE. 1974: 19(6): 716-23
Figures
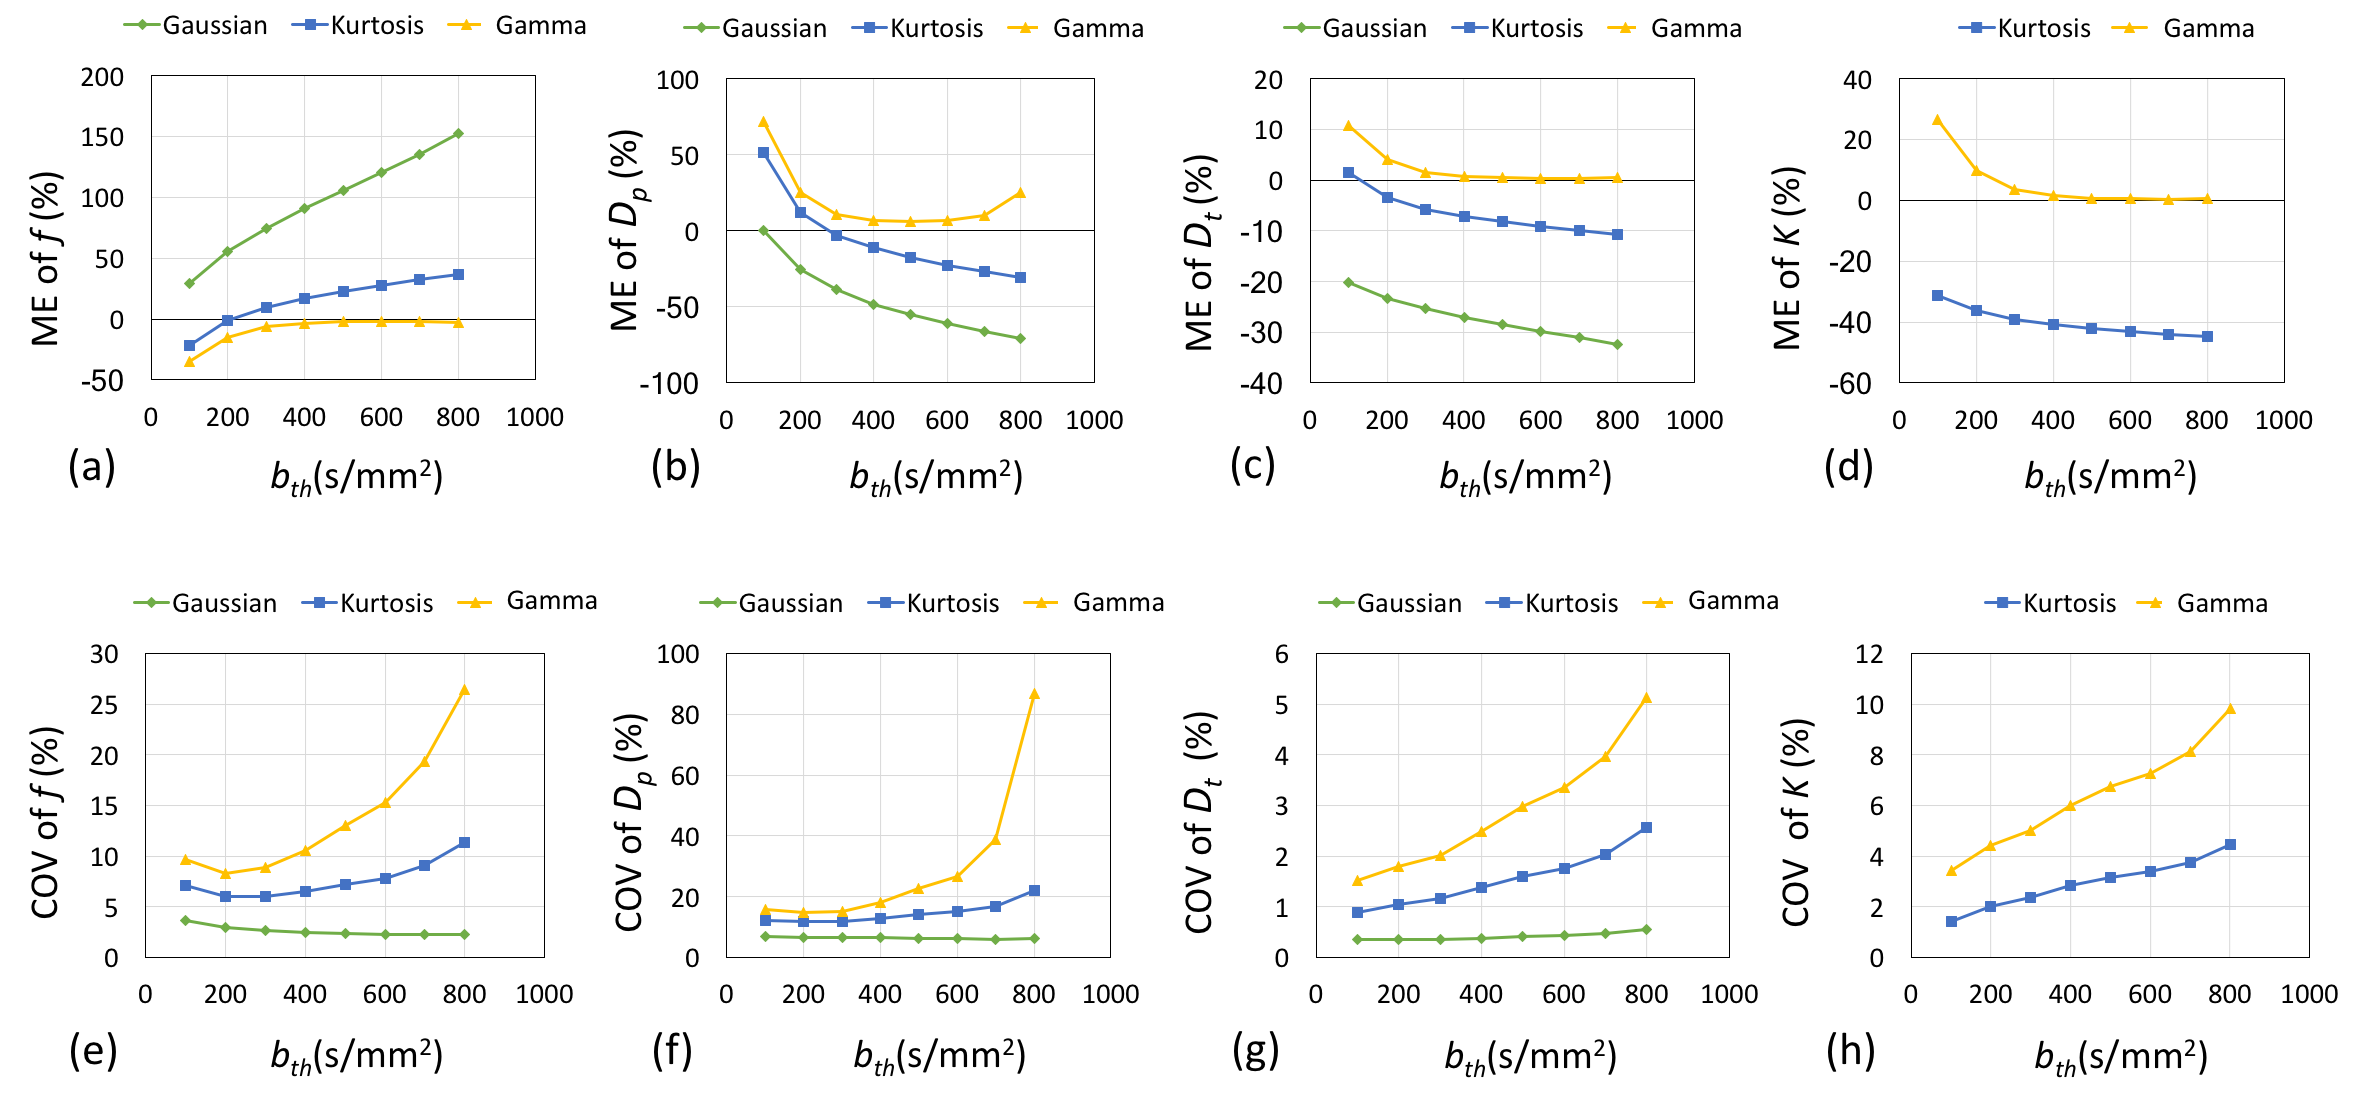
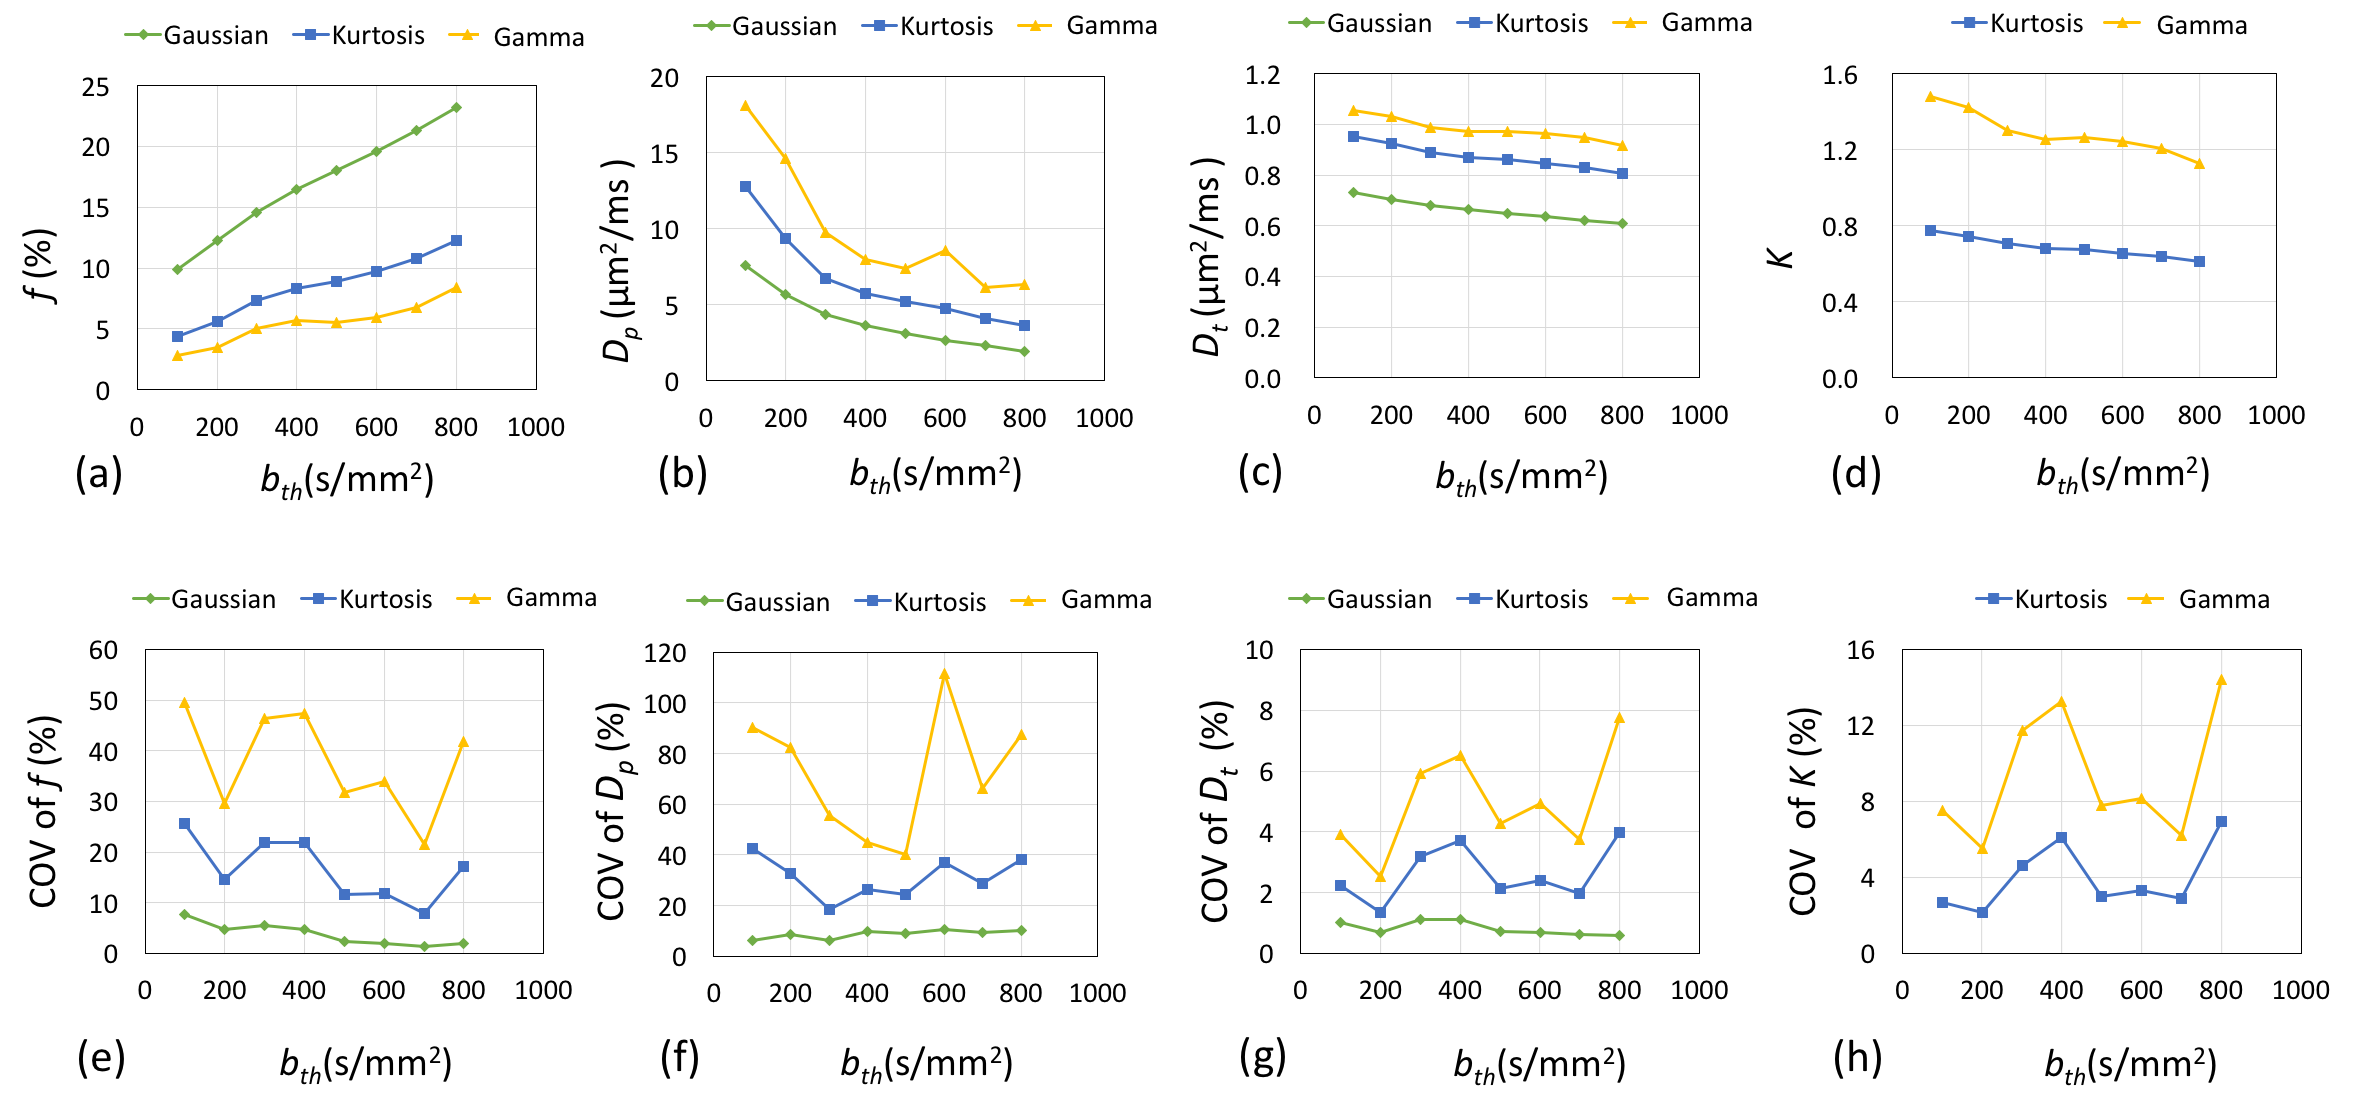
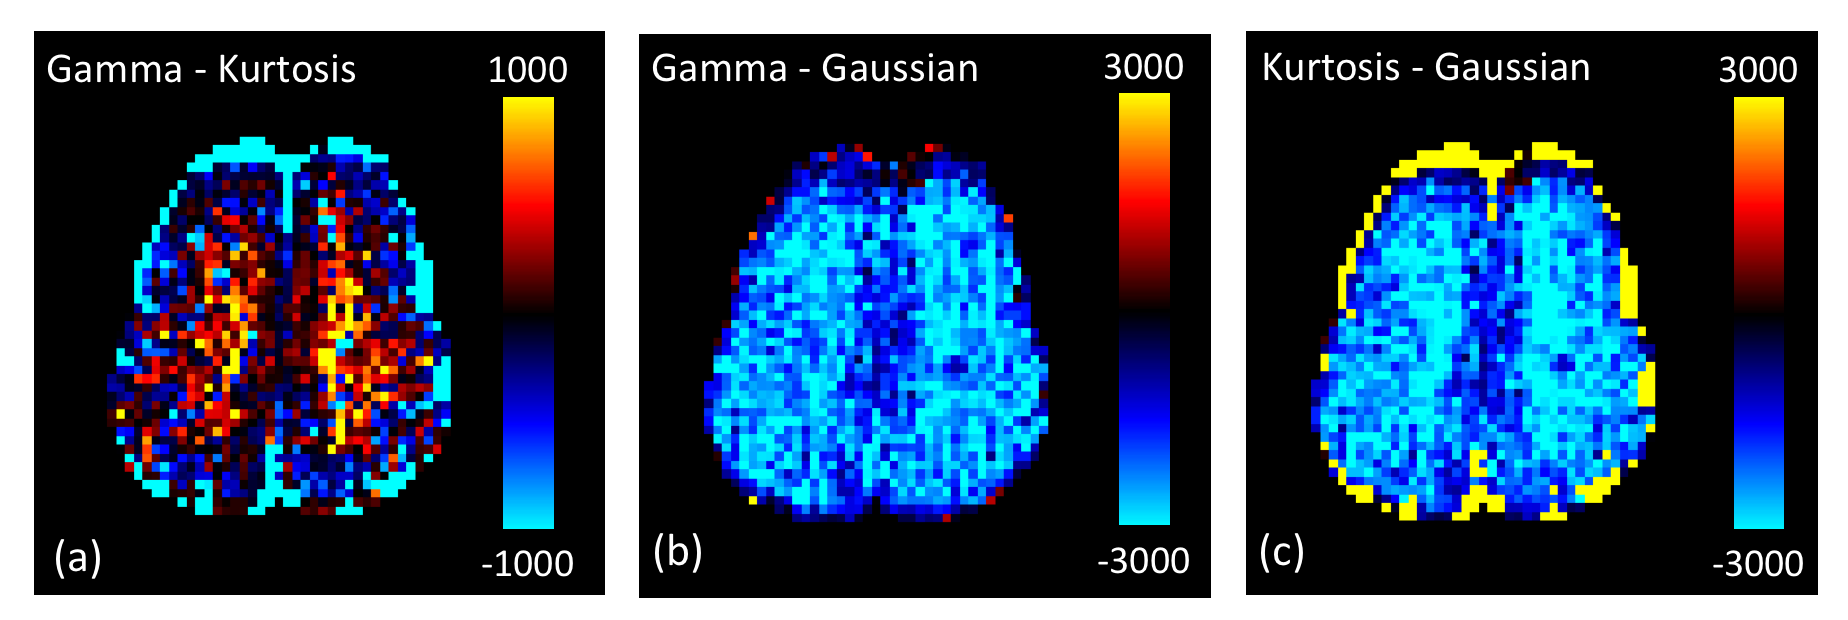
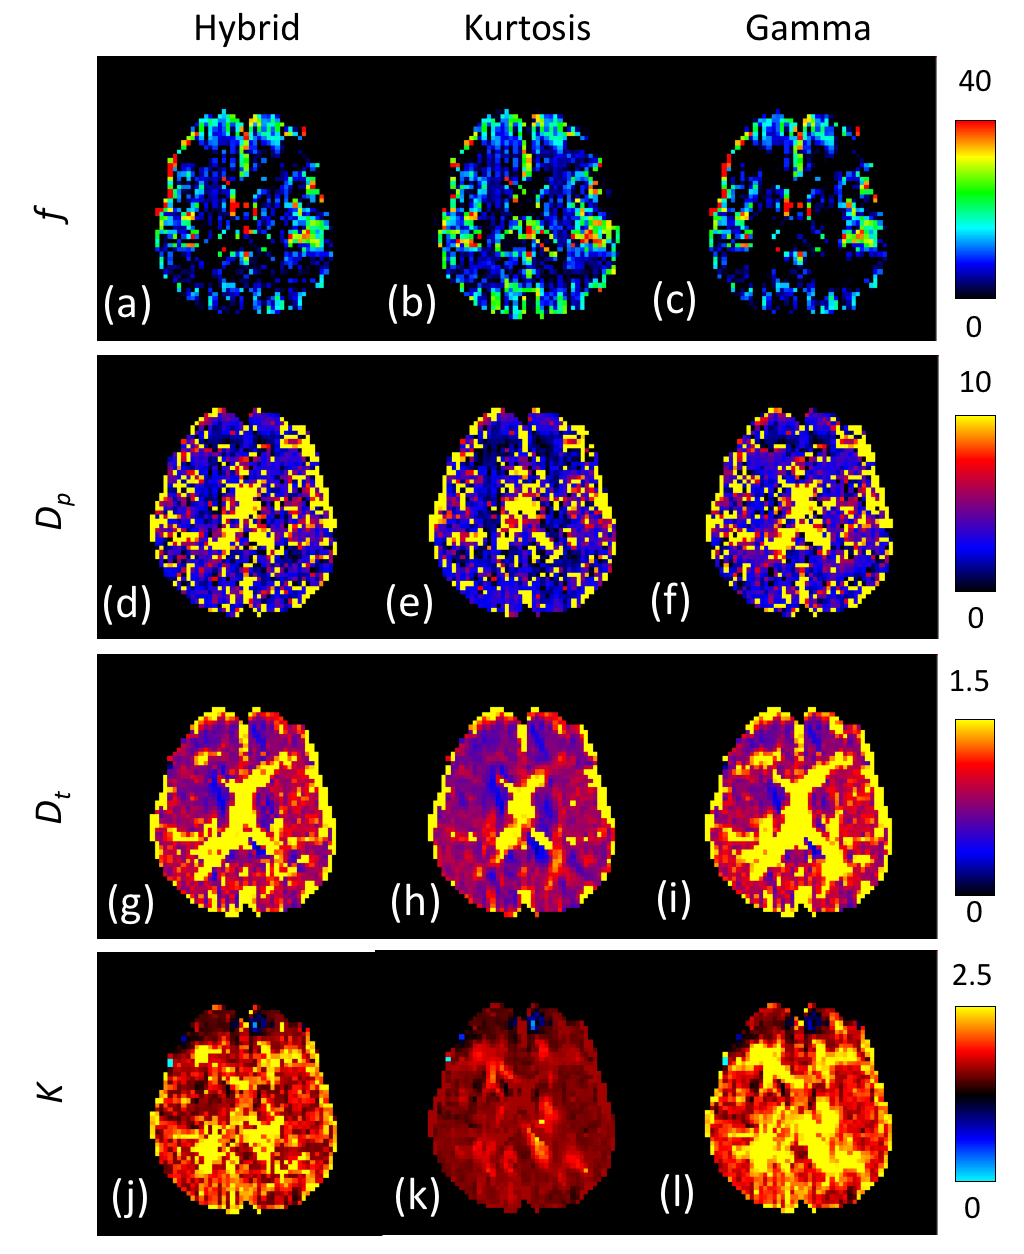
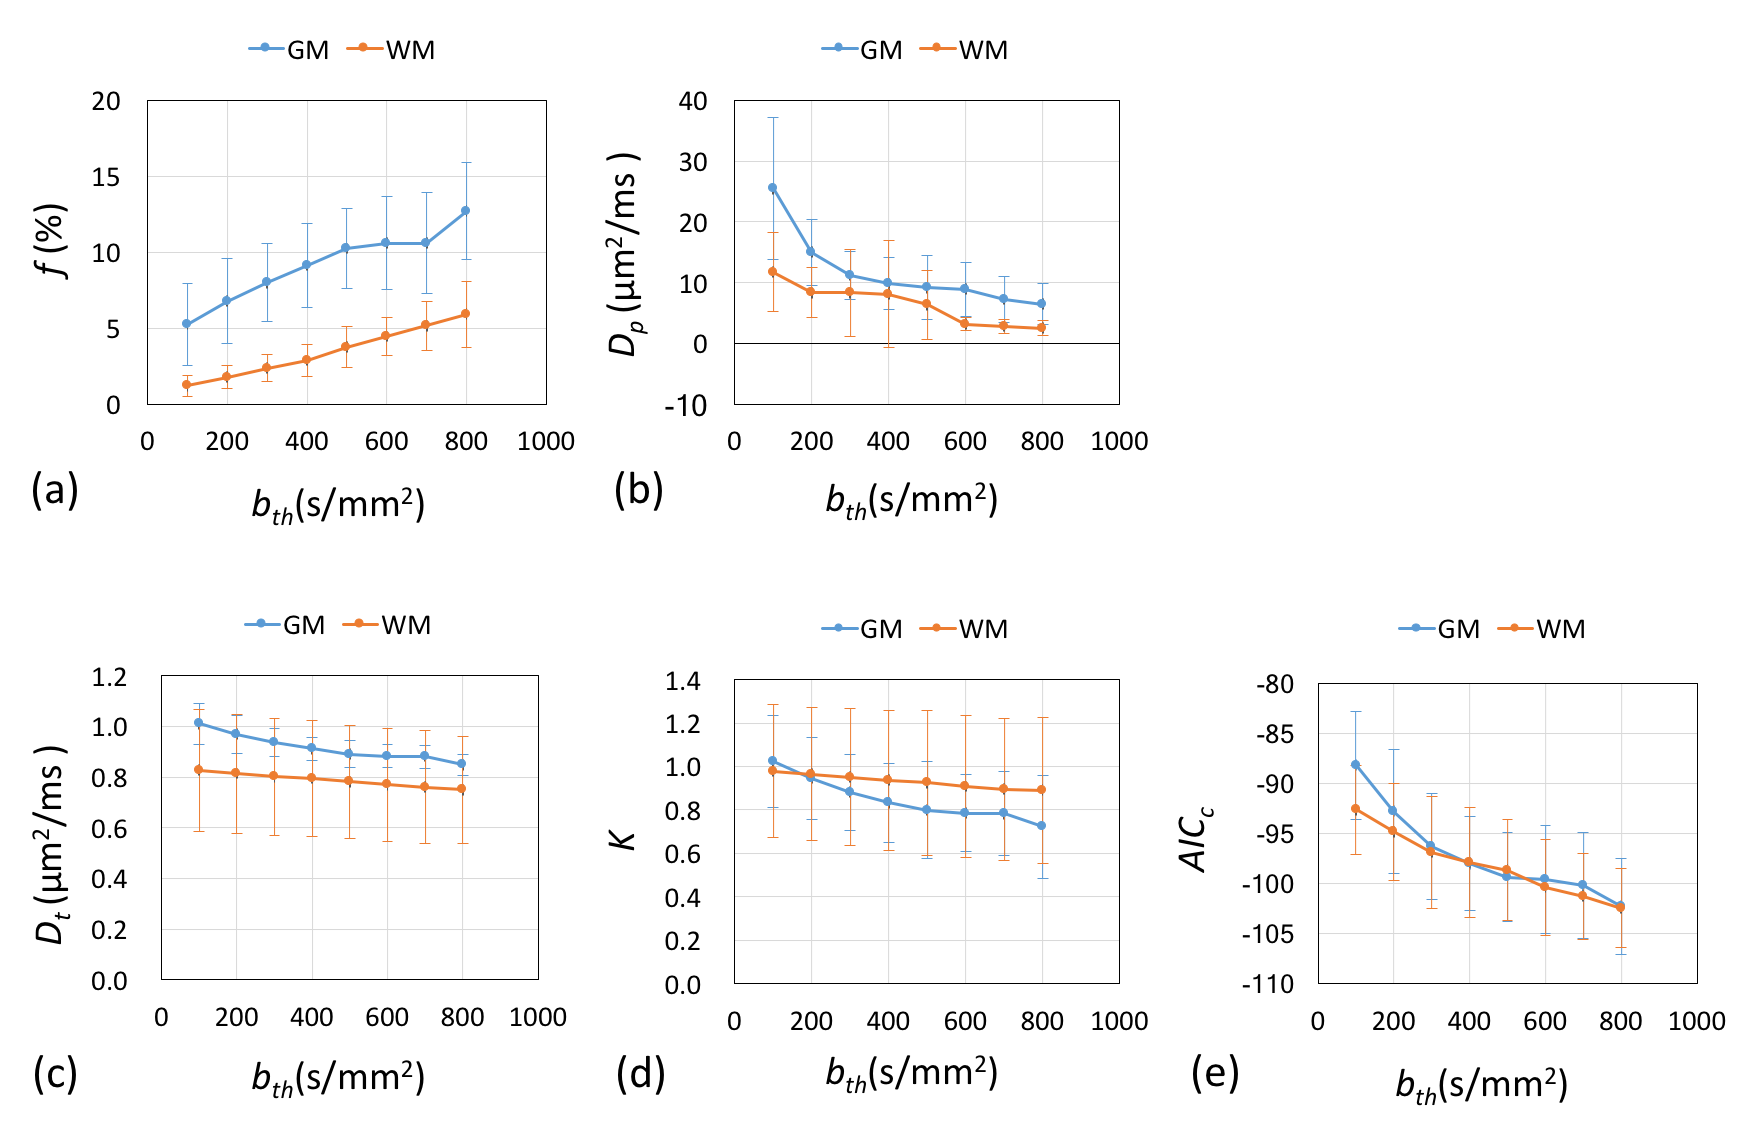
Figure 5 summarized the quantification results of gray matter and white matter of the six subjects using the hybrid modeling method (a-d). Estimated f showed about twice in gray matter compared with white matter. This results were closed to the relationship of cerebral blood volume between gray matter and white matter in conventional perfusionMRI techniques. The AICc over all showed minimum values with bth of 800s/mm2 (e).