1726
Use of Simultaneous Multi-Slice Imaging to Assess Dynamic Connectivity During a Self-Paced Finger Tap Task1School of Physics, University of Nottingham, Nottingham, United Kingdom
Synopsis
Previous fMRI studies have demonstrated a number of functional networks in the brain. The introduction of simultaneous multi-slice (SMS)-imaging has allowed a larger volume coverage of the brain to be acquired with a shorter repetition time (TR), increasing temporal resolution so that dynamic connectivity (DC) measures are more achievable. Here, we use sub-second SMS-imaging to assess DC in sensorimotor networks during a self-paced finger tap experiment, and demonstrate changes in DC during individual button presses.
Introduction
Resting state fMRI (RS-fMRI)1 can be used to image networks of functional connectivity (FC). Although such metrics are usually static, recent studies suggest FC is non-stationary2-4. The introduction of simultaneous multislice (SMS) imaging to fMRI5 allows greater brain coverage with a shorter TR. This increased temporal resolution better facilitates dynamic connectivity (DC) measurements, with smaller time windows containing sufficient data to characterise robust temporal correlation. Here, we use SMS-imaging at a TR of 600ms and 1000ms to study primary and secondary sensorimotor (S1/M1 and S2) brain regions in order to measure DC during a self-paced finger tap experiment.Methods
Data Acquisition
fMRI data were acquired on 7 subjects (2 female, age 24±2 years) using a Philips 7T Achieva MRI scanner with 32-channel NOVA receive coil. Subjects performed a self-paced single button press paradigm (to ensure large rest periods) in which they pressed a button with their left index finger approximately once per minute, for a total of 8 minutes. This was repeated twice, during which fMRI data (spatial resolution=2mm3, FOV=128x60x192mm, multiband (MB) factor of 3, SENSE 1.5, TE=25ms) were collected using SMS-imaging at two repetition times of either 600ms (FA=46°) or 1000ms (FA=57°). Physiological data were recorded throughout.
Data Analysis
Pre-Processing
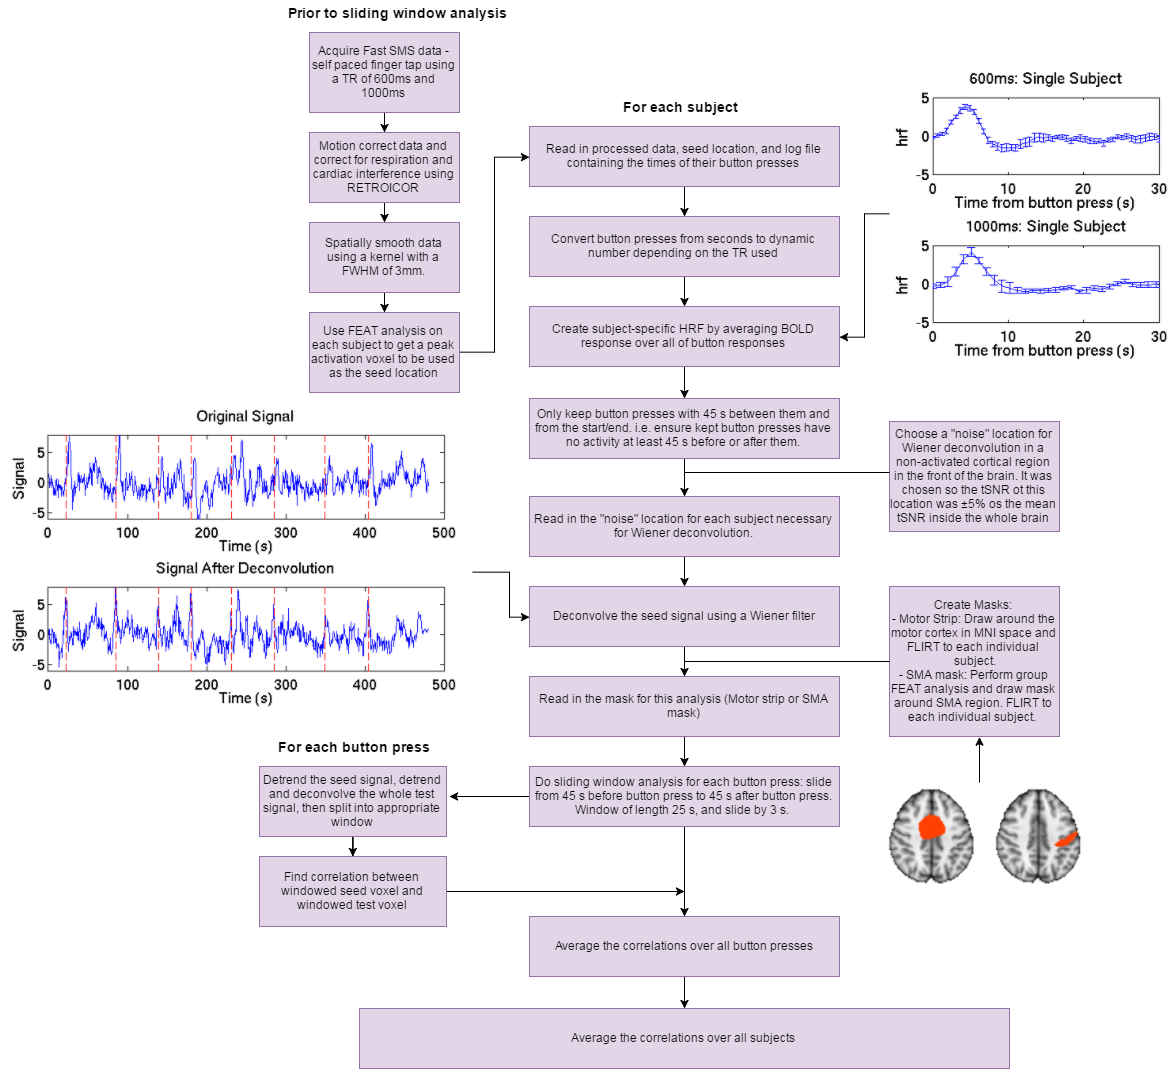
Data were motion corrected using MCFLIRT, FSL6, and cardiac and respiratory effects removed using RETROICOR7. Data were spatially smoothed with a 3mm kernel, and a GLM analysis (FSL FEAT8) was performed using the time of the button press to model the individual subjects’ data to determine the peak location in the right sensorimotor cortex. This peak location was used as the seed location for the dynamic connectivity analysis.
DC Analysis
Figure 1 provides a flowchart of the analysis. Masks were created for each subject on the left motor cortex and supplementary motor area (SMA). Data were detrended and deconvolved (using subject specific HRFs which could be clearly defined using a short TR) before connectivity analysis was carried out. Sliding windows, 25s in length, were used (with the windows sliding by 3s each time) to calculate connectivity within each window. Windows were centred from 45s prior to each button press until 45s post-button press. The correlations were averaged for each voxel in the test masks, for all button presses to provide a timecourse of the average connectivity around the button press. The average connectivity waveform was then averaged across subjects. A t-test was used to determine significance by comparing the connectivity values for all windows containing a button press to those not.
Results
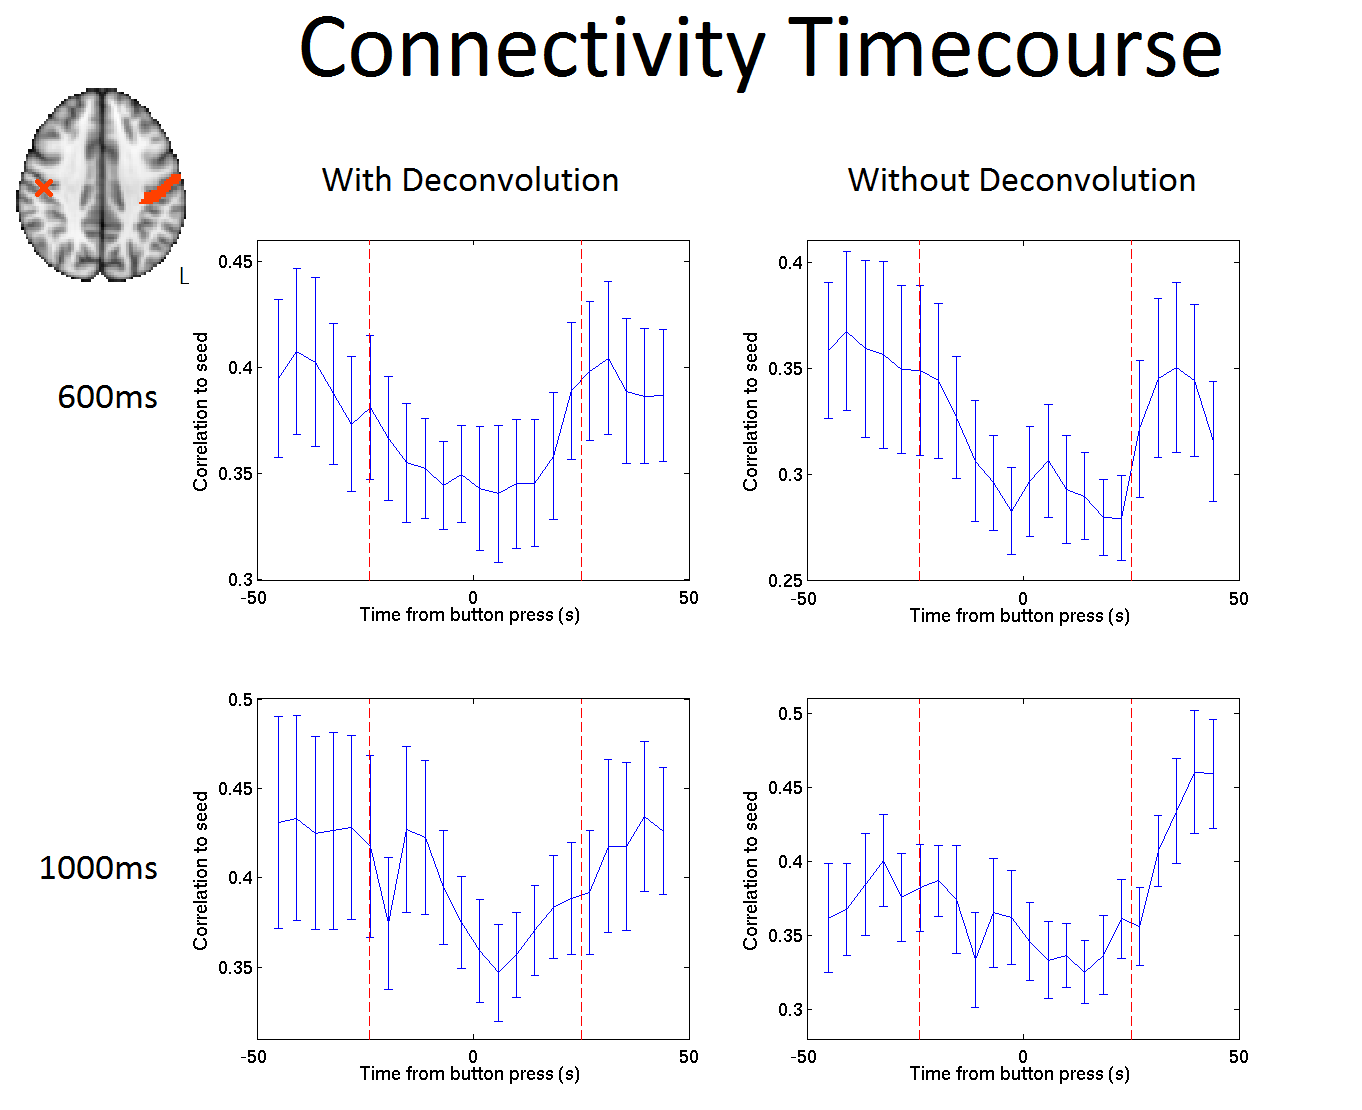
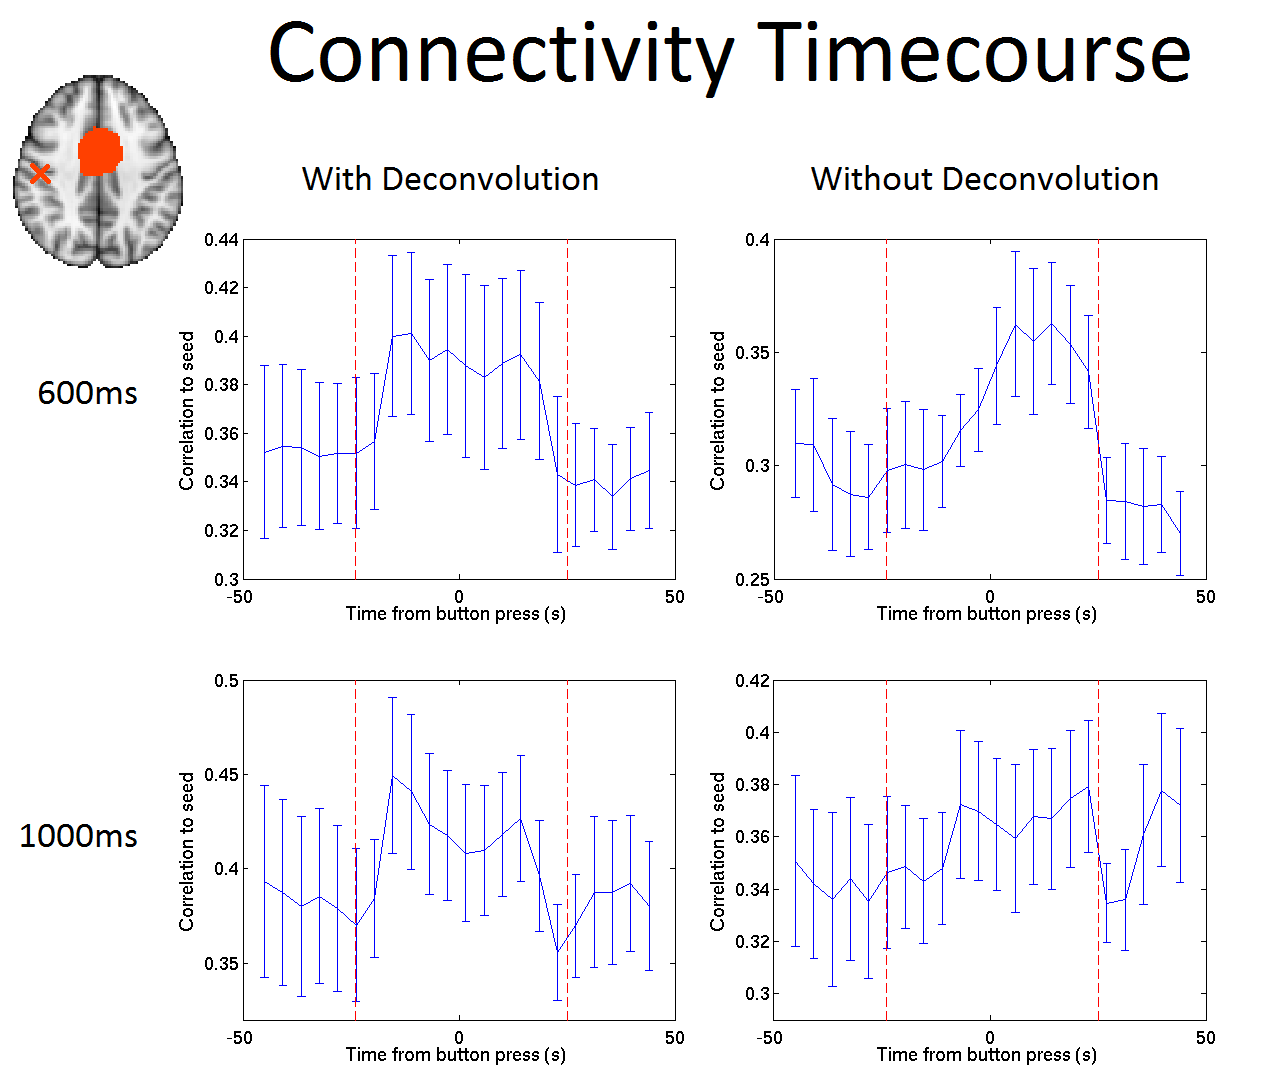
The dynamic connectivity timecourse from a seed in the right sensorimotor cortex to the left motor strip is illustrated in Figure 2, and from the seed to the SMA in Figure 3, for a TR of 600ms and 1000ms, both with and without deconvolution. Times within the red dashed lines are from windows containing a button press. For the motor strip (Figure 2), a significant reduction in connectivity (p=0.008 for a TR of 600ms, and p=0.04 for a TR of 1000ms) is seen during those time windows containing a button press. For the SMA (Figure 3), a significant increase in connectivity is seen for windows containing a button press for the 600ms data (p = 0.01), and although the same pattern is seen in the 1000ms data, this was not significant.Discussion
This study highlights the utility of UHF SMS-fMRI for increasing temporal resolution for DC measures. We have shown accurate connectivity metrics can be obtained using time windows as narrow as 25s. Our results suggest self-paced finger movement evokes a significant transient increase in FC between SMA and M1, accompanied by a concomitant decrease in FC between M1 and the ipsilateral motor strip. The former finding is consistent with the known role of SMA in movement planning9. The latter finding suggests potentially a transient breakdown of the canonical sensorimotor network during movement. The extent to which our finding of reduced interhemispheric connectivity is driven by a breakdown of the ongoing (inherent or resting state) connectivity, rather than simply by the linear addition of a haemodynamic response to the ongoing contralateral signal (thus reducing correlation) remains an open question for future work.Conclusion
We have shown the advantages of using a short TR achievable with SMS-imaging for the assessment of dynamic connectivity measures. This provides an improved sampled individual subject HRF and smaller time windows to be used for the connectivity analysis, with the shorter TR of 600ms showing a clearer increase/decrease in connectivity during a button press compared to a TR of 1000ms.Acknowledgements
This work was funded by an MRC grant.References
[1] Biswal, B., et al. "Functional connectivity in the motor cortex of resting human brain using echo-planar mri." Magnetic resonance in medicine 34.4 (1995): 537-541.
[2] Fox, M., et al. "The human brain is intrinsically organized into dynamic, anticorrelated functional networks." Proceedings of the National Academy of Sciences of the United States of America 102.27 (2005): 9673-9678.
[3] Greicius, M., et al. "Functional connectivity in the resting brain: a network analysis of the default mode hypothesis." Proceedings of the National Academy of Sciences 100.1 (2003): 253-258.
[4] Chang, C., et al. "Time–frequency dynamics of resting-state brain connectivity measured with fMRI." Neuroimage 50.1 (2010): 81-98.
[5] Nunes, R. G., et al. "Simultaneous slice excitation and reconstruction for single shot EPI." Proceedings of the 14th annual meeting of ISMRM, Seattle, Washington, USA. 2006.
[6] Jenkinson, M., et al. Improved Optimisation for the Robust and Accurate Linear Registration and Motion Correction of Brain Images. NeuroImage, 17(2), 825-841, 2002.
[7] Glover, G., et al. "Image-based method for retrospective correction of physiological motion effects in fMRI: RETROICOR." Magnetic resonance in medicine 44.1 (2000): 162-167.
[8] Jenkinson, M., et al. "Fsl." Neuroimage 62.2 (2012): 782-790.
[9] Penfield, W., et al. "The supplementary motor area of the cerebral cortex: a clinical and experimental study." AMA Archives of Neurology & Psychiatry 66.3 (1951): 289-317.
Figures