1720
Relationship between static and dynamic brain functional connectivity in autism spectrum disorders1CIMeC, Center for Mind/Brain Sciences, University of Trento, Rovereto, Italy, 2Functional Neuroimaging Laboratory, Center for Neuroscience and Cognitive Systems @ UniTn, Istituto Italiano di Tecnologia, Rovereto, Italy, 3Department of Computer Science, University of California, Santa Barbara, Santa Barbara, CA, United States, 4IBM Thomas J. Watson Research Center, Yorktown Heights, NY, United States
Synopsis
There is an increased interest in the dynamics of brain functional connectivity, as measured via temporal covariance in resting-state fMRI BOLD signal, and its aberrations in brain disorders. We studied and compared two measures of regional dynamic behaviour, flexibility and variability, across two datasets and show that patients diagnosed with autism spectrum disorder show increased dynamic connectional variability in several brain regions. Furthermore, we establish an interesting association between static and dynamic functional connectivity measures.
Background
There is an increased interest in the dynamics of brain functional connectivity, as measured via temporal covariance in resting-state fMRI (rsfMRI) BOLD signal, and its aberrations in brain disorders1. The most common analytical approach employs a sliding-window technique, in which functional connections are estimated within each window lasting on the order of tens of seconds. Novel network measures that characterize dynamic behaviour of individual brain regions have been introduced recently. Region flexibility2–4, which represents the number of times a given region changes its functional module assignment from one window to another, has been shown to play a role in learning in a task fMRI paradigm2. A conceptually simpler measure is region variability5, which quantifies the overall amount of change in the set of all node’s connections across all windows. Characteristic changes in variability have been described in a number of brain disorders, including schizophrenia and autism spectrum disorders (ASD)5.
While the measures are conceptually appealing and receive increased attention, their common properties have not yet been studied in detail. We first establish how reproducible they are across different choices of window lengths and datasets. Second, we test whether region variability changes described recently in ASD patients are recapitulated by similar changes in flexibility. Lastly, we study whether a node’s dynamic behaviour can be summarised by static and therefore simpler connectivity measures and whether these properties hold also in synthetic stationary BOLD time series.
Methods
The primary dataset employed in the study is the Autism Brain Imaging Data Exchange (ABIDE)6, a large publicly available dataset of rsfMRI acquisitions of subjects diagnosed with ASD and healthy controls. The preprocessed acquisitions are available as part of the Preprocessed Connectomes Project (http://preprocessed-connectomes-project.org/abide/, C-PAC pipeline). We limited ourselves to acquisitions with repetition time of 2s (sites NYU, SDSU, UM, USM). This resulted in a dataset of 147 subjects with ASD and 146 healthy controls. We extracted rsfMRI time series using a 200-region parcellation CC2007, estimated subject-wise time-resolved connectivity matrices with windows lengths ranging from 10 to 20 volumes (20-40s) and calculated region-based network measures of connection strength, diversity8, and variability5. Next, we partitioned these functional networks into time-resolved modules9 and used these partitions to estimate region flexibility2. We analysed the relationship of these four measures and investigated whether ASD is associated with region flexibility changes using a Student’s two-sample t-test with site and mean framewise displacement as covariates.
We furthermore repeated the analyses on two additional datasets: (1) a secondary rsfMRI dataset of repeated high quality acquisitions from a single individual, MyConnectome10, and (2) simulated BOLD time series11 that were stationary but matched in covariance structure and mean spectral content to the acquisitions from MyConnectome.
Results
1. Subjects diagnosed with ASD showed increased flexibility across regions of sensorimotor and default mode networks and across all examined window lengths (Fig. 1). These results are in line with previous investigations of dynamic connectivity in ASD using region variability5.
2. Flexibility values calculated across different window lengths are correlated (Fig. 2A), although less so than variability values, which seem to be less affected by the choice of the window length (Fig. 2B). Furthermore, variability and flexibility values of all regions in a single subject are positively correlated (Fig. 2C). These results hold in the MyConnectome dataset as well (Fig. 2D-F).
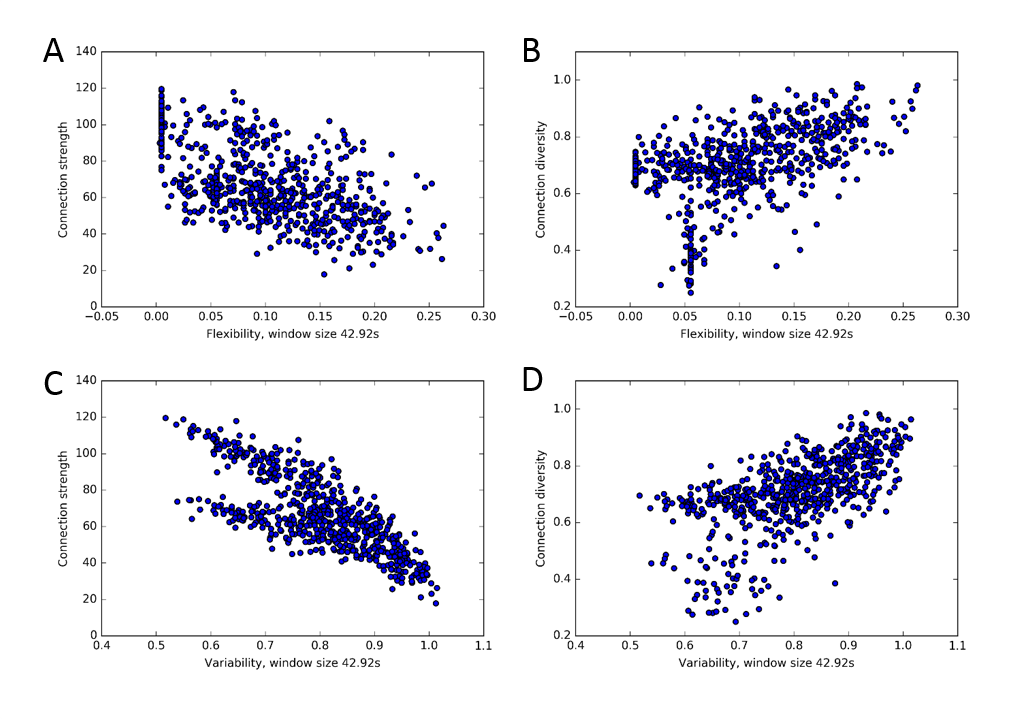
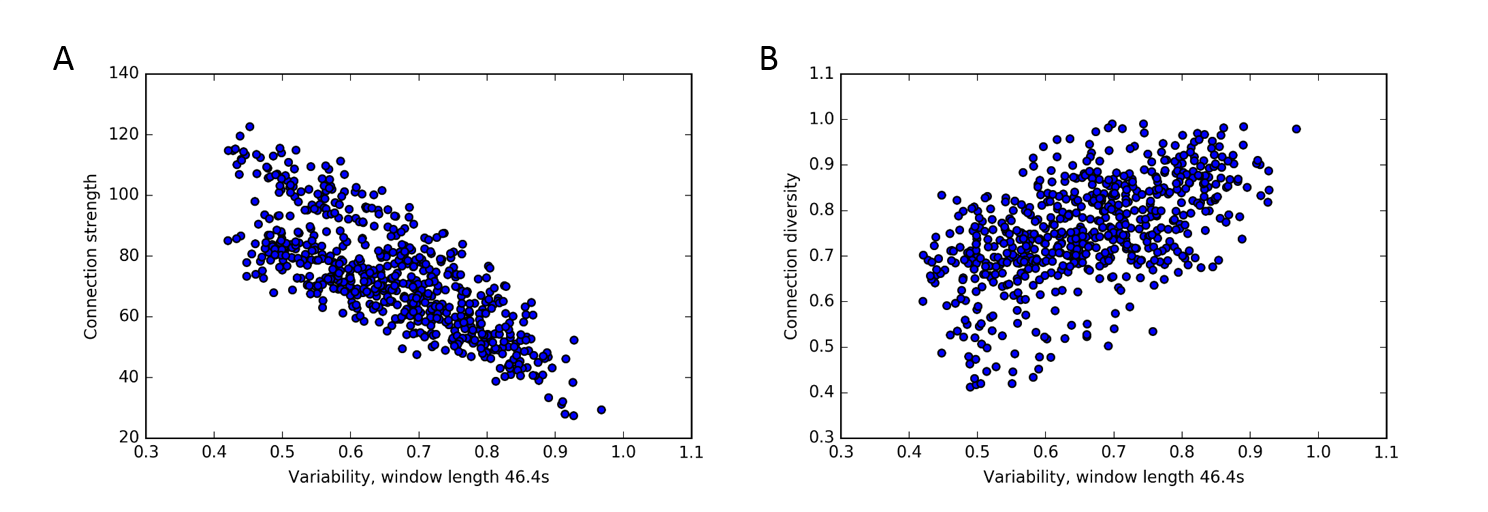
3. A clear association between static and dynamic network measures exists, with connection strength being anticorrelated with flexibility and variability, while connection diversity is positively correlated with both (Fig. 3). Similar associations between static and dynamic functional connectivity measures also hold for stationary synthetic BOLD time series (Fig. 4).
Conclusions
We have shown that region flexibility and variability, albeit computationally different, are positively correlated and therefore both capture similar functional connectivity properties of brain regions. We have furthermore demonstrated that several regions within the sensorimotor and default mode networks show higher flexibility in subjects diagnosed with ASD as compared to healthy controls, suggesting a more variable functional network structure within a single scan in patients with ASD. The association between static and dynamic network measures, such as connection diversity and region flexibility, is intriguing and should be further investigated under different conditions and in different patient groups in order to properly disentangle the contributions of static and dynamic changes to the described inter-group differences.Acknowledgements
No acknowledgement found.References
1. Calhoun VD, Miller R, Pearlson G, Adali T. The Chronnectome: Time-Varying Connectivity Networks as the Next Frontier in fMRI Data Discovery. Neuron. 2014;84(2):262–274.
2. Bassett DS, Wymbs NF, Porter MA, Mucha PJ, Carlson JM, Grafton ST. Dynamic reconfiguration of human brain networks during learning. Proceedings of the National Academy of Sciences. 2011;108(18):7641–7646.
3. Betzel RF, Satterthwaite TD, Gold JI, Bassett DS. A positive mood, a flexible brain. arXiv:1601.07881 [q-bio]. 2016 Jan 28 [accessed 2016 Oct 24]. http://arxiv.org/abs/1601.07881
4. Shine JM, Koyejo O, Poldrack RA. Temporal metastates are associated with differential patterns of time-resolved connectivity, network topology, and attention. Proceedings of the National Academy of Sciences of the United States of America. 2016;113(35):9888–9891.
5. Zhang J, Cheng W, Liu Z, Zhang K, Lei X, Yao Y, Becker B, Liu Y, Kendrick KM, Lu G, et al. Neural, electrophysiological and anatomical basis of brain-network variability and its characteristic changes in mental disorders. Brain: A Journal of Neurology. 2016;139(Pt 8):2307–2321.
6. Di Martino A, Yan C-G, Li Q, Denio E, Castellanos FX, Alaerts K, Anderson JS, Assaf M, Bookheimer SY, Dapretto M, et al. The autism brain imaging data exchange: towards a large-scale evaluation of the intrinsic brain architecture in autism. Molecular Psychiatry. 2014;19(6):659–667.
7. Craddock RC, James GA, Holtzheimer PE, Hu XP, Mayberg HS. A whole brain fMRI atlas generated via spatially constrained spectral clustering. Human Brain Mapping. 2012;33(8):1914–1928.
8. Rubinov M, Sporns O. Weight-conserving characterization of complex functional brain networks. NeuroImage. 2011;56(4):2068–2079.
9. Jutla IS, Jeub LGS, Mucha PJ. A generalized Louvain method for community detection implemented in MATLAB. 2011.
10. Laumann TO, Gordon EM, Adeyemo B, Snyder AZ, Joo SJ, Chen M-Y, Gilmore AW, McDermott KB, Nelson SM, Dosenbach NUF, et al. Functional System and Areal Organization of a Highly Sampled Individual Human Brain. Neuron. 2015;87(3):657–670.
11. Laumann TO, Snyder AZ, Mitra A, Gordon EM, Gratton C, Adeyemo B, Gilmore AW, Nelson SM, Berg JJ, Greene DJ, et al. On the Stability of BOLD fMRI Correlations. Cerebral Cortex (New York, N.Y.: 1991). 2016 Sep 2.
Figures
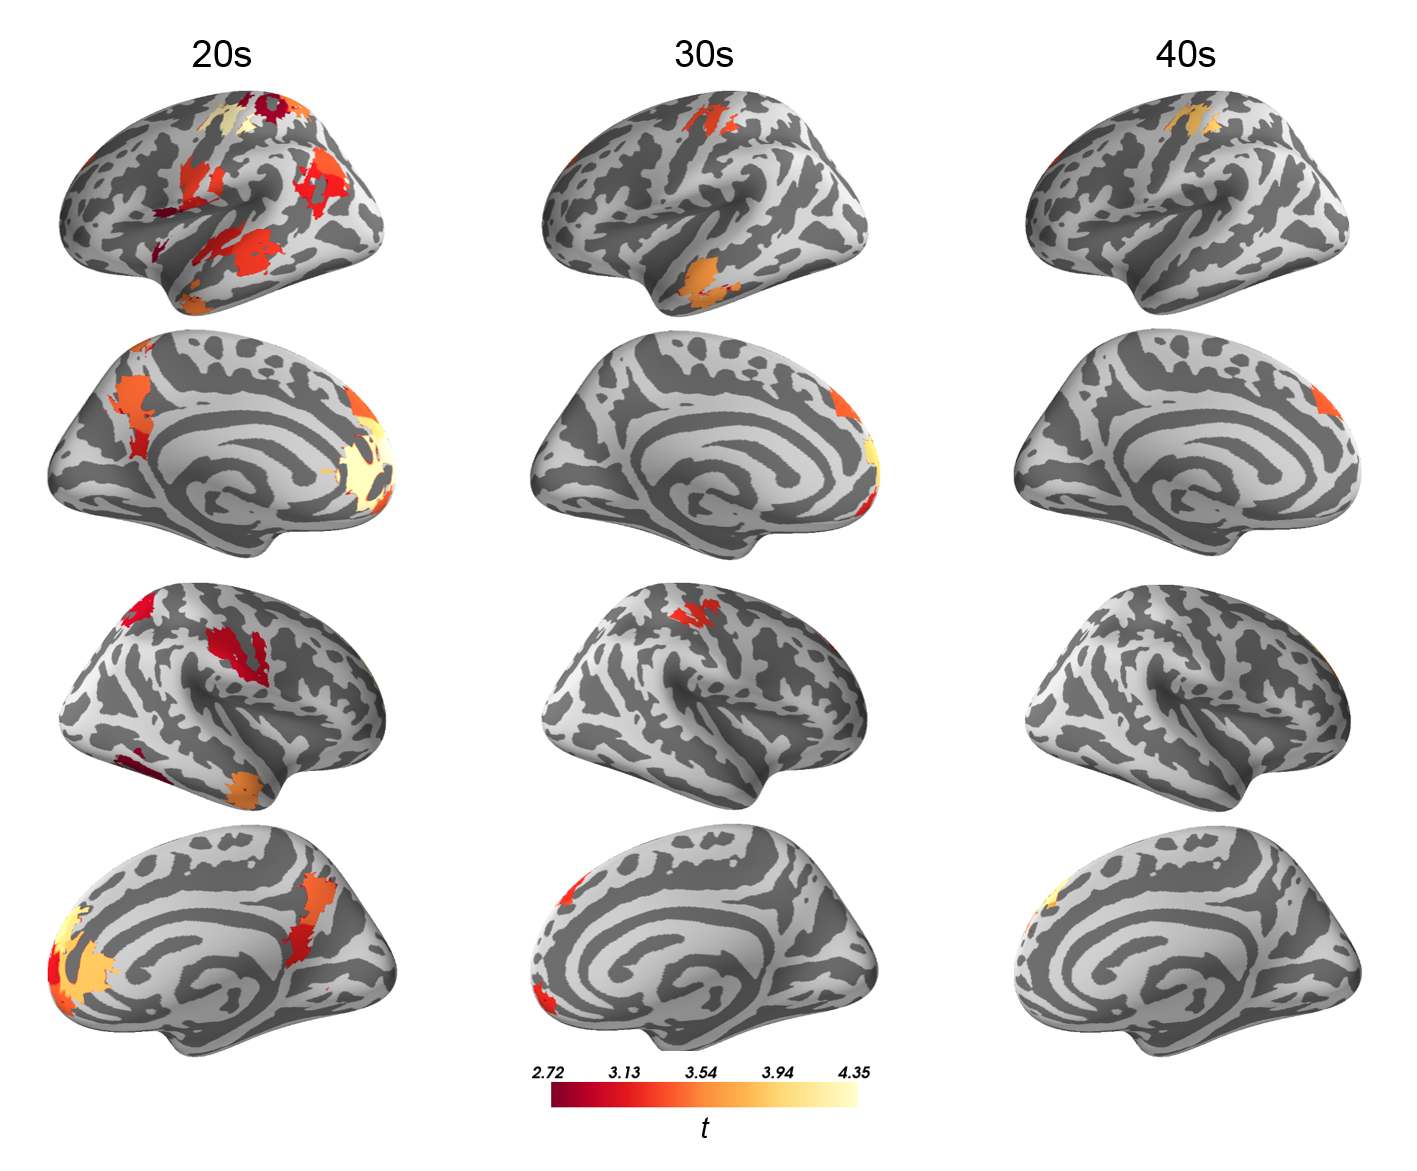
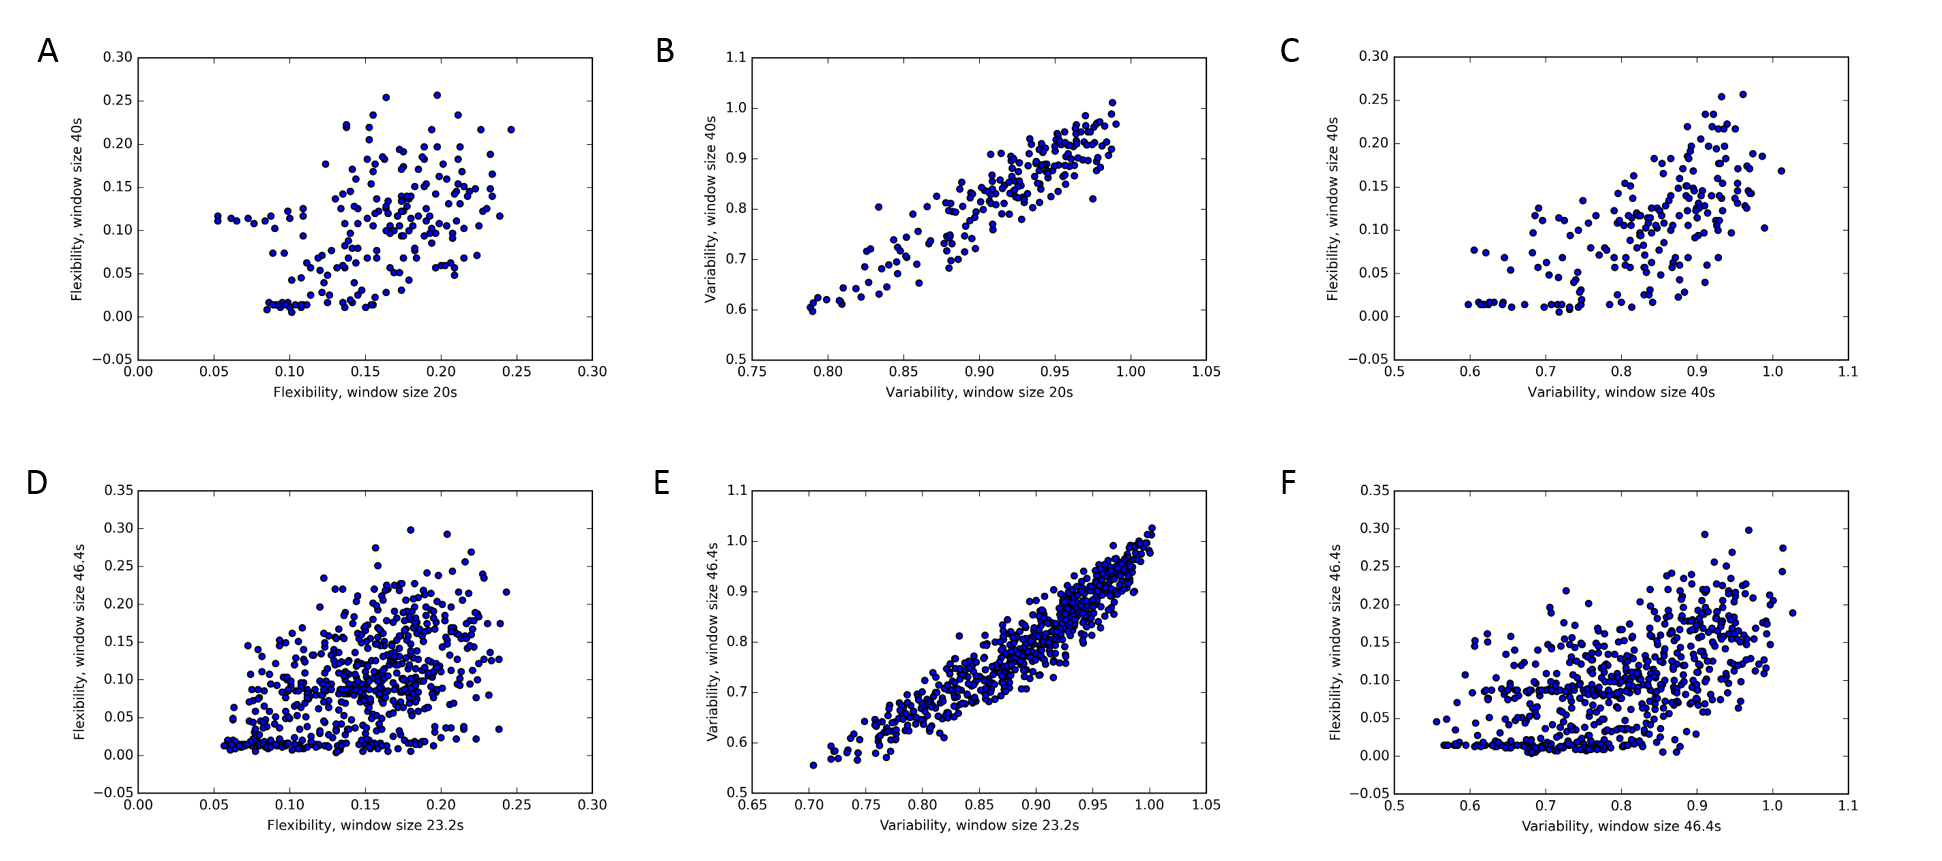
Figure 2: The effect of window length on region flexibility and variability and their relationship in a representative subject from the ABIDE dataset. Each dot represents a single region. Region flexibility values are correlated when calculated with different window sizes (A, r = 0.45), but less so than variability (B, r = 0.91). There is an association between regional flexibility and variability values (C, r = 0.67).
Similar effect is seen in individual sessions of the MyConnectome dataset, shown here for a representative session (session 014; D, r = 0.51, E, r = 0.94, F, 0.59).