1719
Learning Subnetwork Biomarkers via Hypergraph for Classification of Autism Disease1University of North Carolina at Chapel Hill, Chapel Hill, NC, United States, 2School of Software, Tsinghua University, Beijing, China, 3Department of Computer Science, College of Charleston, Charleston, SC, USA, 4Centre for Studies of Psychological Application, School of Psychology, South China Normal University, Guangzhou, China, 5Biomedical Imaging Research Institute (BIRI), Department of Biomedical Sciences and Imaging, Cedars-Sinai Medical Center, Los Angeles, CA, USA, 6Department of Computer Science and Technology, Nanjing University of Aeronautics and As-tronautics, Nanjing, China
Synopsis
Most brain network connectivity models consider correlations between discrete-time series signals that only connect two brain regions. Here we propose a method to explore subnetwork biomarkers that are significantly distinguishable between two clinical cohorts. We construct a hypergraph by exhaustively inspecting all possible subnetworks for all subjects. The objective function of hypergraph learning is to jointly optimize the weights for all hyperedges. We deploy our method to find high order childhood autism biomarkers from rs-fMRI images. Promising results have been obtained from comprehensive evaluation on the discriminative power in diagnosis of Autism.
Purpose
We propose a novel learning-based method to discover high order network connectome biomarkers that can be used to distinguish two clinical cohorts.Method
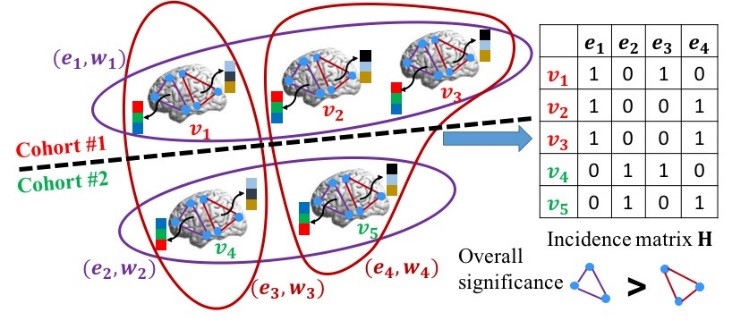
Figure 1 illustrates the intuition behind our proposed learning-based method. We assume there are three subjects in one cohort and two subjects in another cohort. Only two possible subnetworks are under investigation. Our method aims to find out the biomarkers by inspecting the performance of each hyperedge in separating subjects from two groups. We use hypergraph learning technique to estimate the likelihood for each subject , which is driven by (a) the minimization of discrepancies between ground truth label vector $$$y$$$ and the estimated likelihood vector $$$f=[f_1,f_2,\dots,f_N]^T$$$, and (b) the consistency of clinical labels within each hyperedge. The consistency requirement can be defined as:
$$\Omega_f(W)=\sum_{\theta=1}^{\Theta}\sum_{n,n'=1}^ N=\frac{w_{\theta}h(n,\theta)h(n',\theta)}{\delta(\theta)}(\frac{f_n}{\sqrt{d(n)}}-\frac{f_{n'}}{\sqrt{d(n')}})^2$$
The definitions of notations can be found in [1]. The regulation term $$$\Omega_f(W)$$$ penalizes the label discrepancy by encouraging the difference between the normalized likelihoods $$$ \frac{f_n}{\sqrt{d(n)}}$$$ and $$$\frac{f_{n'}}{\sqrt{d(n')}}$$$ to be as small as possible if $$$v_n$$$ and $$$v_{n'}$$$ are in the same hyperedge $$$e_{\theta}$$$. It is clear that the regularization term $$$\Omega_f(W)$$$ is a function of both $$$W$$$ and $$$f$$$. In order to avoid overfitting, we use Frobenius norm on the weighting matrix $$$W$$$. Therefore, the objective function to look for high order connectome patterns is:
$$\min_{W,f}\quad \Omega_f(W)+\lambda\lVert y-f\rVert_2^2+\mu\lVert W\rVert_F^2$$
Results
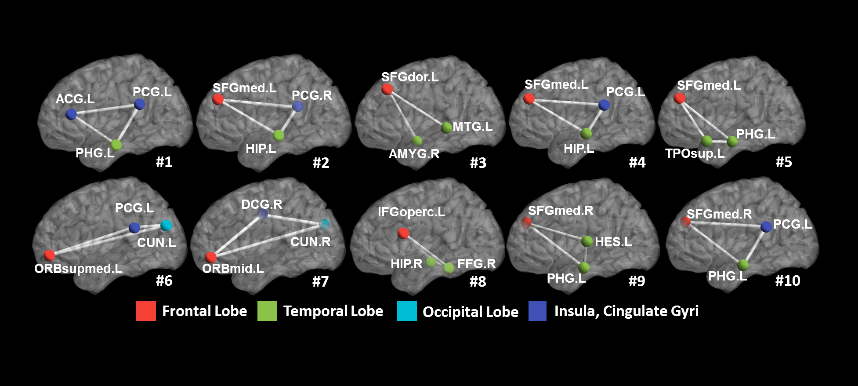
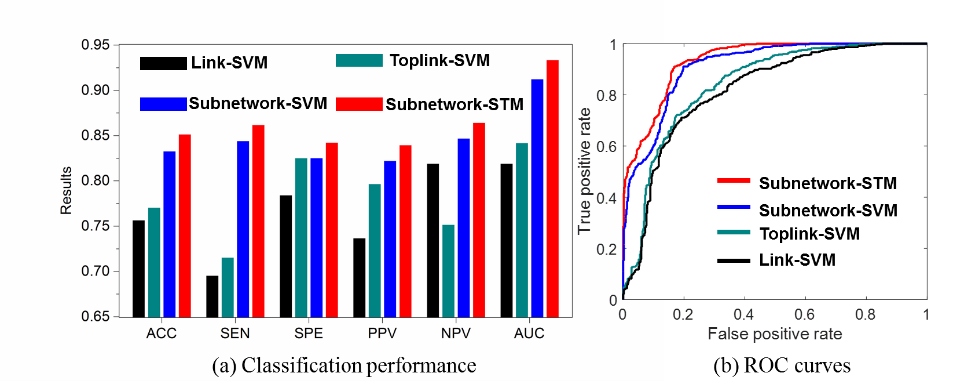
We applied our learning-based method to find critical subnetworks based on 45 ASD and 47 typical control (TC) subjects from the NYU database [2]. Figure 2 shows the top 10 most critical subnetworks out of 253,460 candidates between ASD and TC cohorts. The color on each vertex differentiates the functions in human brain. It is clear (a) most of the brain regions involved in the selected top 10 critical subnetworks locate the key areas related with ASD, such as amygdala, middle temporal gyrus, superior frontal gyrus; and (b) most of the selected subnetworks travel cross the subcortical and cortical regions, which is in consensus with the recent discover of autism pathology in neuroscience community [3]. We use functional connectivity flows on top 200 critical subnetworks as the feature representation (feature dimension: 200×3) to classify ASD and TC subjects. Then traditional Support Vector Machine (SVM) [4] is adopted to train the classifier directly based on the concatenated feature vector, denoted as Subnetwork-SVM. Since the functional connectivity flow comes from each subnetwork, it is straightforward to organize them to a tensor representation and use advanced Support Tensor Machine (STM) [5] to take advantage of the structured feature representation, denoted as Subnetwork-STM in the following experiments. In order to demonstrate the advantage of subnetwork over the conventional region-to-region connection in brain network, we compare with two counterpart methods Link-SVM (use the Pearson’s correlations on each link as the feature) and Toplink-SVM (select top 600 links by t-test and use the Pearson’s correlation on the selected links to form the feature vector). As the classification performance plots and the ROC curves shown in Figure 3, the classifiers trained on connectome features from our learned subnetworks have achieved much higher classification performance than those trained by the same classification tool but based on the connectome features from the conventional region-to-region connection links. Also, the substantial classification improvements by Subnetwork-STM over Subnetwork-SVM indicate the benefit of using structured data presentation in classification where such high order information is clearly delivered in the learned subnetworks.Discussion and conclusion
In this paper, we propose a novel learning method to discover high order brain connectome biomarkers which are beyond the widely used region-to-region connections in conventional brain network analysis. Hypergraph technique is introduced to model complex subject-wise relationships in terms of various subnetworks and quantify the significance of each subnetwork based on the discrimination power across clinical groups and consistency within each cohort. We apply our learning-based method to find the subnetwork biomarkers between ASD and TC subjects. The learned top sub-networks are not only in consensus with the recent clinical findings, but also able to significantly improve accuracy in identifying ASD subjects, strongly supporting their potential use and impact in neuroscience study and clinic practice.Acknowledgements
No acknowledgement found.References
[1] Zhou D, Huang J, Schölkopf B. Learning with hypergraphs: Clustering, classification, and embedding. Advances in neural information processing systems. 2006: 1601-1608.
[2] Di Martino, A., Yan, C.G., Li, Q., Denio, E., Castellanos, F.X., Alaerts, K., Anderson, J.S., Assaf, M., Bookheimer, S.Y., Dapretto, M., et al.: The autism brain imaging data exchange: towards a large-scale evaluation of the intrinsic brain architecture in autism. Molecular psychiatry 19(6), 659-667 (2014)
[3] Minshew, N.J., Williams, D.L.: The new neurobiology of autism: cortex, connectivity, and neuronal organization. Archives of Neurology 64(7), 945-950 (2007)
[4] Cortes, C., Vapnik, V.: Support-vector networks. Machine Learning 20(3), 273-297 (1995)
[5] Tao, D., Li, X., Wu, X., Hu, W., Maybank, S.J.: Supervised tensor learning. Knowledge and Information Systems 13(1), 1-42 (2007)
Figures