1715
fMRI and spectroscopic characterization of sensory and pain processing in “pain-free” mice1Institute for Biomedical Engineering, ETH and University of Zurich, Zurich, Switzerland, 2Neuroscience Center Zurich, Zurich, Switzerland, 3Institute of Pharmacology and Toxicology, University of Zurich, Zurich, Switzerland, 4Molecular Nociception Group, Wolfson Institute for Biomedical Research, University College London, London, United Kingdom
Synopsis
FMRI has been widely used to assess changes in brain activity evoked by innocuous and noxious stimuli. However, stimulus-evoked fMRI (se-fMRI) measurements in mice have turned out challenging, and it is still under investigation whether and under which conditions se-fMRI applications in mice can lead to reliable readouts. Generally, se-fMRI could be a useful tool to characterize genetically modified mouse strains, such as mice exhibiting altered nociception. In this study, NaV1.7fl/fl:AdvCre mice were characterized with respect to neural processing of different types of peripheral stimuli and compared to a wildtype control group. Results of behavioral tests are compared to outcomes of fMRI and spectroscopic measurements.
Introduction
Voltage-gated sodium (NaV) channels play an essential role in the generation and propagation of action potentials in nociceptors, and thus several subtypes became attractive targets for pharmacotherapeutic approaches. For example, mice lacking the nociceptor NaV1.7 have been shown to have impaired nociception under both acute and chronic pain conditions [1,2] as revealed by behavioral and molecular assays. In the current study we further characterize [3] this so-called “pain-free” genotype using stimulus-evoked fMRI (se-fMRI) readouts, spectroscopic imaging and behavioral measurements [4,5,6].Materials and Methods
All MRI experiments were conducted using a Bruker Biospec 94/30 small animal MR system (Bruker BioSpin MRI, Germany) operating at 400MHz (9.4T). A four-element receive-only cryogenic phased array coil (Bruker BioSpin AG, Switzerland) was used in combination with a linearly polarized room temperature volume resonator for transmission. Throughout the experiment the animals were intubated, mechanically ventilated, and anesthetized with 1.5% isoflurane in a 1:4 O2:air mixture. For immobilization pancuronium bromide (Sigma-Aldrich, Germany) was administered i.v. as a bolus at a dose of 1 mg/kg. For the fMRI measurements, data were acquired using a GE-EPI sequence: FOV=16x7 mm2 and matrix size=80x35, TE/TR=12/1000ms, NA=1, FA=60°. Twelve adjacent coronal slices with a thickness of 0.5mm were acquired. Animals (n ≥ 5 for each group) were stimulated on forepaw (fp) for fMRI experiment and on hindpaw (hp) for spectroscopic measurements, using mechanical and chemical stimulation. The mechanical stimulation paradigm consisted of 180 seconds baseline, followed by four cycles of 20 seconds air-puff stimulation (pressure applied=0.005 bar) and 120 second of rest each. For chemical stimulation, a cannula was inserted s.c. into the paw and capsaicin (1µg) was injected. The fMRI chemical stimulation paradigm consisted of a 180 seconds baseline followed by capsaicin injection and 460 seconds of recorded signal. For fMRI analysis regions-of-interest (ROIs) were defined according to a stereotaxic mouse brain atlas for the contralateral and ipsilateral primary somatosensory cortex (S1), BOLD signal time courses were extracted using a home-written MatLab code. For spectroscopic imaging (SI), the following parameters were used: TR: 2500ms; FOV: 1.5x1.5cm; matrix: 17x17; slice thickness: 1.3mm; acquisition time: 12min. Scans were performed using VAPOR water suppression interleaved with eight saturation slices for outer volume suppression [6]. SI scans were repeatedly acquired for six intervals. Stimulation paradigm was applied as following: 1µg Capsaicin injected after three baseline scans (for a total duration of 72 min). Relative Glutamate quantification was performed using LCModel [7]. For behavioral investigation the following tests were performed: mechanical Von Frey and withdrawal reflex test using electrical stimulation (0.7-1.0-1.5mA), for reflex test animal reactions were scored as following: 0=no reaction, 1=whiskers/digits movement, 2=sporadic wincing, 3=continuous wincing and/or paw withdrawal.Results
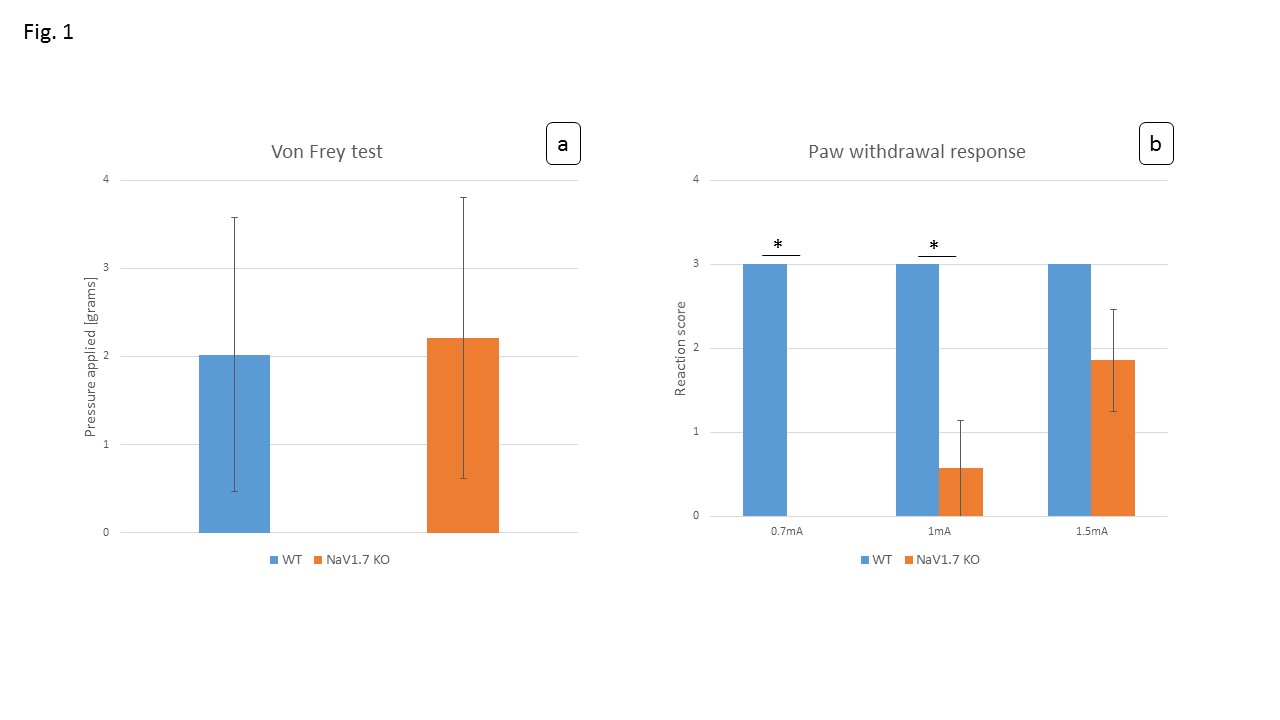
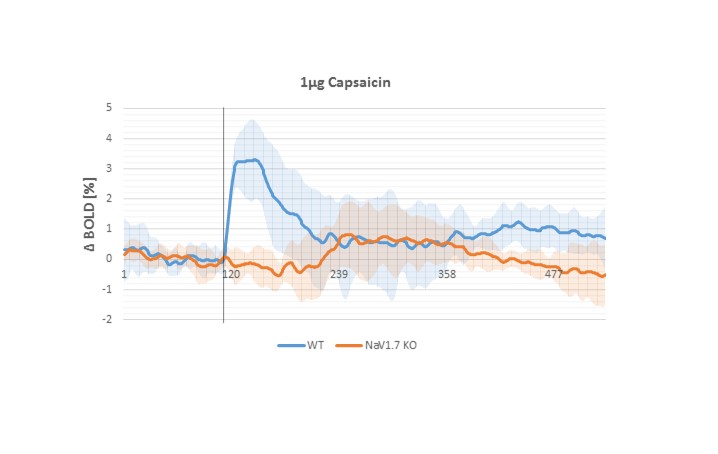
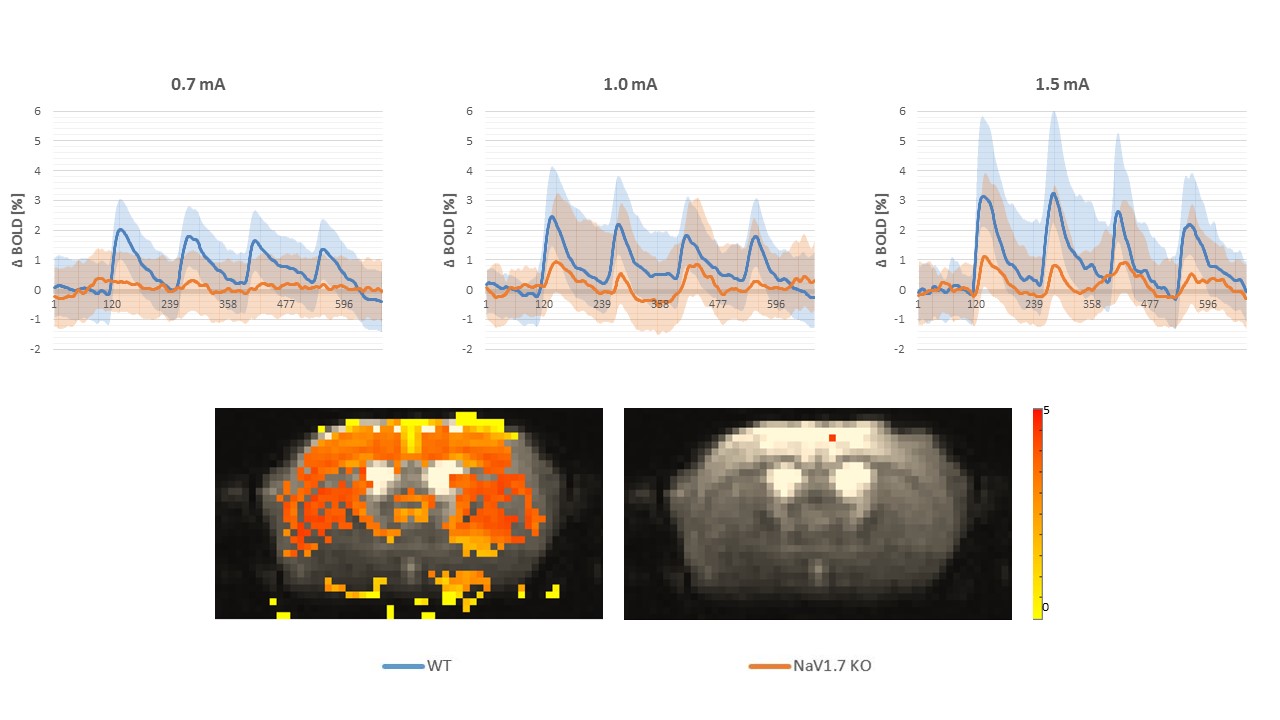
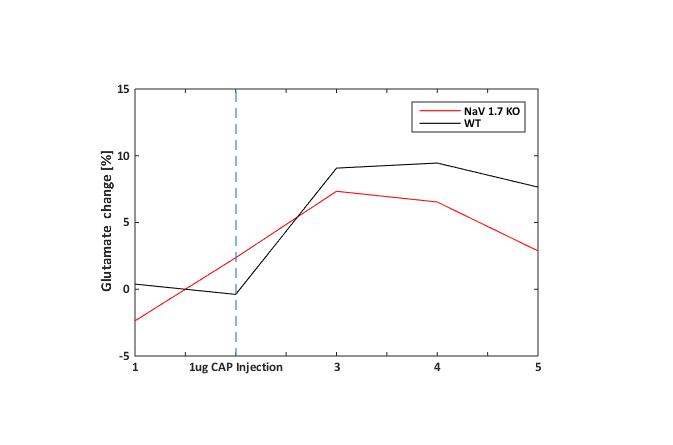
In behavioral tests, wildtype (WT) littermates did not show any altered sensitivity to the applied innocuous stimulus in comparison to the NaV1.7fl/fl:AdvCre (NaV1.7, KO) mice. In fact during mechanical stimulation (Von Frey test) the pressure needed to elicit paw withdrawal was similar to what we observed in WT mice (Fig.1a). Electrical paw stimulation on the contrary, used at higher stimulus amplitudes in the noxious range, elicited a largely reduced response in NaV1.7 KO mice, triggering only a delayed reflex response (Fig.1b). Se-fMRI measurements did not reveal differences between the nociceptor-specific KO mice and WT littermates when applying mechanical stimulation - an air-puff at 0.005 bar (data not shown). Yet, noxious electrical and chemical stimulation, i.e. injection of capsaicin into the paw produced significantly reduced evoked BOLD signal changes in KO mice compared to the WT littermate group (Fig. 2,3). Preliminary data from 1H-MR spectroscopy indicate a reduced increase in Glutamate concentration in the contralateral S1 region in NaV1.7 KO mice as compared to wild type mice (no littermates).Conclusions
NaV1.7 KO mice, which have been shown to exhibit impaired nociception, show a decreased BOLD fMRI response upon noxious chemical and electrical stimulation (Fig 2, 3). In contrast, mild sensory/mechanical stimulation did not show any significant difference between NaV1.7fl/fl:AdvCre mice and WT littermates, thus demonstrating that pure sensory perception in these mice is intact. The fMRI readouts were in line with observations from standard behavioral tests. Thus, se-fMRI procedures seem suitable to visualize differences in sensation and perception of pain in pain-free as compared to wt mice. However, careful interpretation of underlying processes is needed as se-fMRI readouts in mice have been shown to be confounded by arousal-related, unspecific effects [4].Acknowledgements
No acknowledgement found.References
1) Minett et al., 2014. Pain without nociceptors? Nav1.7-independent pain mechanisms. Cell Rep. 2014 Jan 30; 6(2): 301–312.
2) Minett et al., 2012. Significant determinants of mouse pain behaviour. PLoS One 2012;3:791–799. 3) 3) 3) Ielacqua et al. 2016. fMRI characterization of pain processing in NaV1.7 Wnt1 KO mice. Proc. Intl. Soc. Mag. Reson. Med. 24 2016
4) Schroeter et al., 2014. Specificity of stimulus-evoked fMRI responses in the mouse: the influence of systemic physiological changes associated with innocuous stimulation under four different anesthetics. Neuroimage. 2014 94: 372-84 4)
5) Seuwen et al. 2016. Multi-slice functional FID based spectroscopic imaging on mice using dynamic shimming at 9.4T. Proc. Intl. Soc. Mag. Reson. Med. 24 2016
6) Seuwen et al. 2015 Metabolic changes assessed by MRS accurately reflect brain function during drug-induced epilepsy in mice in contrast to fMRI-based hemodynamic readouts. Neuroimage 2015;
7) Provencher et al. 1993. Estimation of metabolite concentrations from localized in vivo proton NMR spectra. Magn Reson Med 1993;30:672–679
Figures