1707
Real-time fMRI functional connectivity self-regulation and motor performance1Department of Psychiatry, Faculty of Medicine. Pontificia Universidad Católica de Chile, Santiago, Chile, 2Interdisciplinary Center for Neuroscience, Pontificia Universidad Católica de Chile, Santiago, Chile, 3Laboratory for Brain Machine Interfaces and Neuromodulation, Pontificia Universidad Católica de Chile, Santiago, Chile, 4Biomedical Imaging Center, Pontificia Universidad Católica de Chile, Santiago, Chile, 5Institute of Medical Psychology and Behavioral Neurobiology, University of Tübingen, Tübingen, Germany, 6Institute for Biological and Medical Engineering, Pontificia Universidad Católica de Chile, Santiago, Chile, 7Department of Electrical Engineering, Pontificia Universidad Católica de Chile, Santiago, Chile
Synopsis
Brain-Computer interfaces have been used for the rehabilitation of motor and cognitive functions. They can be used to train voluntary neural activity, leading to behavioral effects depending on the targeted brain areas.
The aim of this study was to test the feasibility of achieving volitional control of M1-cerebellum functional connectivity with a real-time fMRI (Rt-fMRI) system and evaluates its influence in motor performance.
Nine healthy subjects were trained in a protocol with visual feedback and motor imagery.
The results indicate that voluntary self-regulation of cerebellum-M1 connectivity is feasible with Rt-fMRI, but the effects on motor performance need to be further studied.
Introduction
Brain-Computer interfaces have shown to be promising and useful to rehabilitate motor and cognitive functions. They can be used to train voluntary neural activity, leading to behavioral effects depending on the functional role of the targeted brain regions1.
Since several brain diseases are based on network dysfunctions, it would be relevant to reactivate the connectivity among the critically affected areas. In the case of stroke, restoring M1 and cerebellum activity and functional connectivity are essential for motor rehabilitation2-6.
The aim of this study was to test the feasibility of achieving volitional control of M1-cerebellum functional connectivity and evaluate the influence of volitional control on motor performance in healthy subjects with a real-time fMRI (Rt-fMRI) system.
Materials and methods
Nine healthy subjects (22.8±3.8 years, males, right-handed) were trained in Rt-fMRI protocol with visual feedback and motor imagery, during 3 sessions (once a day), 6 training runs per session (~6 minutes each), alternating baseline (Base) and up-regulation (Upreg) blocks.
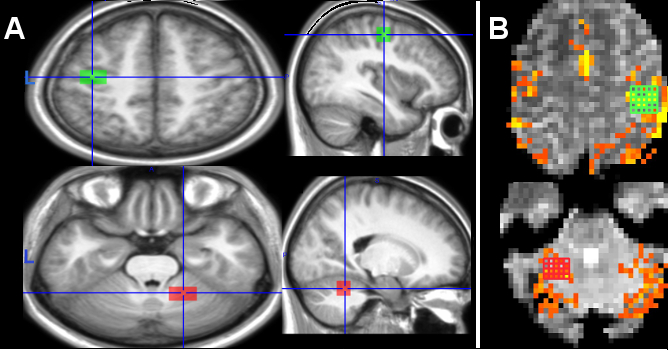
The feedback signal F was computed using the BOLD signal and correlation (functional connectivity) between the regions of interest (ROIs): left M1 and right cerebellar hemisphere (Figure 1), according to:
F = ((a BOLDUpreg–BOLDBase)Cerebellum + (b BOLDUpreg–BOLDBase)M1) * (1+Correlation)
We train a first group of subjects (n=5) with a feedback that weighted equally the contribution of each ROI (EFG: equal-feedback group; a=b=0.5) and a second group (n=4) with a differential weighted ROIs (WFG: weighed-feedback group; a=0.3 and b=0.7).
The Rt-fMRI system was implemented using a 1.5T MR Scanner (Philips Achieva, The Netherlands) running a real-time reconstructor package (DRIN). We used Turbo Brain Voyager software and custom MATLAB scripts to generate feedback information and Presentation software to show that feedback (virtual thermometer) updated every 1.5s.
Anatomical T1-weighted images were acquired each day. FMRI volumes were preprocessed and analyzed using SPM and MATLAB. To evaluate self-regulation success, we defined the BOLD percent change (BPC), which is the ratio between up-regulation and baseline blocks for each run in cerebellum and M1 ROIs. The correlation between the ROIs was calculated off-line using Pearson coefficient. As reference, we also calculated the BPC and correlation coefficients during the overt movement of the right hand. Motor performance consisted of an alternated button-pressing task, using thumbs and index of both hands, during the first and third sessions. We evaluated the number of correct sequences (Hits) and the mean time of a complete sequence (Interval). Also, we consider the mean raw BOLD signal in each ROI to correlate neural activation with motor performance.
Results
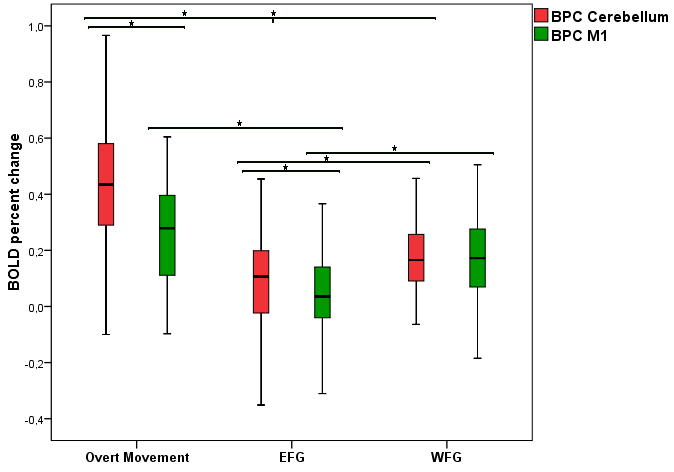
There was a significant difference of the BOLD percent change (BPC) between cerebellum and M1 in overt movement (p<0.001) and in up-regulation for the EFG (p<0.001), but not for the WFG. Also, there was a significant difference with higher BPC in overt movement compared with the EFG in up-regulation for cerebellum (p<0.001) and M1 (p=0.007). However, when comparing overt movement with the WFG in up-regulation there was a significant difference only for the BPC of cerebellum (p=0.005), but not for M1.
Moreover, the BPC of the WFG for both, cerebellum and M1, were significantly higher than the EFG values (p=0.006; p<0.001, respectively) (Figure 2).
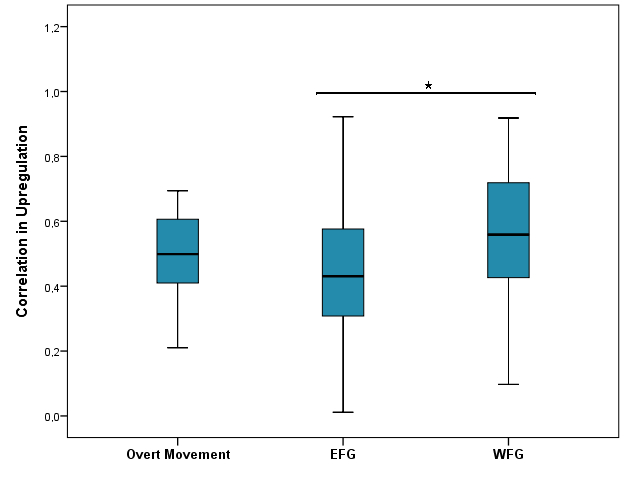
Regarding connectivity, the correlation coefficients of the WFG were higher than those found in overt movement and those reached during up-regulation by the EFG, but only significantly different from the latter (p<0.001) (Figure 3).
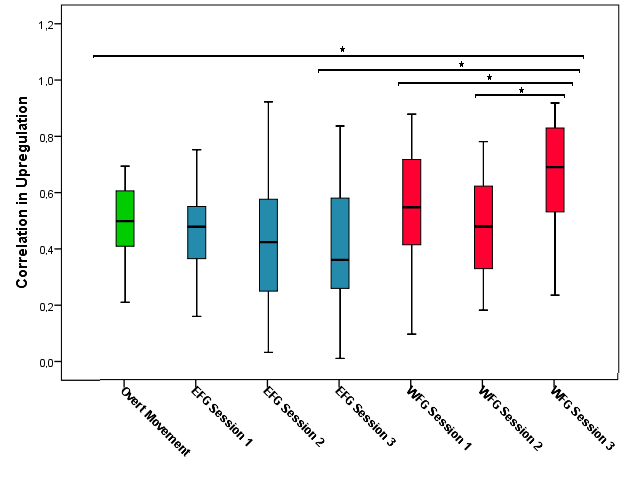
The EFG had significant lower correlation coefficients compared with overt movement (p=0.022) and WFG (p<0.001) at the third session. The WFG showed a significant difference between first and third (p=0.037) and second and third (p=0.002) sessions. Compared to overt movement, the third session of WFG had significant higher correlation coefficients (p=0.002) (Figure 4).
Concerning motor performance, there was a significant difference between the first and third session, for Hits and Interval, in the EFG (p=0.023; p=0.002, respectively) and in the WFG (p=0.011; p<0.001, respectively).
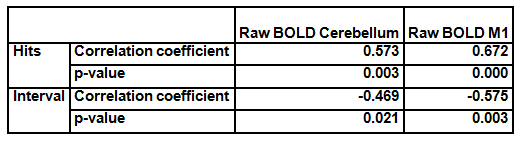
Furthermore, there was a significant correlation between the mean raw BOLD signal during up-regulation and the motor scores, but only for the WFG in the third session (Table 1). However, there was not a significant correlation between the connectivity correlation coefficients and motor performance.
Discussion
The WFG shows higher capability to self-regulate cerebellum-M1 connectivity. This result indicates that even slight modification of the feedback signal can have significant difference in the outcome measures. However, the small sample size and number of sessions make it difficult to draw definitive conclusions about the influence of self-regulation in motor performance.Conclusion
The results indicate that voluntary self-regulation of cerebellum-M1 connectivity is feasible with Rt-fMRI. The effects in motor performance need to be further studied.Acknowledgements
This study is funded by grants: FONDECYT- CONICYT 3150391 and CONICYT-PIA-Anillo ACT1416. Chile.References
1. Ruiz S, Buyukturkoglu K, Rana M, et al. Real-time fMRI brain computer interfaces: Self-regulation of single brain regions to networks. Biological Psychology. 2014; 95: 4– 20.
2. Small S, Hlustik P, Noll D, et al. Cerebellar hemispheric activation ipsilateral to the paretic hand correlates with functional recovery after stroke. Brain. 2002; 125 (7): 1544-1557.
3. Jaillard A, Martin C, Garambois K, et al. Vicarious function within the human primary motor cortex? A longitudinal fMRI stroke study. Brain. 2005; 128 (5): 1122-1138.
4. Weiller C, Chollet F, Friston KJ, et al. Functional reorganization of the brain in recovery from striatocapsular infarction in man. Annals of Neurology. 1993; 31 (5): 463-472.
5. Kim D, Yoo S, Lee J. The inclusion of functional connectivity information into fMRI-based neurofeedback improves its efficacy in the reduction of cigarette cravings. Journal of Cognitive Neuroscience. 2015; J Cogn Neurosci.27 (8): 1552-1572.
6. Megumi F, Yamashita A, Kawato M, et al. Functional MRI neurofeedback training on connectivity between two regions induces long-lasting changes intrinsic functional network. Front Hum Neurosci.Frontiers in Human Neuroscience. 2015; 9: 160.
Figures