1704
Cocaine applied in a “binge paradigm” induces a region-specific and persistent brain circuitry modulation.1Bio-Imaging Lab, University of Antwerp, Wilrijk, Belgium, 2Roche Pharma Research and Early Development, Roche Innovation Center Basel, Basel, Switzerland
Synopsis
Our pre-clinical rodent study showed an increased
Functional Connectivity at the level of the striatum and the cingulate cortex induced
by cocaine injection. The effect was detectable 4 hours after administering
cocaine and sustained for 24h.
Introduction
In this experiment we targeted the dopaminergic system using cocaine hydrochloride in a “binge” application paradigm that has revealed pronounced increases in Delta-, Theta-, and Alpha-Band EEG Power Spectra (1). Since Rs-fMRI networks are demonstrated to correlate with the EEG outcome, we expect to observe modulated rs-fMRI networks with this paradigm.Methods
A resting state fMRI experiments was conducted in 8 control and 7 cocaine-treated Wistar rats anesthetized with medetomidine (Domitor, Pfizer, Germany; bolus 0.05 mg/kg + continuous infusion 0.1 mg/kg/h, SC). The data were acquired on a 9.4T Biospec scanner (Bruker, Ettlingen, Germany) using a GE-EPI sequence with a repetition time (TR) of 2000ms, and echo time (TE) of 16 ms. Twelve axial slices with a slice thickness of 1mm and an in plane resolution of (0.23x0.23) mm2 were scanned 150 times, resulting in a measuring time of 5 min.
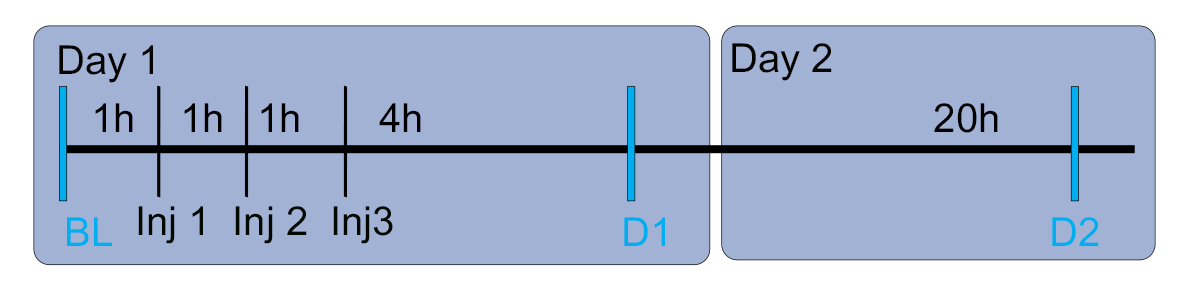
At Day 1 a baseline scan (BL) and a post (3) injections scan were acquired. Three consecutive injections of Cocaine hydrochloride (Sigma-Aldrich) i.p. with a dose of 15 mg/kg or 3 saline injections were given 1 hour apart. Four hours after the last injection the first post treatment scan was acquired (D1) and at day 2 (24 hours after the last injection) the second (D2). Standard pre-processing was carried out using the Statistical Parametric Mapping 8 program (SPM 8). Independent Component Analysis was done using the GIFT toolbox (Group ICA of fMRI toolbox: http://icatb.sourceforge.net/), working in Matlab2008 (www.mathworks.com) with a preset of 15 components. Additionally REST time courses were extracted for seed regions based on the ICA outcome. Functional connectivity (FC) maps were generated in SPM8. Both motion parameters, as well as global signal time courses were regressed out during this analysis to improve the specificity of the FC (2). Statistics were performed using repeated measures ANOVA. The statistical outcome was FWE corrected and only clusters of more than 8 voxels were taken into account.
Results
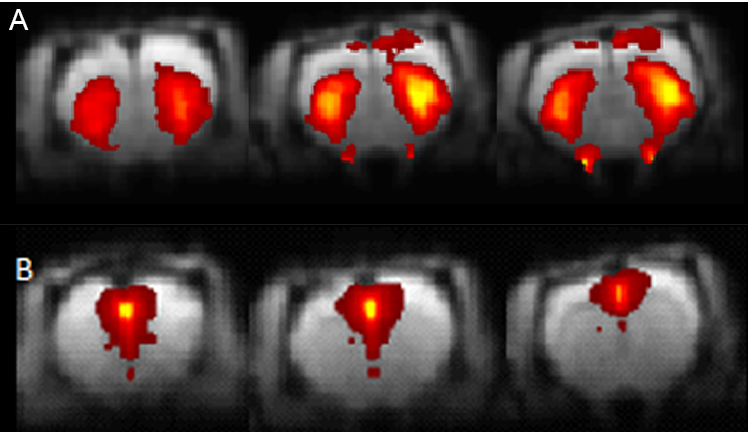
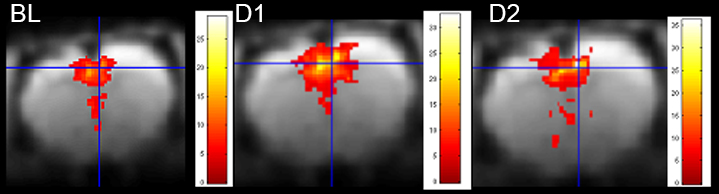
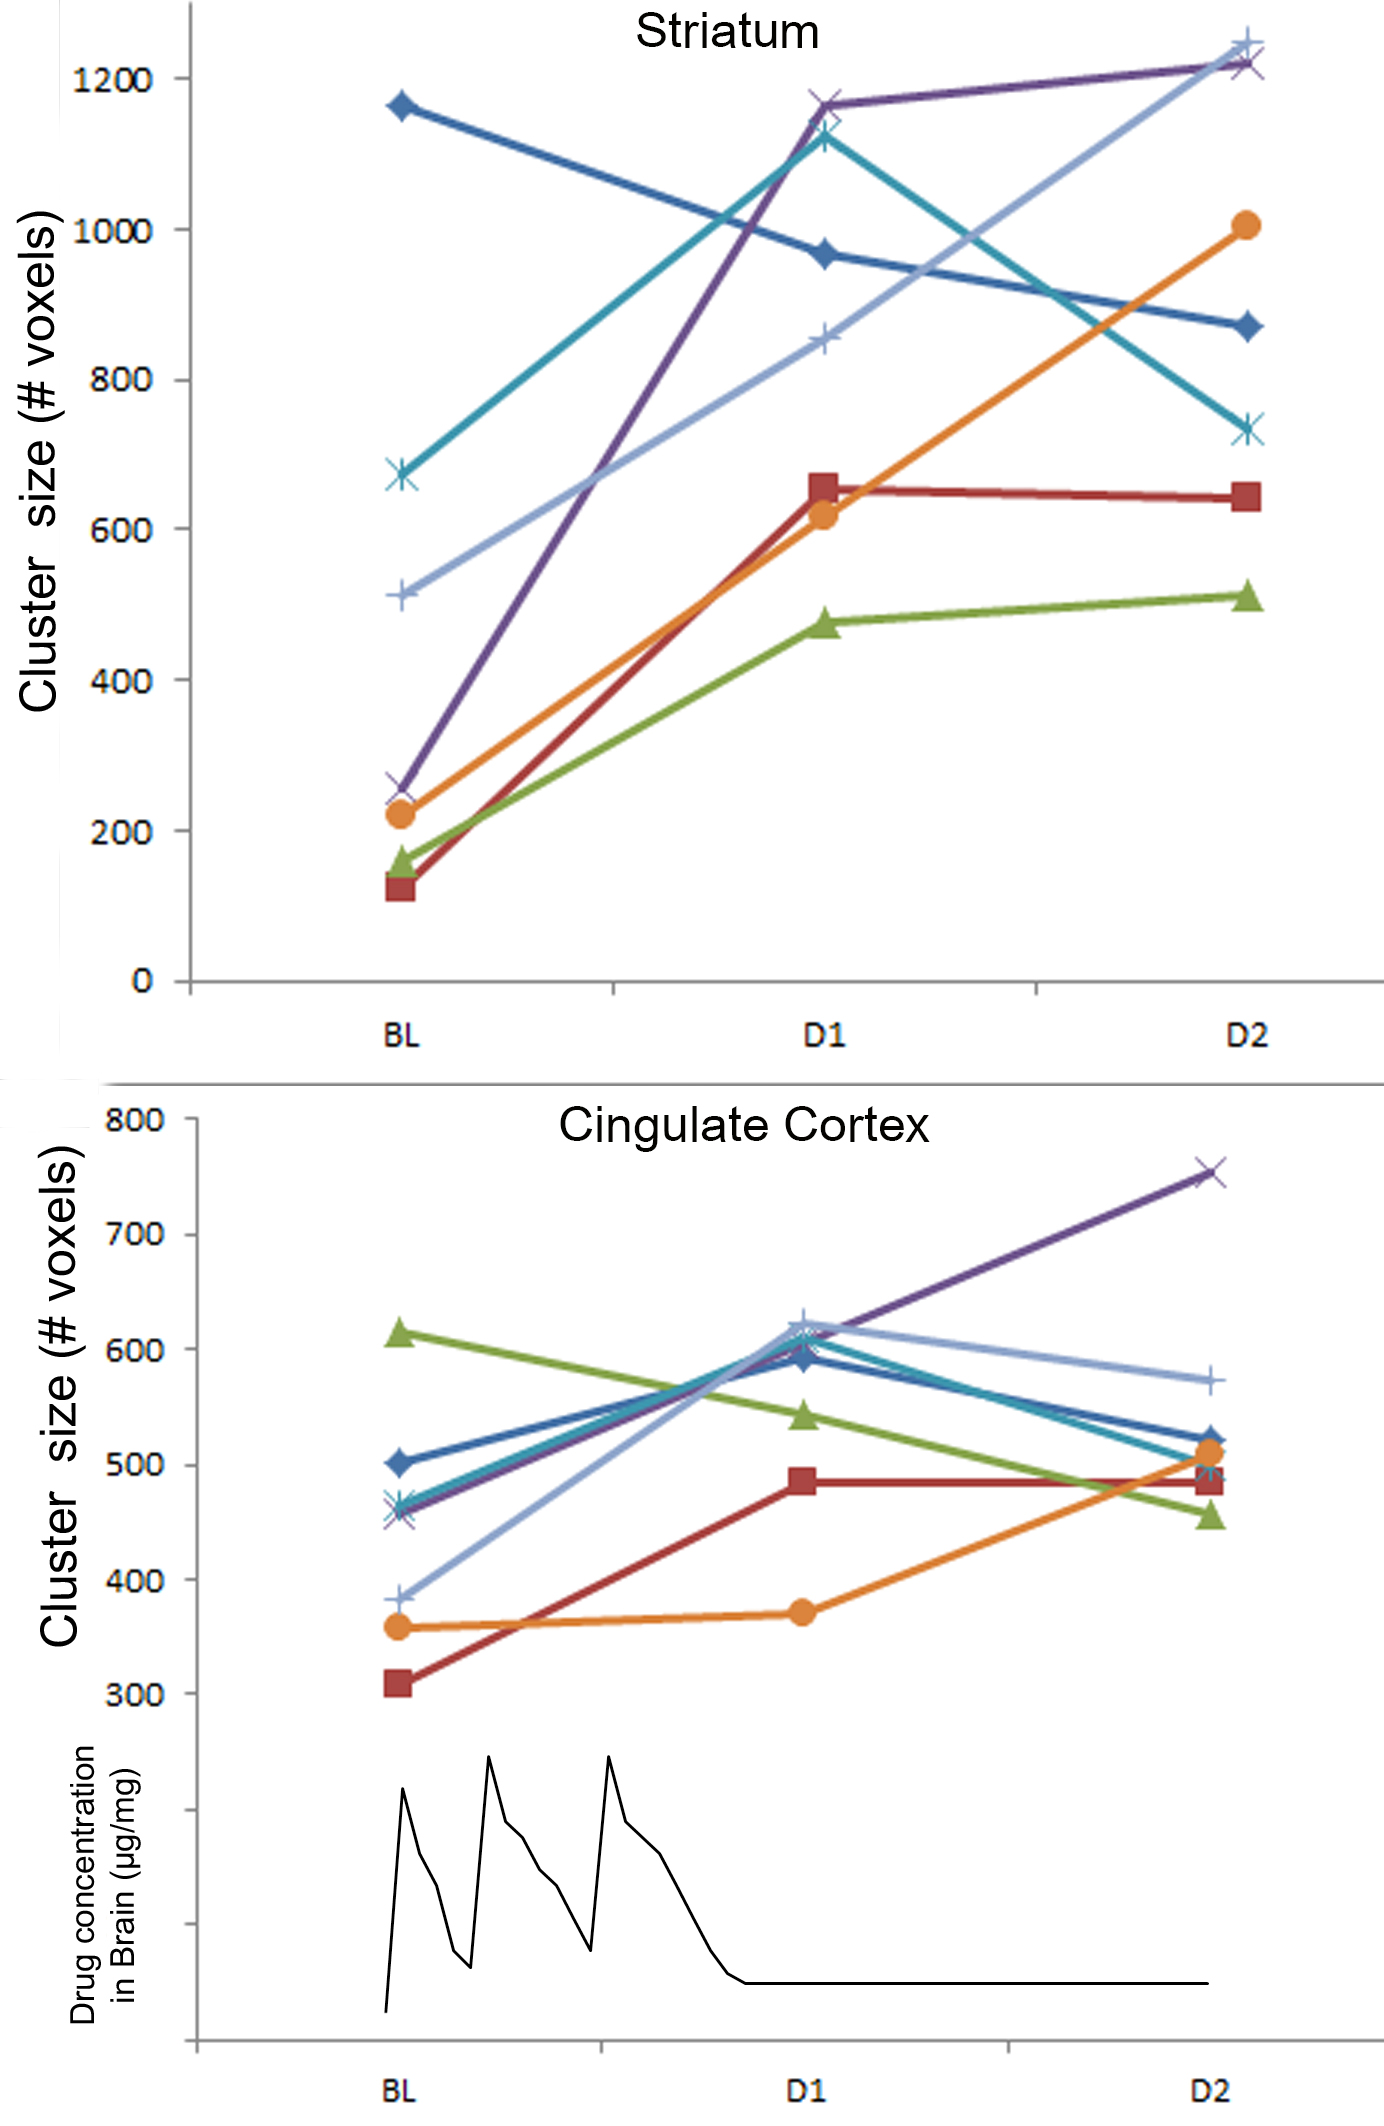
A distinct number of components could be defined co-inciding with anatomical relevant regions in convergence with our previous reports (3) (fig 2). Statistical significant effects were only found in the cocaine treated animals in the cingulate cortex and striatum. Both post treatment time-points showed a significant difference compared to the baseline scan (p=0.009 and p=0.027 resp; FWE corrected) (shown for the cingulate cortex in figure 3). Comparing cluster sizes shows an increase after cocaine injection for both components (fig 4). Additionally, our ICA results were confirmed with seed based analysis for the right cingulate cortex (P=0.001; FWE corrected).Discussion and Conclusion
The outcome showed a change in local FC at the level of the cingulate cortex and striatum (shown in figure 2) after acute cocaine hydrochloride injection. This effect on FC was still present 24h after the last injection indicating long-lasting neuro-circuitry changes independent of acute drug exposure. In fact, even at 4h we expect cocaine brain exposure is close to 0, in line with its pharmacokinetic properties (T1/2brain +/-15min) (4). Hence, both the acute and long lasting change in FC is reflecting plasticity in striatal and cortical networks in response to a cocaine binge paradigm. Our results clearly indicate that: (A) the FC effects of cocaine, detectable 4 and 24h after drug dosing are localized since only two components show a significant difference; (B) the differences in FC are persistent beyond the expected brain exposure of cocaine and normalization of the brain circuits may take longer than the wash-out period chosen in our study; (C) A follow-up study is required to test whether the effect is transient and at what time point normalization in FC in the two brain regions occurs.Acknowledgements
No acknowledgement found.References
1. Urbano FJ, Bisagno V, Wikinski SI, Uchitel OD, Llinas RR. Cocaine acute "binge" administration results in altered thalamocortical interactions in mice. Biological psychiatry. 2009 Oct 15;66(8):769-76. PubMed PMID: 19520366. 2.Kalthoff D, Seehafer JU, Po C, Wiedermann D, Hoehn M. Functional connectivity in the rat at 11.7T: Impact of physiological noise in resting state fMRI. Neuroimage. 2010 10/23/2010;Epub ahead of print. 3. Jonckers E, Van AJ, De VG, Van Der Linden A, Verhoye M. Functional connectivity FMRI of the rodent brain: comparison of functional connectivity networks in rat and mouse. PLoSOne. 2011 2011;6(4):e18876. 4. Benuck M, Lajtha A, Reith ME. Pharmacokinetics of systemically administered cocaine and locomotor stimulation in mice. The Journal of pharmacology and experimental therapeutics. 1987 Oct;243(1):144-9. PubMed PMID: 3668848.Figures