1695
Functional Bold and Functional T1rho Decoupled in Bipolar DisorderJoseph J Shaffer1, Casey P Johnson1, Jeffrey D Long2, Jess G Fiedorowicz3, Gary E Christensen4, John A Wemmie3, and Vincent A Magnotta1
1Radiology, University of Iowa, Iowa City, IA, United States, 2Biostatistics, University of Iowa, Iowa City, IA, United States, 3Psychiatry, University of Iowa, Iowa City, IA, United States, 4Electrical and Computer Engineering, University of Iowa, Iowa City, IA, United States
Synopsis
Functional T1 relaxation in the rotating frame (fT1ρ) is a new method of functional imaging that is thought to reflect changes in brain metabolism due to pH. FT1ρ may provide a more direct measurement of neuronal activity than the blood-oxygen level dependent (BOLD) contrast that is typically used for functional imaging. Here we applied both methods in order to study brain activation during a flashing checkerboard paradigm in participants with bipolar disorder as compared to controls. Linear mixed effect regression modeling revealed decoupling between the two imaging modalities in bipolar disorder in several brain regions.
Purpose
To test the relationship between fT1ρ and BOLD signals in a clinical population.Methods
39 participants with BD and 32 healthy controls underwent functional neuroimaging during alternating fT1ρ and BOLD runs of a flashing checkerboard paradigm. Diagnosis was confirmed by a clinician. Participants provided informed written consent in accordance with the University of Iowa Institutional Review Board.Each run consisted of seven alternating fixation (black screen) and flashing checkerboard (4 Hz) blocks lasting 40s. Participants were asked to press a button in response to a red square presented every 4 seconds during the flashing checkerboard blocks (Figure 1).
MR imaging was performed on a 3T Siemens Magnetom Tim Trio with a 12-channel receiver head coil. High-resolution T1 (coronal 3D MP-RAGE; field-of-view=256mm3; matrix= 256×256×256; resolution=1.0mm3; TR=2530ms; TE=2.8ms; TI=909ms; flip angle=10°; BW=180Hz/px; and R=2 GRAPPA) and T2–weighted (sagittal 3D SPACE; field-of-view=260×228×176 mm3; matrix=256×230×176; resolution=1.0 mm3; TR=4000ms; TE=406ms; BW=592Hz/px; turbo factor=121; slice turbo factor=2; and R=2 GRAPPA) were acquired in order to register functional images to a common atlas space. Functional T1ρ (spin-echo-planar-imaging(SE-EPI) [1]; TR=4s; TSL=10,50ms; SL amplitude(γB1/2π)=213Hz, field-of-view=240×240mm2; matrix=64×64(single shot); slice thickness/gap=5.0/1.25mm; TR=2000 ms; TE=15ms; BW=1954Hz/px; partial Fourier=5/8; fat saturation; 140 measurements) and BOLD (T2*-weighted gradient-echo echo-planar-imaging(GRE-EPI); field-of-view=220×220mm2; matrix=64×64(single shot); 30 slices; slice thickness/gap=4.0/1.0mm; TR=2000ms; TE=30ms; BW=2004Hz/px; fat saturation; 140 measurements) time series were acquired in an axial-olique orientation with the most inferior slice positioned at the base of the frontal and occipital lobes.
BRAINS AutoWorkup [2] and Advanced Normalization Tools (ANTS) were used on T1 and T2-weighted anatomical images to generate transformation to a common atlas for functional image registration [3]. Functional voxels were masked to exclude non-brain tissue and areas with <95% coverage across participants. Images were transformed to the Montreal Neurological Imaging (MNI) atlas space [4] after analysis for publication.
Functional images were processed using Analysis of Functional NeuroImages (AFNI) [5]. Anatomical registration, skull-stripping, and spatial smoothing(5mmFWHM Gaussian) were performed. T1ρ signal was calculated by fitting the 10 ms and 50 ms spin-lock time images to a mono-exponential signal decay model [1]. Percent signal change for fT1ρ and BOLD were calculated using a general linear model that modeled the timing of the flashing checkerboard blocks, second-order baseline correction, and motion parameters.
Linear mixed effect regression was used to test whether the relationship between BOLD and fT1ρ was altered in BD. A null model that included group and fT1ρ as predictors for the BOLD signal and an experimental model that also included the Group x fT1ρ interaction were compared using a likelihood ratio test [6]. Voxels where these two models were significantly different and where there was a significant effect of the interaction are presented in Figure 2. 3dclustsim was used to determine a threshold (1.44 cm3) for cluster-based correction for multiple comparisons (α=0.05).
Results
The relationship between fT1ρ signal and BOLD signal was weaker in BD in left caudate, thalamus, occipital pole, and middle and superior temporal gyri; right lateral occipital cortex and inferior temporal gyrus; and bilateral visual cortex and cerebellum (Figure 2) and was stronger in left inferior and middle temporal gyri.Conclusions
fT1ρ and BOLD were decoupled in BD, suggesting that distinct mechanisms underlie these signals. Changes in BOLD that occur following neuron activity [7-9] require astrocyte signalling[10, 11] and occurs 4-6 seconds after stimulation [9]. FT1ρ is sensitive to pH [12, 13] and is thought to increase following activity due to increases in acidic metabolic and signalling molecules[14].There was a weaker relationship between fT1ρ and BOLD in BD in several brain regions, but a stronger relationship was observed in others. These regions have been implicated in BD by prior BOLD imaging studies [15-22], suggesting that our results are disease-related. However, our findings may also change the interpretation of prior studies, as BOLD differences in clinical populations may reflect decoupling between neuron activity and blood flow. Our findings suggest an altered relationship between metabolism and blood flow in BD and that a combined imaging approach may provide new information about disease.
Acknowledgements
No acknowledgement found.References
1. Johnson, C.P., et al., Rapid acquisition strategy for functional T1ρ mapping of the brain. Magn Reson Imaging, 2014. 32(9): p. 1067-77.2. Pierson, R., et al., Fully automated analysis using BRAINS: AutoWorkup. Neuroimage, 2011. 54(1): p. 328-36.
3. Halle, M., et al., Multi-modality MRI-based Atlas of the Brain. 2015, SPL.
4. Evans, A., et al., 3D statistical neuroanatomical models from 305 MRI volumes, in Nuclear Science Symposium and Medical Imaging Conference, 1993., 1993 IEEE Conference Record. 1993. p. 1813-1817.
5. Cox, R.W., AFNI: software for analysis and visualization of functional magnetic resonance neuroimages. Comput Biomed Res, 1996. 29(3): p. 162-73.
6. Verbeke, G. and G. Molenberghs, Linear Mixed Models for Longitudinal Data. Springer Series in Statistics. 2000, New York: Springer.
7. Magri, C., et al., The Amplitude and Timing of the BOLD Signal Reflects the Relationship between Local Field Potential Power at Different Frequencies. J Neuroscience, 2012. 32(4): p. 139501407.
8. Logothetis, N.K., et al., Neurophysiological investigation of the basis of the fMRI signal. Nature, 2001. 412(6843): p. 150-7.
9. Baumann, S., et al., Characterisation of the BOLD response time course at different levels of the auditory pathway in non-human primates. Neuroimage, 2010. 50(3-3): p. 1099-108.
10. Takano, T., et al., Astrocyte-mediated control of cerebral blood flow. Nat Neurosci, 2006. 9(2): p. 260-7.
11. Rossi, D.J., Another BOLD role for astrocytes: coupling blood flow to neural activity. Nature Neuroscience, 2006. 9(2): p. 159-161.
12. Heo, H.Y., et al., Evaluation of activity-dependent functional pH and T1ρ response in the visual cortex. Neuroimage, 2014. 95: p. 336-43.
13. Kettunen, M.I., et al., Effects of intracellular pH, blood, and tissue oxygen tension on T1rho relaxation in rat brain. Magn Reson Med, 2002. 48(3): p. 470-7.
14. Belanger, M., I. Allaman, and P. Magistretti, Brain Energy Metabolism: Focus on Astrocyte-Neuron Metabolic Cooperation. Cell Metabolism, 2011. 14(6): p. 724-738.
15. Townsend, J.D., et al., Deficits in inferior frontal cortex activation in euthymic bipolar disorder patients during a response inhibition task. Bipolar Disord, 2012. 14(4): p. 442-50.
16. Strakowski, S.M., et al., fMRI brain activation in bipolar mania: Evidence for disruption of the ventrolateral prefrontal-amygdala emotional pathway. Biol Psychiatry, 2011. 69(4): p. 381-8.
17. Keener, M.T. and M.L. Phillips, Neuroimaging in Bipolar Disorder: A Critical Review of Current Findings. Curr Psychiatry Rep, 2007. 9(6): p. 512-20.
18. Whitton, A.E., M.T. Treadway, and D.A. Pizzagalli, Reward processing dysfunction in major depression, bipolar disorder and schizophrenia. Curr Opin Psychiatry, 2015. 28(1): p. 7-12.
19. Gruber, S.A., J. Rogowska, and D.A. Yurgelun-Todd, Decreased activation of the anterior cingulate in bipolar patients: an fMRI study. J Affect Disord, 2004. 82(2): p. 191-201.
20. Yoshimura, Y., et al., Psychosocial functioning is correlated with activation in the anterior cingulate cortex and left lateral prefrontal cortex during a verbal fluency task in euthymic bipolar disorder: a preliminary fMRI study. Psychiatry Clin Neurosci, 2014. 68(3): p. 188-96.
21. Maletic, V. and C. Raison, Integrated neurobiology of bipolar disorder. Front Psychiatry, 2014. 5: p. 98.
22. Cerullo, M.A., et al., The functional neuroanatomy of bipolar disorder. Int Rev Psychiatry, 2009. 21(4): p. 314-22.
Figures
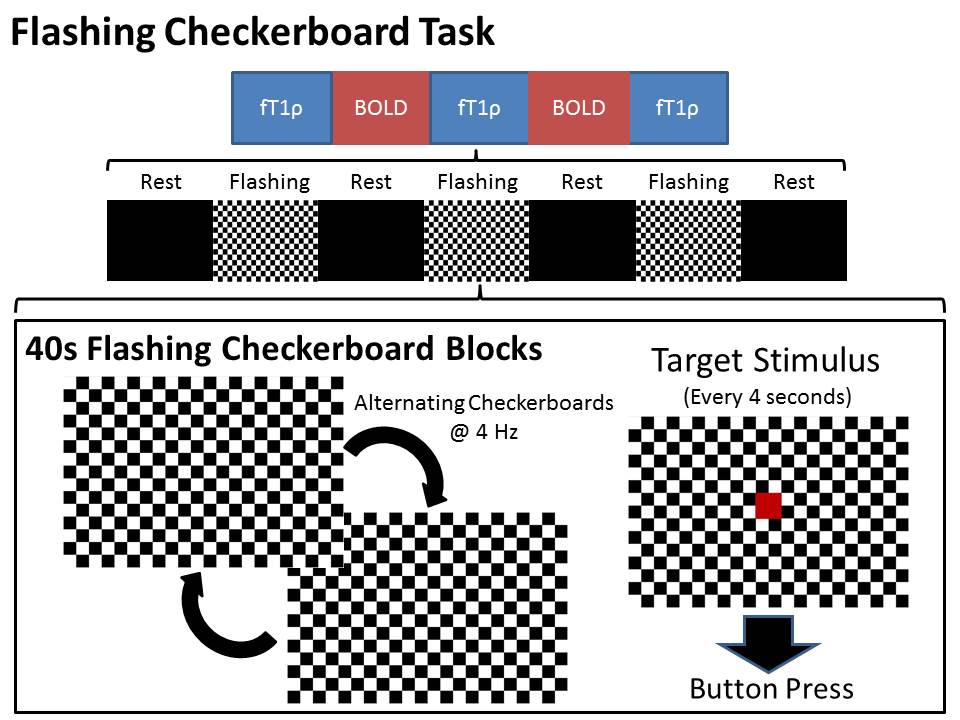
Diagram of imaging runs and flashing
checkerboard task.
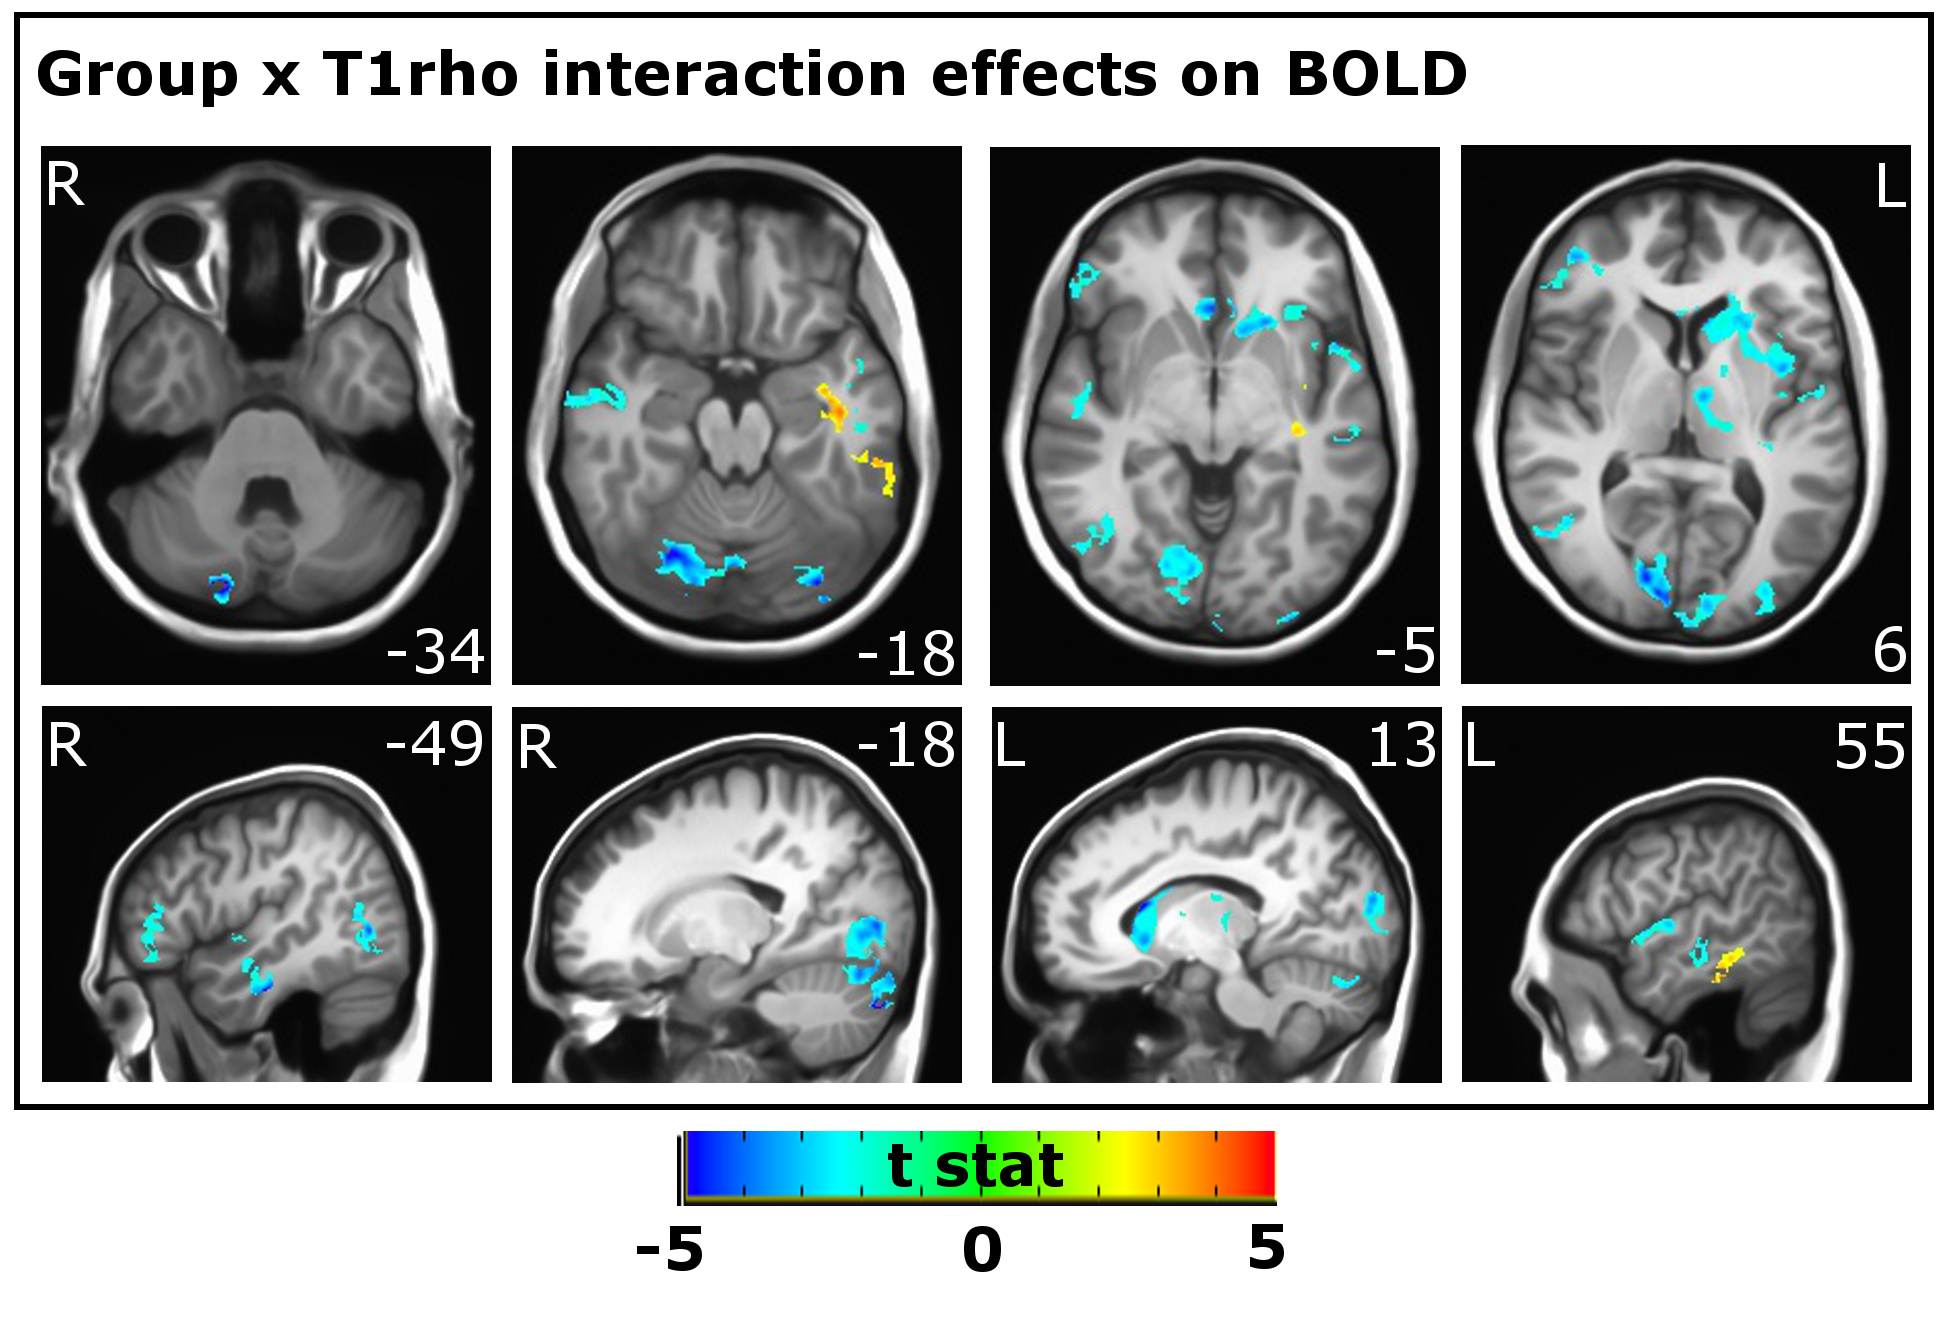
Clusters
with significant Group x T1ρ on BOLD signal. Weaker relationships between T1ρ
and BOLD are shown in blue; stronger relationships are shown in red/yellow.
Slice number (MNI coordinates) for axial and sagittal images are provided for
the Z and X planes respectively. L: Left, R: Right